Lin S.D. Water and Wastewater Calculations Manual
Подождите немного. Документ загружается.

Step 9. Determine the volume V of aeration tank required, based on organic
removal process
V ⫽ Qu ⫽ (3785 m
3
/d) (0.269 day)
⫽ 1020 m
3
⫽ 36,000 ft
3
Step 10. Compute BOD
5
loading rate
BOD loading ⫽ (3785 m
3
/d)(160 g/m
3
)/(1000 g/kg)
⫽ 606 kg/d
BOD loading rate ⫽ (606 kg/d)/(1020 m
3
)
⫽ 0.59 kg/(m
3
.
d)
⫽ 37.1 lb/(1000 ft
3
⭈ d) (OK)
Note: This rate is below the range of 50 to 120 lb/(1000 ft
3
.
d) for the complete-
mix activated-sludge process.
Step 11. Estimate the total quantity of oxygen supply needed
The total quantity of oxygen required can be estimated on the basis of oxygen
demand for BOD
5
and TKN removal and net mass of volatile solids (cells) pro-
duced with conversion factors. A procedure similar to the one illustrated in
the section on the activated-sludge process may be used.
Alternatively, a rough estimation can be calculated by the following equation
from the influent BOD
5
and TKN concentrations (Metcalf and Eddy, Inc. 1991)
O
2
, lb/d ⫽Q(kS
0
⫹ 4.57 TKN) 8.34
where Q ⫽ influent flow, Mgal/d
k ⫽ conversion factor for BOD loading on nitrification system
⫽ 1.1 to 1.25
4.57 ⫽ conversion factor for complete oxidation of TKN
8.34 ⫽ a conversion factor, lb/((Mgal ⭈ mg/L)
For this example, let k ⫽ 1.18 and SF ⫽ 2.5. Then
Required O
2
, lb/d ⫽ 1 Mgal/d [1.18(160 mg/L) ⫹ 4.57(30 mg/L)]
⫻ [8.34 lb/(Mgal
.
mg/L)] ⫻ 2.5
⫽ 6795 lb/d
⫽ 3082 kg/d
Step 12. Determine the sludge wasting schedule
Sludge wasting includes solids contained in the effluent from secondary clar-
ifier effluent and sludge waste in the return activated sludge or mixed liquor.
Wastewater Engineering 785

The sludge to be wasted under steady-state conditions is the denomi-
nator of Eq. (6.71)
Total solids wasted per day is
Q
wa
X ⫹ Q
e
X
e
⫽ VX/u
c
V ⫽ 1020 m
3
X ⫽ MLVSS ⫽ 0.8 ⫻ MLSS ⫽ 0.8 ⫻ 2500 mg/L
⫽ 2000 mg/L
VX ⫽ 1020 m
3
⫻ 2000 (g/m
3
)/(1000 g/kg)
⫽ 2040 kg
u
c
⫽ 10 days (use design u
c⫺d
, Step 4)
VX /u
c
⫽ 2040 kg/10 days
⫽ 204 kg/d
The solids contained in the clarifier effluent at 3785 m
3
/d (1 Mgal/d) are
calculated from the VSS in the effluent
Effluent VSS ⫽ 0.8 ⫻ 15 mg/L ⫽ 12 mg/L ⫽ 12 g/m
3
Q
e
X
e
⫽ 3785 m
3
/d ⫻ 12(g/m
3
)/(1000 g/kg)
⫽ 45.4 kg/d
The VSS (microorganism concentration) to be wasted from mixed liquor or
return sludge is
Q
wa
X ⫽ VX/u
c
⫺ Q
e
X
e
⫽ (204 – 45) kg/d
⫽ 159 kg/d
Step 13. Check the buffering capacity of the wastewater
Theoretically 7.14 mg/L of alkalinity as CaCO
3
is destroyed per mg/L of
NM
⫹
4
-N oxidized. The alkalinity remaining after nitrification would be at least
Alk. ⫽ 190 mg/L – 7.14 (15 mg/L)
⫽ 83 mg/L as CaCO
3
This should be sufficient to maintain the pH value in the aeration tanks
above 7.2.
Combined carbon oxidation–nitrification in attached growth reactors.
Two
attached growth reactors, the trickling filter process and the RBC
process, can be used for combined carbon oxidation–nitrification.
u
c
5
VX
Q
wa
X 1 Q
e
X
e
786 Chapter 6
Detailed design procedures for these two processes are described else-
where (US EPA, 1975c) and in the manufacturers’ design manual.
In the design of nitrification with trickling filters, the total surface
area required is determined on the basis of empirical unit surface area
for unit NH
⫹
4
-N oxidized per day under the BOD/TKN and the sustained
temperature conditions. The choice of filter media is based on the efflu-
ent BOD
5
and SS requirements. A circulation rate of 1:1 is usually
adequate.
Nitrification with RBC system. For a combined oxidation–nitrification
process with the RBC system, a two-step design procedure is needed.
Significant nitrification will not occur in the RBC process until the sol-
uble BOD concentration is reduced to 15 mg/L or less (Autotrol, 1979).
In the first design the media surface area required to reduce SBOD is
determined as shown in the example illustrated in the previous section.
For influent ammonia nitrogen concentrations of 15 mg/L or above, it
is necessary to reduce SBOD concentrations to less than 15 mg/L, i.e.
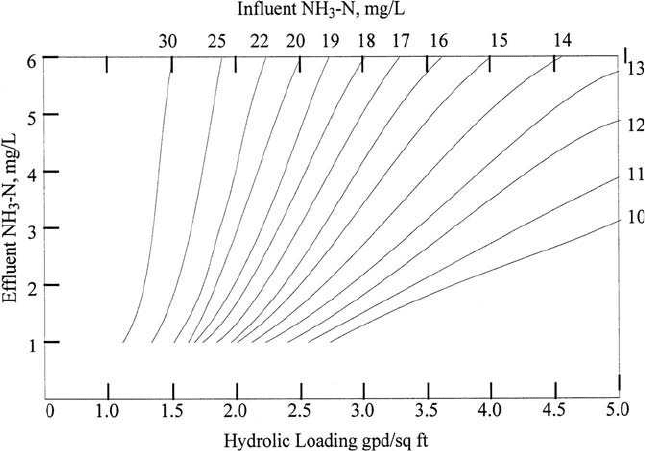
to about the same value as the ammonia nitrogen concentration. The
second design uses the nitrification design curves (Fig. 6.50) to deter-
mine the RBC area to reduce the influent ammonia nitrogen level to
the required effluent concentration. The sum of the two RBC surface
areas is determined as the total surface area required for the combined
Wastewater Engineering 787
Figure 6.50 RBC process design curve for nitrification of domestic wastewater (source:
Autotrol, 1979).
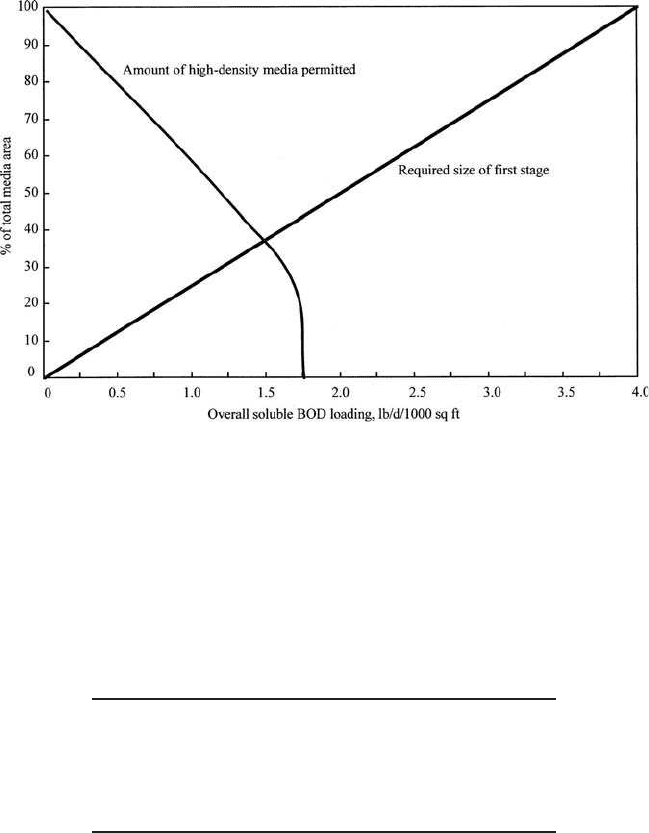
carbon oxidation–nitrification system. Figure 6.51 shows the design curves
for RBC carbon oxidization–nitrification of municipal wastewater. If the
wastewater temperature is less than 55⬚F (12.8⬚C), a separate tempera-
ture correction should be made to each of the surface areas determined.
Example: Design an RBC system for organic and nitrogen removal with the
following data. The effluent SBOD and NH
3
-N are to be 6 and 2 mg/L, respec-
tively. Total BOD ⫽ 12 mg/L.
Design inflow 4.0 Mgal/d (15,140 m
3
/d)
Influent soluble BOD 70 mg/L
Effluent soluble BOD 6 mg/L
Influent NH
3
-N 18 mg/L
Effluent NH
3
-N 2 mg/L
Wastewater temperature ⱖ 55⬚F (12.8⬚C)
solution:
Step 1. Determine the required surface area
(a) Determine hydraulic loading HL to reduce SBOD from 70 mg/L to 15 mg/L
for starting nitrification
From Fig. 6.33
HL
b
⫽ 3.32 gal/(d ⭈ ft
2
) for the influent SBOD ⫽ 70 mg/L
788 Chapter 6
Figure 6.51 Design curves for RBC carbon oxidation–nitrification of domestic wastewater.

(b) Determine HL to reduce NH
3
-N from 18 mg/L to 2 mg/L
From Fig. 6.50
HL
n
⫽ 2.1 gal/(d ⭈ ft
2
)
(c) Determine overall hydraulic loading HL
o
(d) Determine HL for reducing SBOD to 6 mg/L
From Fig. 6.33
HL
b
⫽ 2.0 gal/(d ⭈ ft
2
)
This is greater than HL
o
; thus, nitrification controls the overall design HL.
Calculate the surface area requirement
Step 2. Determine the size of first stage
(a) Calculate overall SBOD loading area
(b) Sizing of first stage
The size of the first stage can be found from the manufacturer’s design
curve (Fig. 6.51) or by proportional calculation. An SBOD loading rate
of 4.00 lb/(d ⭈ 1000 ft
2
) uses 100% of the total media area. Therefore
(c) Calculate surface area of first stage
Area ⫽ 0.19 (3,100,000 ft
2
)
⫽ 589,000 ft
2
X 5 18.8% or 19%
X%
100%
5
0.75 lb/sd
#
1000 ft
2
d
4.00 lb/sd
#
1000 ft
2
d
5 0.75 lb/d
#
1000 ft
2
SBOD loading 5
4 Mgal/d 3 70 mg/L 3 8.34 lb/sMgal
#
mg/Ld
3,100,000 ft
2
5 3,100,000 ft
2
Area 5
4,000,000 gal/d
1.29 gal/sd
#
ft
2
d
HL
o
5 1.29 gal/sd
#
ft
2
d
1
HL
o
5
1
HL
b
1
1
HL
n
5
1
3.32
1
1
2.1
Wastewater Engineering 789

Step 3. Determine media distribution
(a) Using high-density media, from Fig. 6.51,
maximum % of total media area ⫽67% for 0.75 lb SBOD/(d
.
1000 ft
2
)
(b) High-density surface area
⫽ 0.67 (3,100,000 ft
2
)
⫽ 2,077,000 ft
2
(c) Standard media surface area
⫽ (l – 0.67)(3,100,000 ft
2
)
⫽ 1,023,000 ft
2
Step 4. Select configuration
(a) Standard media, S, (100,000 ft
2
per unit) assemblies in first stage
(b) Standard media (total)
(c) High-density media, H, (150,000 ft
2
per unit) assemblies
(d) Choose between three trains of five-stage operation as shown below
3 (SS ⫹ SS ⫹ HH ⫹ HH ⫹ H) ⫽ 27 (units with 5 stages in 3 trains)
or three trains of four-stage operation
3 (SS ⫹ SS ⫹ HHH ⫹ HH) ⫽ 27 (units with 4 stages in 3 trains)
Step 5. No temperature correction is needed, since the wastewater tem-
perature is above 12.8⬚C (55⬚F).
5 13.8 suse 15 unitsd
5
2,077,000
150,000
5 10.23 suse 12 unitsd
5
1,023,000
100,000
5 5.9 units suse 6 units with 3 trainsd
5
589,000 ft
2
100,000 ft
2
/unit
790 Chapter 6
Step 6. Determine power consumption
A rough estimation of power consumption is 2.5 kW per shaft
Power consumption ⫽ 2.5 kW/shaft ⫻ 27 shafts
⫽ 67.5 kW
Denitrification.
Biological denitrification is the conversion of nitrate to
gaseous nitrogen species and to cell material by the ubiquitous hetero-
trophic facultative aerobic bacteria and some fungi. Denitrifiers include a
broad group of bacteria such as Pseudomonas, Micrococcus, Archromobacter,
and Bacillus (US EPA, 1975b). These groups of organisms can use either
nitrate or oxygen as electron acceptor (hydrogen donor) for conversion
of nitrate to nitrogen gas. Denitrification occurs in both aerobic and
anoxic conditions. An anaerobic condition in the liquid is not necessary
for denitrification, and 1 to 2 mg/L of DO does not influence denitrifi-
cation. The term anoxic is preferred over anaerobic when describing
the process of denitrification.
The conversion of nitrate to gaseous end products is a two-step
process, called dissimilatory denitrification, with a series of enzymatic
reactions. The first step is a conversion of nitrate to nitrite, and the second
step converts the nitrite to nitrogen gas. The nitrate dissimilations are
expressed as follows (Stanier et al., 1963)
2NO
3
⫺
4e
⫺
⫹ 4H
⫹
S 2NO
2
⫺
⫹ 2H
2
O (6.194)
2NO
2
⫺
⫹ 6e
⫺
⫹ 8H
⫹
S N
2
⫹ 4H
2
O (6.195)
Overall transformation yields
2NO
3
⫺
⫹ 10e
⫺
⫹ 12H
⫹
S N
2
⫹ 6H
2
O (6.196)
For each molecule of nitrate reduced, five electrons can be accepted.
When methanol (CH
3
OH) is used on the organic carbon sources, the dis-
similatory denitrification can be expressed as follows:
First step
6NO
3
⫺
⫹ 2CH
3
OH S 6NO
2
⫺
⫹ 4H
2
O ⫹ 2CO
2
(6.197)
Second step
6NO
2
⫺
⫹ 3CH
3
OH S 3N
2
⫹ 3H
2
O ⫹ 3CO
2
⫹ 6OH
⫺
(6.198)
Overall transformation
6NO
3
⫺
⫹ 5CH
3
OH S 3N
2
⫹ 7H
2
O ⫹ 5CO
2
⫹ 6OH
⫺
(6.199)
Wastewater Engineering 791
In Eq. (6.199), nitrate serves as the electron acceptor and methanol as
the electron donor.
When methanol is used as an organic carbon source in the conversion
of nitrate to cell material, a process termed assimilatory (or synthesis)
denitrification, the stoichiometric equation is
3NO
3
⫺
⫹ 14CH
3
OH ⫹ 4H
2
CO
3
→ 3C
5
H
7
O
2
N ⫹ 20H
2
O ⫹ 3HCO
3
⫺
(6.200)
From Eq. (6.200), neglecting cell synthesis, 1.9 mg of methanol is
required for each mg of NO
3
-N reduction (M/N ratio). Including synthesis
results in an increase in the methanol requirement to 2.47 mg. The
total methanol requirement can be calculated from that required for
nitrate and nitrite reductions and deoxygenation as follows (McCarty
et al., 1969):
C
m
⫽ 2.47 (NO
3
-N) ⫹ 1.53 (NO
2
-N) ⫹ 0.87DO (6.201)
where C
m
⫽ methanol required, mg/L
NO
3
-N ⫽ nitrate nitrogen removed, mg/L
NO
2
-N ⫽ nitrite nitrogen removed, mg/L
DO ⫽ dissolved oxygen removed, mg/L
Biomass production can be computed similarly
C
b
⫽ 0.53 (NO
3
-N) ⫹ 0.32 (NO
2
-N) ⫹ 0.19DO (6.202)
where C
b
⫽ biomass production, mg/L
In general, an M/N ratio of 2.5 to 3.0 is sufficient for complete deni-
trification (US EPA, 1975c). A commonly used design value for the
required methanol dosage is 3 mg/L per mg/L of NO
3
-N to be reduced.
Example: Determine the methanol dosage requirement, the M/N ratio,
and biomass generated for complete denitrification of an influent with a
nitrate-N of 24 mg/L, nitrite-N of 0.5 mg/L, and DO of 2.5 mg/L.
solution:
Step 1. Determine methanol required, using Eq. (6.201)
C
m
⫽ 2.47 (NO
3
-N) ⫹ 1.53 (NO
2
-N) ⫹ 0.87 DO
⫽ 2.47 (24 mg/L) ⫹ 1.53 (0.5 mg/L) ⫹ 0.87 (2.5 mg/L)
⫽ 62.2 mg/L
Step 2. Calculate M/N ratio
M/N ⫽ (62.2 mg/L)/(24 mg/L)
⫽ 2.6
792 Chapter 6

Step 3. Calculate biomass generated, using Eq. (6.202)
C
b
⫽ 0.53 (NO
3
-N) ⫹ 0.32 (NO
2
-N) ⫹ 0.19 DO
⫽ 0.53 (24 mg/L) ⫹ 0.32 (0.5 mg/L) ⫹ 0.19 (2.5 mg/L)
⫽ 13.4 mg/L
Kinetics of denitrification. Similarly to nitrification, environmental fac-
tors affect the kinetic rate of denitrifier growth and nitrate removal.
These factors are mentioned in the previous section.
Effect of nitrate on kinetics. The effect of nitrate on denitrifier growth rate
can be expressed by the Monod equation
(6.203)
where m
D
⫽ growth rate of denitrifier, per day
⫽ maximum growth rate of denitrifier, per day
D ⫽ nitrate-N concentration, mg/L
K
D
⫽ half saturation constant, mg/L nitrate-N
⫽ 0.08 mg/L NO
3
-N, for suspended-growth systems without
solids recycle at 20⬚C
⫽ 0.16 mg/L NO
3
-N, for suspended-growth systems with
solids recycle at 20⬚C
⫽ 0.06 mg/L NO
3
-N, for attached-growth systems at 25⬚C
With the effects of wastewater temperature (T, ⬚C) and dissolved
oxygen (DO, mg/L), the overall rate of denitrification can be described
as follows:
(6.203a)
Denitrification rates can be related to denitrifier growth rates by the fol-
lowing relationship (US EPA, 1975c)
r
D
⫽ m
D
/Y
D
(6.204)
where r
D
⫽ nitrate removal rate, lb (NO
3
-N)/lb VSS/d
Y
D
⫽ gross yield of denitrifier, lb VSS/lb (NO
3
-N)
Similarly, peak denitrification rates are related to maximum denitri-
fier growth rates as follows:
(6.205)
r
ˆ
D
5 m
ˆ
D
/Y
D
m
D
5 m
ˆ
D
3
D
K
D
1 D
3 1.09
sT220d
3 s1 2 DOd
m
ˆ
D
m
D
5 m
ˆ
D
D
K
D
1 D
Wastewater Engineering 793
Solids retention time. Consideration of solids production and solids
retention time is an important design consideration for the system.
Similar to Eq. (6.84), a mass balance of the biomass in a completely
mixed reactor yields the relationship (Lawrence and McCarty, 1970)
(6.206)
where u
c
⫽ solids retention time, day
K
d
⫽ decay coefficient, day
⫺1
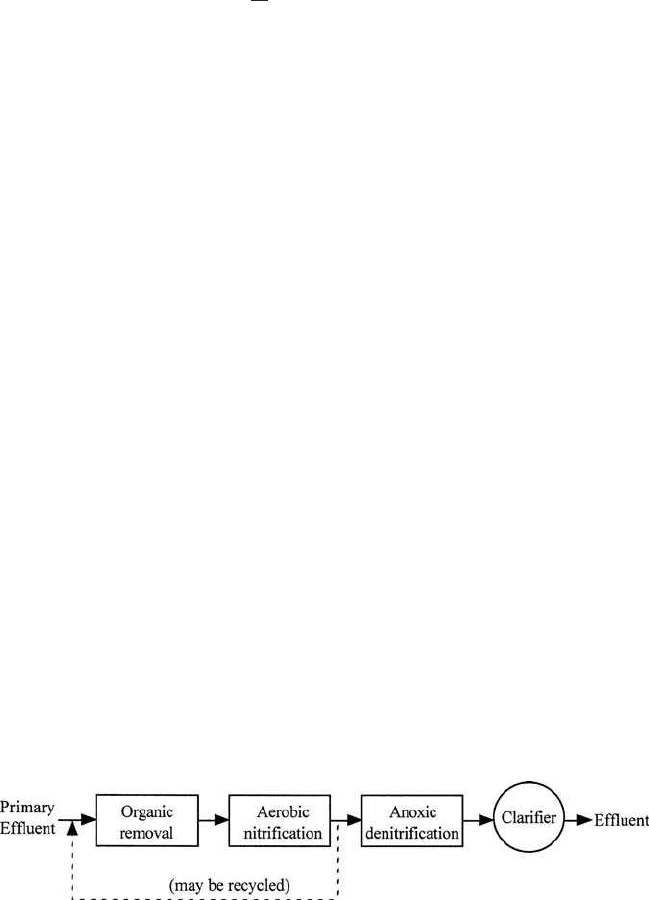
Denitrification with RBC process. The RBC process has been applied to
biological denitrification by completely submerging the rotating media
and by adding an appropriate source of organic carbon. Figure 6.52 is
a schematic process flow diagram of carbon oxidation–nitrification–
denitrification. Methanol is added to the denitrification stage, in which
the rotational speed is reduced. Methanol requirements are a significant
portion of the operating cost. In a completely submerged mode, RBC will
remove nitrate nitrogen at a rate of approximately 1 lb/(d ⭈ 1000 ft
2
)
while treating influent nitrate concentrations up to 25 mg/L and pro-
ducing effluent nitrate nitrogen concentrations below 5 mg/L. The design
curves for RBC denitrification of municipal wastewater are presented
in Fig. 6.53 (Autotrol, 1979).
Denitrification is a relatively rapid reaction compared to nitrifica-
tion. It is generally more economical to reduce nitrate nitrogen to as low
a level as can be achieved by the RBC process, i.e. ⱕ 1.0 mg/L.
Example: Design a denitrification RBC system following organic oxidation–
nitrification, using data for the example in the section on nitrification with
the RBC system. The treatment plant is designed to produce a final effluent of
4 mg/L total nitrogen (2 mg/L of NH
3
-N, 3 mg/L of TKN, and 1 mg/L of NO
3
-N).
Given conditions:
Design flow ⫽ 4.0 Mgal/d
Influent NH
3
-N (nitrification) ⫽ 18 mg/L
Effluent NH
3
-N ⫽ 2 mg/L
Wastewater temperature ⱖ 55⬚F
1
u
c
5 Y
D
r
D
2 K
d
794 Chapter 6
Figure 6.52 Schematic RBC process for BOD removal, nitrification, and denitrification.