Li S.Z., Jain A.K. (eds.) Encyclopedia of Biometrics
Подождите немного. Документ загружается.


New Requirements for Security in
Biometric Sample Acquisition
Biometric sample acquisition systems have begun to
take a roll in user identity verification in mobile com-
puting and communication systems. Examples incl ude
the previously discussed fingerprint enabled laptops
and biometrically secured cellphones as well. This is a
different type of role than that played by biometric
systems in the forensic and criminology worlds, be-
cause these new systems operate in unsupervised and
usually insecure situations. This section examines
some of the implications of that new role for biometric
sample acquisition and the new requirements imposed
on biometric sample acquisition by that role.
Using Biometric Data in Trustworthy
Identity Verification
While biometric verification is often used as a replace-
ment for passwords, biometric methods when applied
to identity verification function more like a handwrit-
ten signature and less like a password. This is not
surprising, since a handwritten signature is considered
as a form of biometric identit y verification.
It can be argued that biometric sample data of any
kind can not be considered secret, h ence
▶ Trustwor-
thy Biometric Identity Verification in unsupervised
situations requires the biometric sample acquisition
system to function as a kind of trusted agent [7],
essentially certify ing (to some reasonable degree of
confidence) the validity of the biometric sample that
it generates. The role is somewhat analogous to that of
a Notary in handwritten signature situations. This new
role imposes new requirements on the biometric sam-
ple acquisition system that do not exist in the heavily
supervised biometric acquisition processes associated
with criminology and forensics.
While it is not the intention here to discuss the full
scope of trusted biometric identity verification sys-
tems, the biometric sample acquisition part of that
system inherits certain requirements that can be dis-
cussed in this context. Thus, for biometric samp le
acquisition systems designed to functi on within un-
attended identity verification systems, the added
requirements include resistance to a number of attack
vectors t hat could be used to falsify the biometric
sample that the system delivers.
Trusted Biometric Sample Acquisition
Systems
A trusted biometr ic sample acquisition sy stem inherits
atleast the following requirements:
Resistance to fake biometric target presentation.
This capability is also called ▶ Biometric Spoof
Prevention. It provides an appropriate degree of
protection against attacks like the use of a face
mask to fool a face recognition system, or movie
hero James Bond’s use of molded latex rubber
finger coverings to fool a fingerprint reader.
Resistance to acquisition system tampering .
The requirement here is to prevent an attacker
from accessing the internal operation of the bio-
metric sample acquisition system, where he could
force it to output different information than it is
actually measuring. This requirement may impose
hardened packaging requirements on the biometric
sample acquisition system.
Resistance to device/system substitution.
The system as a whole should be able detect if
an alternate device has been substituted for all or
any portion of the biometric sample acquisition
system. This typically imposes cryptographic
capabilities on the biometric sample acquisition
system.
Resistance to communications attacks (e.g., man-
in-the-middle, and replay).
The acquired biometric sample must be securely
delivered to the subsequent processing stages either
by a physically inaccessible data channel or by
cryptographic methods.
All these requirements are designed to enhance the
trustworthiness of the biometric sample capture
event. When a trusted biometric sample acquisition
system is integrated into an overall trusted biometric
system (e.g., a
▶ sealed local biometric identity verifi-
cation system), unsupervised biometric identity verifi-
cation can be performed with reasonable levels of
confidence, without concern that biometric properties
are intrinsically not secret.
Related Entries
▶ Biometric Applications, Overview
▶ Biometrics, Overview
100
B
Biometric Sample Acquisition

▶ Biometrtic Sensor and Device, Overview
▶ Security and Liveness, Overview
References
1. Fraden, J.: Handbook of Modern Sensors – Physics, Designs, and
Applications, 3rd edn. Springer, Heidelberg (2004)
2. Austerlitz, H.: Data Acquisition techniques using PCs. Aca-
demic, London (2003)
3. Webster, J.G.: The Measurement Instrumentation And Sensors
Handbook. CRC, Boca Raton (1998)
4. Ball, S.: Analog Interfacing to Embedded Microprocessor Sys-
tems, 2nd edn. Newnes, Oxford (2003)
5. Ratha, N., Bolle, R.: Automatic Fingerprint Recognition Sys-
tems. Springer, Heidelberg (2003)
6. Wilson, J.S.: Sensor Technology Handbook. Newnes, Elsevier,
Oxford, UK (2005)
7. Pearson, S.: Trusted Computing Platforms: TCPA Technology in
Context; HP Professional Series. Prentice Hall, New Jersey
(2003)
Biometric Sample Quality
ELHAM TABASSI,PATRICK GROT HE R
National Institute of Standards and Technology,
MD, USA
Synonyms
Biometric quality evaluation; Performance of biomet-
ric quality measures
Definition
The intrinsic characteristic of a biometric signal may
be used to determine its suitability for further proces-
sing by the biometric system or assess its conformance
to preestablished standards. The quality score of a
biometric sample signal is a scalar summary of the
sample’s quality.
Quality measurement algorithm is regarded as a
black box that converts an input sample to an output
scalar. Evaluation is done by quantifying the association
between those values and observed matching results. For
verification, these would be the false match and non-
match rates. For identification, the matching results
would usually be false match and nonmatch rates [1],
but these may be augmented with rank and candidate-
list length criteria. For a quality algorithm to be effec-
tive, an increase in false match and false nonmatch
rates is expected as quality degrades.
Introduction
Biometric quality measurement algorithms are increas-
ingly deployed in operational biometric systems [2, 3],
and there is now international consensus in industry
[4], academia [5], and government [6] that a statement
of a biometric sam ple’s quality should be related to its
recognition performance. That is, a quality measure-
ment algorithm takes a signal or image, x, and pro-
duces a scalar, q ¼ Q(x), which is predictive of error
rates associated with the verification or identification
of that sample. This chapter formalizes this concept
and advances methods to quantify whether a quality
measurement algorithm (QMA) is actually effective.
What is meant by quality? Broadly a sample should
be of good quality if it is suitable for automated
matching. This viewpoint may be distinct from the
human conception of quality. If, for example, an ob-
server sees a fingerprint with clear ridges, low noise,
and good contrast then he might reasonably say it is of
good quality. However, if the image contains few min-
utiae, then a minutiae-based matcher would underper-
form. Likewise, if a human judges a face image to be
sharp, but a face recognition algorithm benefits from
slight blurring of the image then the human statement
of quality is inappropriate. Thus, the term quality is
not used here to refer to the
▶ fidelit y of the sample,
but instead to the
▶ utilit y of the sample to an auto-
mated system. The assertion that performance is ulti-
mately the most relevant goal of a bio metric system
implies that a quality algorithm should be designed to
reflect the sensitivities of the matching algorithm. For
fingerprint minutiae algorithms, this could be the ease
with which minutiae are detected. For face algorithms,
it might include how readily the eyes are located.
Quality evaluation methods should not rely on the
manual annotation of a data set because this is imprac-
tical for all but small datasets, not least because human
examiners will disagree in this respect. The virtue of
relating quality to performance is that matching trials
can be automated and conducted in bulk. The essay
notes further that quality algorithms that relate to
Biometric Sample Quality
B
101
B

human perception of a sample, quantify performance
only as much as the sensitivities of the human visual
system are the same as those of a biometric matcher.
One further point is that performance related qual-
ity evaluation is agnostic on the underlying technolo -
gy: it would be improper to force a fingerprint quality
algorithm to produce low quality values for an image
with few minutia when the target matching algo rithm
is nonminutia based, as is the case for pattern based
methods [7].
Evaluation of quality measurement algorithms
should be preferably done in large scale offline trials,
which offer repeatable, statistically robust means of
evaluating core algorithmic capability.
Prior work on quality evaluation, and of sample
quality analysis generally, is limited. Qu ality measure-
ment naturally lags recognition algorithm develop-
ment, but has emerged as it realized that biometric
systems fail on certain pathological samples. Alonso
et al. [8] reviewed five algorithms and compared the
distributions of the algorithms’ quality assignments,
with the result that most of the algorithms behave
similarly. Finer grained aspects of sample quality can
be addressed. For instance, Lim et al. [9] trained a
fingerprint quality system to predict the accuracy of
minutia detection. However, such methods rely on the
manual annotation of a data set, which as stated above
is impractical.
Properties of a Quality Measure
This section gives needed background material, in clud-
ing terms, definitions, and data elements, to support
quantifying the performance of a quality algorithm.
Throughout this chapter, low quality values are used
to indicate poor sample properties.
Consider a data set D containing two samples, d
i
(1)
and d
i
(2)
collected from each of i ¼ 1, ..., N indivi-
duals. The first sample can be regarded as an enroll-
ment image, the second as a user sample collected later
for verification or identification purposes. Suppose
that a quality algorithm Q can be run on the ith
enrollment sample to produce a quality value
q
ð1Þ
i
¼ Qðd
ð1Þ
i
Þ; ð1Þ
and likewise for the authentication (use-phase) sample
q
ð2Þ
i
¼ Qðd
ð2Þ
i
Þ: ð2Þ
Thus, it has been suggested that these qualities are
scalars, as opposed to vectors for example. Operation-
ally, the requirement for a scalar is not necessary: a
vector could be stored and used by some application.
The fact that qu ality has historically be en conceived
of as scalar is a widely manifested restriction. For
example, BioAPI [10] has a signed single byte value,
BioAPI_QUALITY; and the headers of the ISO/IEC
biometric data interchange format standards [11]
have five-byte fields for quality with only one byte
allocated for quality score. This chapter does not fur-
ther address the issue of vector quality quantities other
than to say that they could be used to specifically direct
re-acquisition atte mpts (e.g., camera settings), and if
considered, their practical use would require applica-
tion of a discriminant function.
The discussion now formalizes the premise that bio-
metric quality measures should predict performance.
A formal statement of such requires an appropriate,
relevant, and tractable definition of performance. Con-
sider K verification algorithms, V
k
, that compare pairs
of samples (or templates derived from them) to pro-
duce match (i.e., genuine) similarity scores
s
ðkÞ
ii
¼ V
k
ðd
ð1Þ
i
; d
ð2Þ
i
Þ; ð3Þ
and similarly non match (impostor) scores
s
ðkÞ
ij
¼ V
k
ðd
ð1Þ
i
; d
ð2Þ
j
Þ i 6¼ j: ð4Þ
Now, to posit that two quality values can be used to
produce an estimate of the genuine similarity score
that matcher k would produce on two samples
s
ðkÞ
ii
¼ Pðq
ð1Þ
i
; q
ð2Þ
i
Þþ E
ðkÞ
ii
; ð5Þ
where the function P is some predictor of a matcher k’s
similarity scores, and E
ii
is the error in doing so for the
ith score. Substituting (1) gives
s
ðkÞ
ii
¼ PðQðd
ð1Þ
i
Þ; Qðd
ð2Þ
i
ÞÞ þ E
ðkÞ
ii
; ð 6Þ
and it becomes clear that together P and Q would be
perfect imitators of the match er V
k
in (3), if it was not
necessary to apply Q to the samples separately. This
separation is usually a necessary condition for a quality
algorithm to be useful because at least half of the time
(i.e., enrollment) only one sample is available. The
obvious consequence of this formulation is that it is
inevitable that quality values will imprecisely map to
similarity scores, i.e., there will be scatter of the known
102
B
Biometric Sample Quality
scores, s
ii
, for the known qualities q
i
(1)
and q
i
(2)
. For
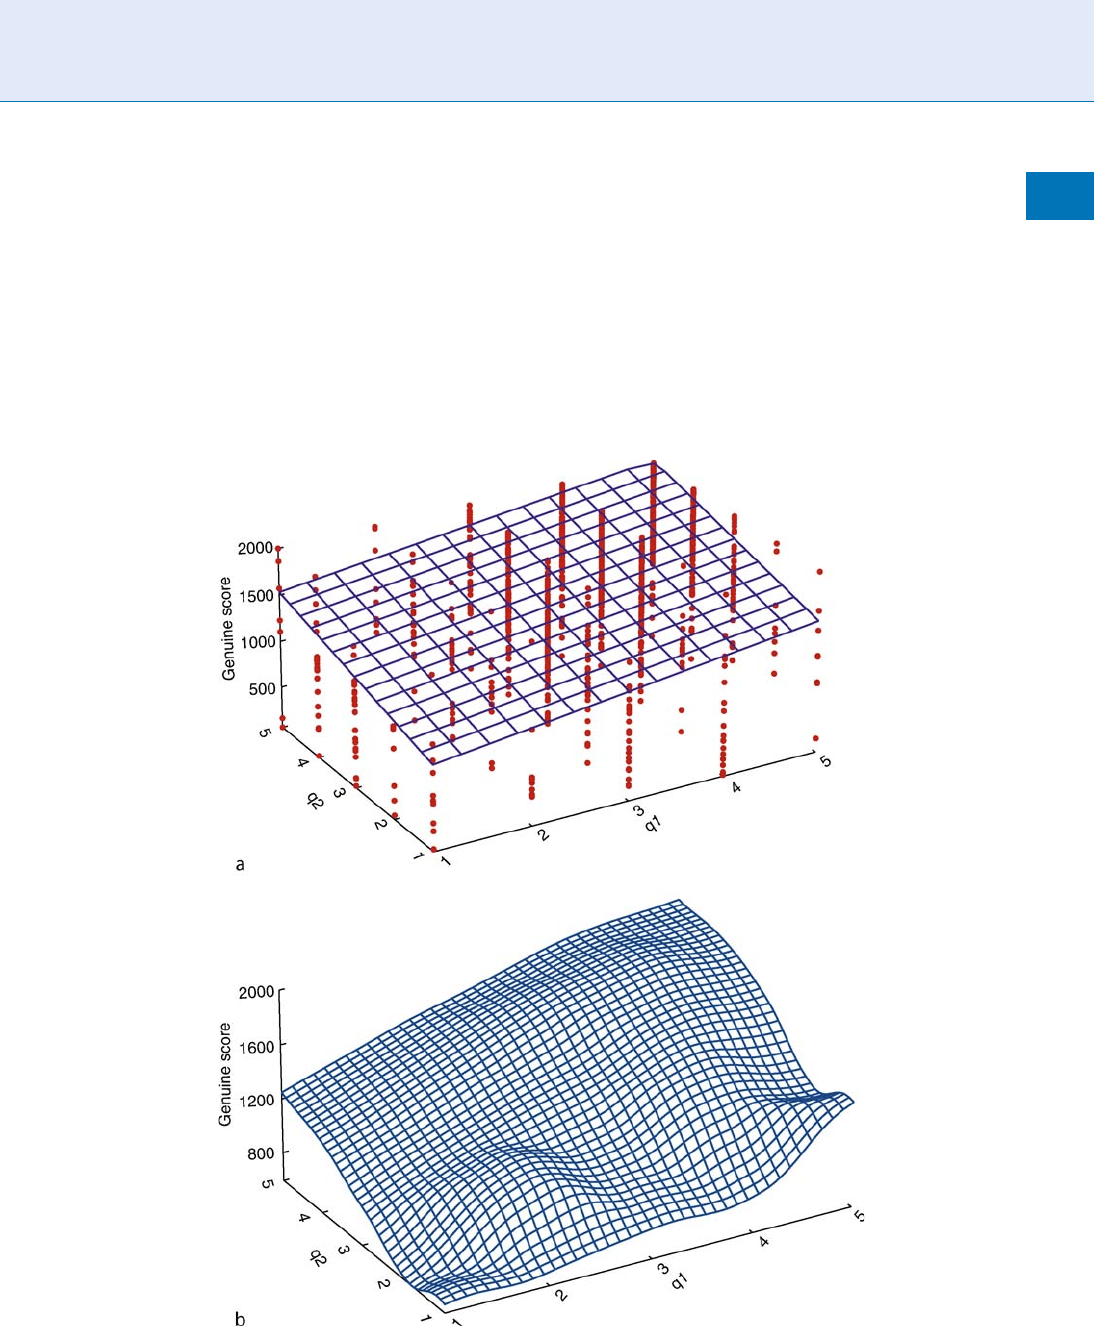
example, Fig. 1 shows the raw similarity scores from a
commercial fingerprint matcher versus the trans-
formed integer quality scores from NIST fingerprint
image quality (NFIQ) algorithm [6, 12], where
NFIQ nat ive scores are mapped to Q ¼ 6NFIQ (so
that higher quality values indicate good ‘‘quality’’).
Figure 1(a) also includes a least sq uares linear fit, and
Fig . 1(b ) show s a cubic spline fit of the same data. Bot h
trend in the correct direction: worse quality gives lower
similarity scores. Even though the residuals in the spline
fit are smaller than those for the linear, they are still not
small. Indeed even with a function of arbitrarily high
order, it will not be possible to fit the observed scores
perfectly if quality values are discrete (as they are for
NFIQ). By including the two fits of the raw data, it is not
asserted that scores should be linearly related to the two
quality values (and certainly not locally cubic). Accord-
ingly, it is concluded that it is unrealistic to require
quality measures to be linear predictors of the similarity
scores; instead, the scores should be a monotonic func-
tion (higher quality samples give higher scores).
Biometric Sample Quality. Figure 1 Dependence of raw genuine scores on the transformed NFIQ qualities of the two
input samples.
Biometric Sample Quality
B
103
B

Evaluation
Quality measurement algorithms are designed to
target application-specific performance variables. For
verification, these would be the false match rate (FMR)
and false nonmatch rate (FNMR). For identification,
the metrics would usually be FNMR and FMR [1], but
these may be augmented with rank and candidate-list
length criteria. Closed-set identification is operation-
ally rare, and is not considered here.
Verification is a positive application, which means
samples are captured overtly from users who are moti-
vated to subm it high quality samples. For this scenario,
the relevant performance metric is the false nonmatch
rate (FNMR) for genuine users because two high qual-
ity samples from the same individual should produce a
high score. For FMR, it should be remembered that false
matches should occur only when samples are biometri-
cally similar (with regard to a matcher) as for example
when identical twins’ faces are matched. So, high quality
images should give very low impostor scores, but low
quality images should also produce low scores. Indeed,
it is an undesirable trait for a matching algorithm to
produce high impostor scores from low quality samples.
In such situations, quality measurement should be used
to preempt submission of a deliberately poor sample.
For identification, FNMR is of primary interest. It
is the fraction of enrollee searches that do not y ield the
matching entry on the candidate list. At a fixed thresh-
old, FNMR is usually considered independent of the
size of the enrolled population because it is simply
dependent on one-to-one genuine scores. However,
because impostor acceptance, as quantified by FMR ,
is a major problem in identification systems, it is
necessary to ascertain wheth er low or high quality
samples tend to cause false matches.
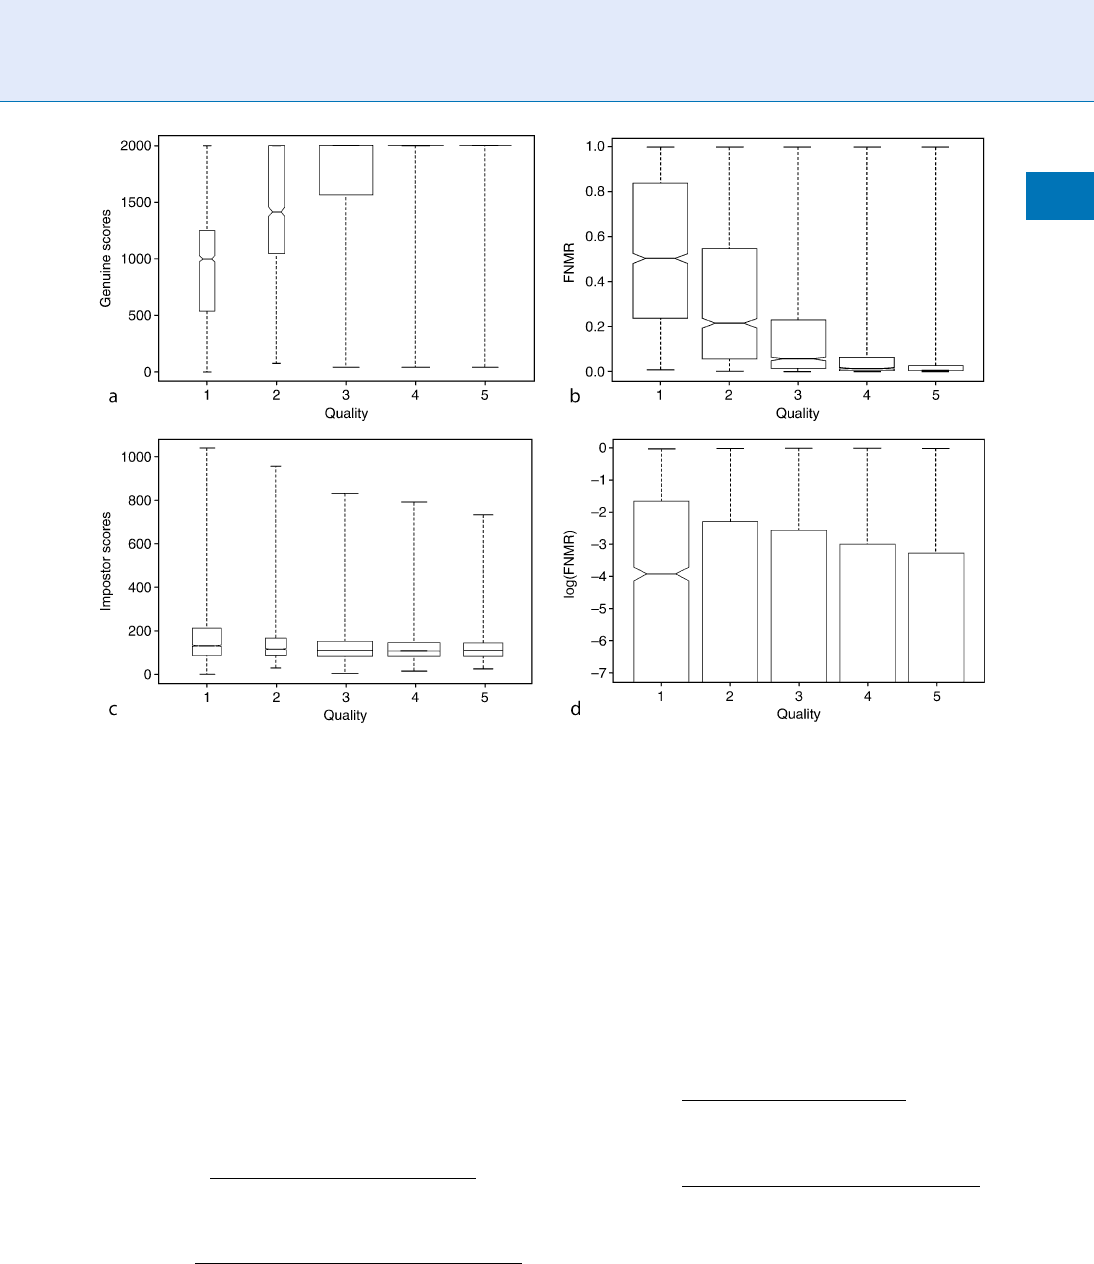
For a quality algorithm to be effective, an increase
in FNMR and FMR is expected as quality degrades.
The plots in Fig. 2 shows the relationship of trans-
formed NFIQ quality levels to FNMR and FMR.
Figure 2(a) and 2(c) are boxplots of the raw genuine
and impostor scores for each of the five NFIQ quality
levels. The scores were obtained by applying a commer-
cial fingerprint matcher to left and right index finger
impressions of 34,800 subjects. Also shown are boxplots
of FNMR and FMR. The result, that the two error rates
decrease as quality improves, is expected and beneficial.
The FMR shows a much smaller decline. The non-
overlap of the notches in plots of Fig. 2(a) and 2(b)
demonstrates ‘‘strong evidence’’ that the medians of the
quality levels differ [13]. If the QMA had more finely
quantized its output, to L > 5 levels, this separation
would eventually disappear. This issue is discussed
further in section ‘‘Measuring Separation of Genuine
and Impostor Distributions’’.
Rank-Ordered Detection Error Tradeoff
Characteristics
A quality algorithm is useful, if it can at least give an
ordered indication of an eventual performance. For
example, for L discrete quality levels there should no-
tionally be L DET characteristics. In the studies
that have evaluated performance measures [1, 5, 12, 14,
15, 16], DET’s are the primary metric. It is recognized
that DET’s are widely understood, even expected, but
note three problems with their use: being parametric in
threshold, t, they do not show the dependence of
FNMR (or FMR) with quality at fixed t, they are used
without a test of the significance of the separation of L
levels; and partitioning of the data for their computa-
tion is under-reported and nonsta ndardized.
This chapter examines three methods for the quality-
ranked DET computation. All three use N paired match-
ing images with integer qualities q
i
(1)
and q
i
(2)
on the
range [1, L]. Associated with these are N genuine
similarity scores, s
ii
, and up to N(N 1) impostor
scores, s
ij
where i 6¼ j, obtained from some matching
algorithm. All three methods compute a DET charac-
teristic for each quality level k. For all thresholds s, the
DET is a plot of FNMR(s)=M(s) versus FMR(s)=1
N(s), where the empirical cumulative distribution func-
tions M(s) and N(s) are computed, respectively, from
sets of genuine and impostor scores. The three methods
of partitioning differ in the contents of these two sets.
Thesimplestcaseusesscoresobtainedbycomparing
authentication and enrollment samples whose qualities
are both k. This procedure (see for example, [17]) is
common but overly simplistic. By plotting
FNMRðs;kÞ¼
s
ii
: s
ii
s; q
ð1Þ
i
¼q
ð2Þ
i
¼k
no
s
ii
: s
ii
< 1; q
ð1Þ
i
¼q
ð2Þ
i
¼k
no
;
FMRðs;kÞ¼
s
ij
: s
ij
> s; q
ð1Þ
i
¼q
ð2Þ
j
¼k; i 6¼j
no
s
ij
: s
ij
> 1; q
ð1Þ
i
¼q
ð2Þ
j
¼k; i 6¼j
no
;
ð7Þ
104
B
Biometric Sample Quality
the DETs for each quality level can be compared. Al-
though a good QMA will exhibit an ordered relation-
ship between quality and error rates, this DET
computation is not operationally representative because
an application cannot usually accept only samples with
one quality value. Rather, the DETmay be computed for
verification of samples of quality k with enrollment
samples of quality greater than or equal to k,
FNMRðs;kÞ¼
s
ii
: s
ii
s; q
ð1Þ
i
k; q
ð2Þ
i
¼k
no
s
ii
: s
ii
< 1; q
ð1Þ
i
k; q
ð2Þ
i
¼k
no
;
FMRðs;kÞ¼
s
ij
: s
ij
> s; q
ð1Þ
i
k; q
ð2Þ
j
¼k; i 6¼j
no
s
ij
: s
ij
> 1; q
ð1Þ
i
k; q
ð2Þ
j
¼k; i 6¼j
no
;
ð8Þ
The situation is modeled in which the enrollment sam-
ples are at least as good as the authentication (i.e., user
submitted) samples. Such a use of quality would lead to
▶ failures to acquire for the low quality levels.
If instead performance across all authentication
samples is compared against enrollment samples of
quality greater than or equal to k,
FNMRðs; kÞ¼
s
ii
: s
ii
s; q
ð1Þ
i
k
no
s
ii
: s
ii
< 1 ; q
ð1Þ
i
k
no
;
FMRðs; kÞ¼
s
ij
: s
ij
> s; q
ð1Þ
i
k; i 6¼ j
no
s
ij
: s
ij
> 1; q
ð1Þ
i
k; i 6¼ j
no
;
ð9Þ
The situation where qual ity control is applied only
during enrollment is modeled. If repeated enrollment
attempts fail to produce a sample with quality above
some threshold, a failure-to-enroll (FTE) would be
declared. This scenario is common and possible
Biometric Sample Quality. Figure 2 Boxplots of genuine scores, FNMR, impostor scores, and FMR for each of five
transformed NFIQ quality levels for scores from a commercial matcher. Each quality bin, q, contains scores from
comparisons of enrollment images with quality q
(1)
q and subsequent use-phase images with q
(2)
¼ q, per the
discussion in section ‘‘Rank-Ordered Detection Error Tradeoff Characteristics’’. The boxplot notch shows the median; the
box shows the interquartile range, and the whiskers show the extreme values. Notches in (d) are not visible because
the medians of FMRs are zero therefore outside the plot range.
Biometric Sample Quality
B
105
B
because enrollment, as an attended activity, tends to
produce samples of bette r quality than authentication.
The considerable differences between these three
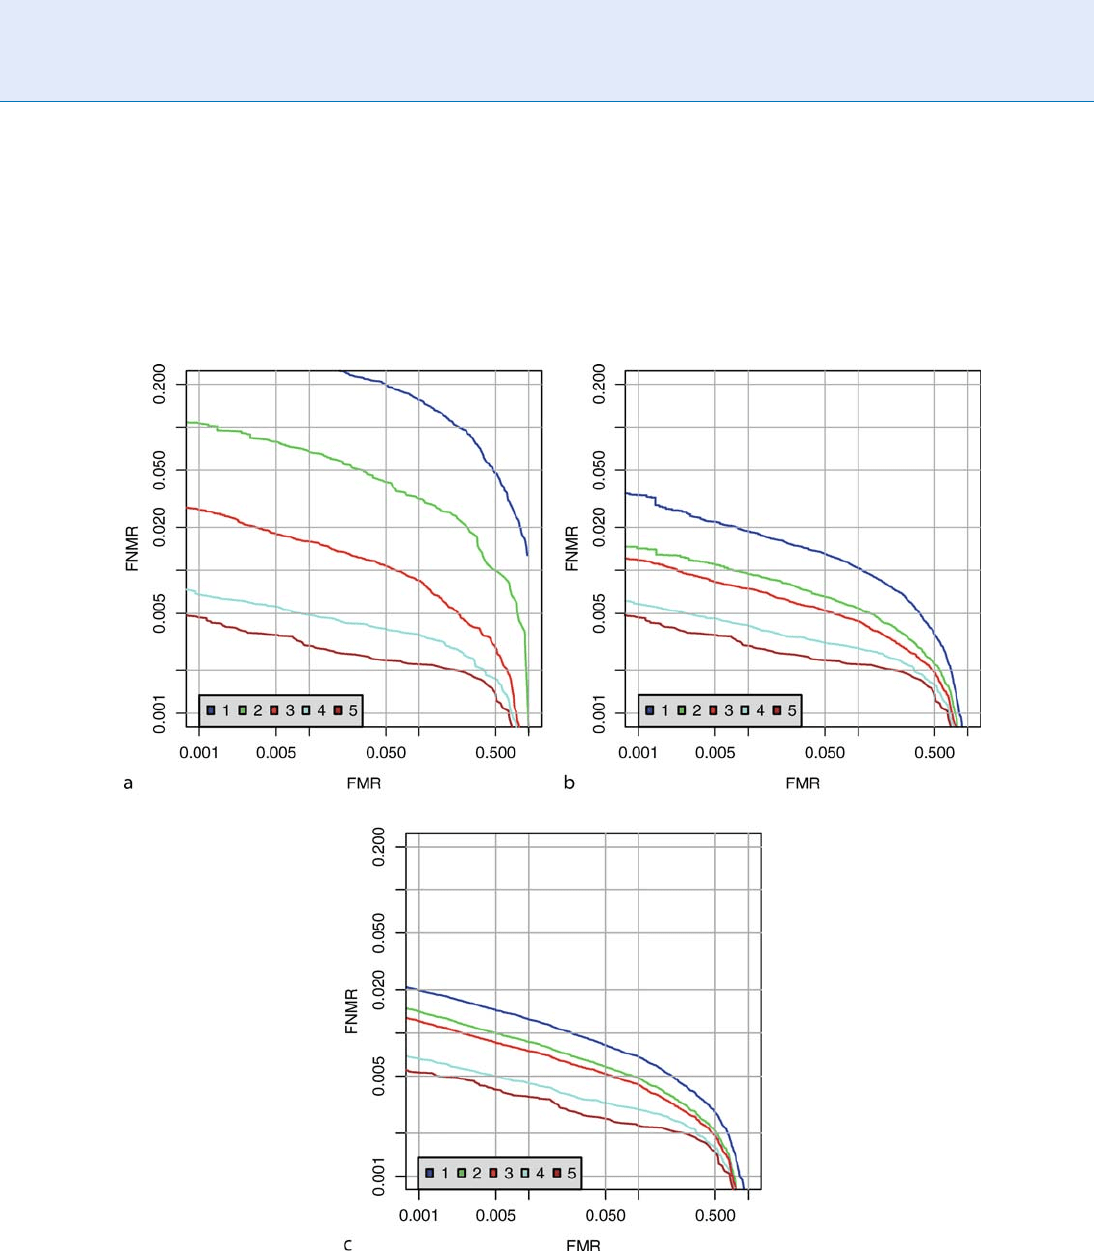
formulations are evident in the DETs of Fig. 3 for
which the NFIQ algorithm [6] for the predicting per-
formance of a commercial fingerprint system was ap-
plied to over 61,993 genuine and 121,997 impostor
comparisons (NFIQ native scores were transformed
to Q ¼ 6 NFIQ). In all cases, the ranked separation
of the DETs is excellent across all operating points. It is
recommended that (8 ), as shown in Fig . 3(b), be used
because it is a more realistic operational model.
However, as relevant as DET curves are to expected
performance, revisited here is a very important
Biometric Sample Quality. Figure 3 Quality ranked detection error tradeoff characteristics. Each plot shows five traces
corresponding to five transformed NFIQ levels. (Note that the DET used here plots FNMR vs. FMR on log scales. It is
unconventional in that it does not transform the data by the CDF of the standard normal distribution. The receiver
operating characteristic plots 1FNMR on a linear scale instead. These characteristics are used ubiquitously to summarize
verification performance).
106
B
Biometric Sample Quality

complication. Because DET characteristics quantify
the separation of the genuine and impostor distribu-
tions and combine the effect of quality on both genu-
ine and impostor performance, the separate effects of
quality on FNMR and FMR is lost sight of.
In any case, it is concluded that DETs, while familiar
and highly relevant, confound genuine and impostor
scores. The alternative is to look at the specific depen-
dence of the error rates on quality at some fixed thresh-
old. Indeed for verification applications, the variation in
FNMR with quality is key because the majority of trans-
actions are genuine attempts. For negative identification
systems (e.g., watchlist applications) in which users are
usually not enrolled, the variation of FMR with quality is
critical. This approach is followed in the next section.
Error Versus Reject Curves
It is proposed to use error versus reject curves as an
alternative means of evaluating QMAs. The goal is to
state how efficiently rejection of low quality samples
results in improved performance. This again models
the operational case in which quality is maintained by
reacquisition after a low quality sample is detected.
Consider that a pair of samples (from the same subject),
with qualities q
i
(1)
and q
i
(2)
, are compared to produce a
score s
ii
(k)
, and this is repeated for N such pairs.
Thresholds u and v are introduced that define levels
of acceptable quality and define the set of low quality
entries as
Rðu; vÞ¼ j : q
ð1Þ
j
< u; q
ð2Þ
j
< v
no
: ð10Þ
The FNMR is the fraction of genuine scores below
threshold computed for those samples not in this set
FNMR ðt; u; vÞ¼
s
jj
: s
jj
t; j 62 Rðu; vÞ
s
jj
: s
jj
< 1
: ð11Þ
The value of t is fixed (Note that any threshold may be
used. Practically it will be set to give some reasonable
false non-match rate, f, by using the quantile function
the empirical cumulative distribution function of the
genuine scores, t ¼ M
1
(1 f ).) and u and v are
varied to show the dependence of FNMR on quality.
For the one-dimensional case, when only one qual-
ity value is used the rejection set is
RðuÞ¼ j : Hðq
ð1Þ
j
; q
ð2Þ
j
Þ < u
no
ð12Þ
where H is a functio n of combining two quality mea-
sures into a single measure. FNMR is false non-match
performance as the proportion of nonexcluded scores
below the threshold.
FNMRðt; uÞ¼
s
jj
: s
jj
t ; j 62 RðuÞ
s
jj
: s
jj
< 1
ð13Þ
If the quality values are perfectly correlated with the
genuine scores, then when t is set to give an overall
FNMR of x and then reject proportion x with the
lowest qualiti es, a recomputation of FNMR should be
zero. Thus, a good quality metric correctly labels those
samples that cause low genuine scores as poor quality.
For a good quality algorithm, FNMR should decrease
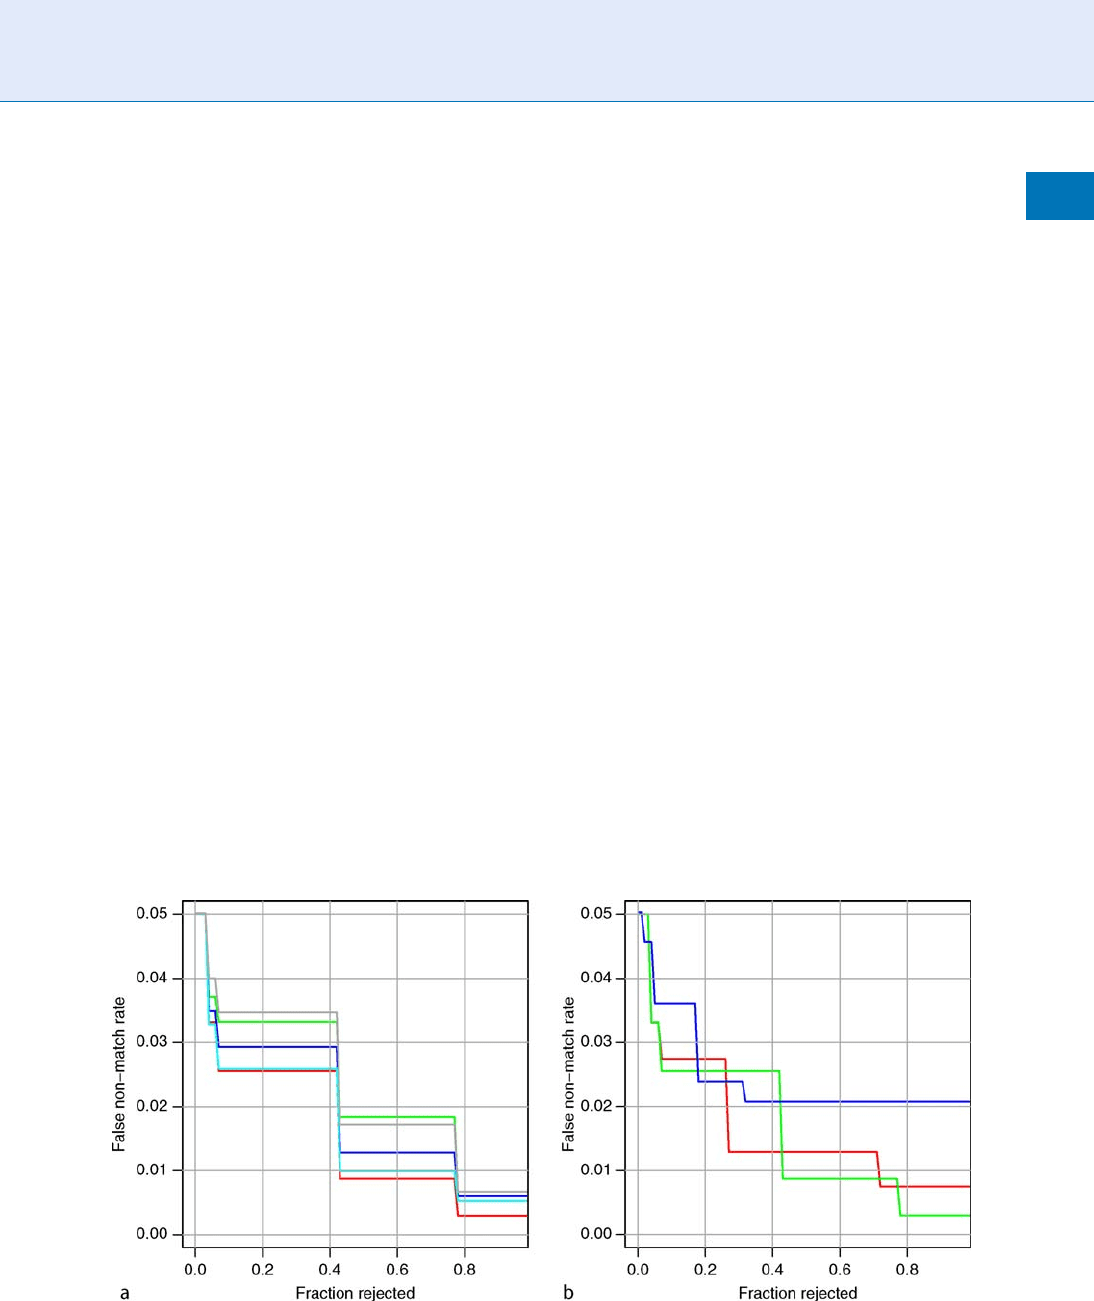
quickly with the fraction rejected. The results of apply-
ing this analysis are shown in Fig. 4. Note that the
curves for each of the three fingerprint quality algo-
rithms trend in the correct direction, but that the even
after rejection of 20% the FNMR value has fallen only
by about a half from its starting point. Rejection of
20% is probably not an operational possibility unless
an immediate reacquisition can yield better quality
values for those persons. Yoshida, using the same ap-
proach, reported similar figures [18]. Note, however,
that for NFIQ, the improvement is achieved after re-
jection of just 5%. In verification applications such as
access control, the prior probability of an imposto r
transaction is low and thus, the overall error rate is
governed by false nonmatchers. In such circumstances,
correct detection of samples likely to be falsely rejected
should drive the design of QMAs.
Figure 5 shows error versus reject behavior for the
NFIQ quality method when the various H(q
1
, q
2
)com-
bination functions are used. Between the minimum,
mean, and geometric mean functions ther e is little dif-
ference. The geometric mean is best (absent a signifi-
cance test) with steps occurring at values correspondin g
to the square roots of the product of NFIQ values. The
gray line in the figure shows H ¼
ffiffiffiffiffiffiffiffiffi
q
1
q
2
p
þ Nð0; 0:01Þ;
where the gaussian noise serves to randomly reject sam-
ples within a quality level and produces an approxima-
tion of the lower conv ex hull of the geometric mean
curve. The green line result, for H ¼jq
1
q
2
j, shows
that transformed genuine comparison score is unrelated
to the difference in the qualities of the samples. Instead,
the conclusion is that FNMR is related to monotonic
functions of the two values. The applicability of this
result to other quality methods is not known.
Biometric Sample Quality
B
107
B
Generalization to Multiple Matchers
It is a common contention that the efficacy of a quality
algorithm is necessarily tied to a particular matcher. It
is observed that this one-matcher case is commonplace
and useful in a limited fashion and should, therefore,
be subject to evaluation. However, it is also observed
that it is possible for a quality algorithm to be capabl e
of generalizing across all (or a class of) matchers, and
this too should be evaluated.
Generality to multiple matchers can be thought of
as an interoperability issue: can supplier A’s qualit y
measure be used with supplier B’s matcher? Such a
capability will exist to the extent that pathological
Biometric Sample Quality. Figure 4 Error versus reject performance for three fingerprint quality methods. (a) and (b)
show reduction in FNMR and FMR at a fixed threshold as up to 20% of the low quality samples are rejected. The similarity
scores come from a commercial matcher.
Biometric Sample Quality. Figure 5 Dependence of the error versus reject characteristic on the quality combination
function H(.). The plots show, for a fixed threshold, the decrease in FNMR as up to 60% of the low quality values are
rejected. The similarity scores come from commercial matchers. The steps in (a) are result of discrete quality metric.
Continuous quality metrics such as in (b), do not usually exhibit such steps.
108
B
Biometric Sample Quality
samples do present problems to both A and B’s match-
ing algorithms. However, the desirable property of
generality exposes another problem: it cannot be
expected to predict performance absolutely because
there are good and bad matching systems. A system
here includes all of the needed image analysis and
comparison tasks. Rath er, it is asserted that a qu ality
algorithm intended to predict performance generally
need only be capable of giving a relative or rank order-
ing, i.e., low quality samples should give lower perfor-
mance than high quality samples.
The plots of Fig. 6 quantify this generalization for
the NFIQ algorithm using the error versus rejec t curves
of section ‘‘Error Versus Re ject Cur ves’’. Fig ure 6(a )
includes five traces, one for each of five verification
algorithms. The vertical spread of the traces indicates
some disparity in how well NFIQ predicts the perfor-
mance of the five matchers. A perfectly general QMA
would produce no spread.
Measuring Separation of Genuine and
Impostor Distributions
Quality algorithms can be evaluated on their ability to
predict how far a genuine score will lie from i ts
impostor distribu tion. This means instead of evaluat-
ing a qualit y algorithm solely based on its FNMR
(i.e., genuine score distribution), the evaluation can
be augmented by including a measure of FMR be-
cause correct identification of an enrolled user
depends both on correctly finding the match and on
rejecting the nonmatches. Note also that a quality
algorithm coul d invoke a matcher to compare the
input sample with some internal background samples
to compute sample mean and standard dev iation.
The plots of Fig. 7 show, respectively, the genuine
and impostor distributions for adjusted NFIQ values,
1, 3, and 5. The overlapping of genuine and impostor
distributions for the poorest NFIQ means higher rec-
ognition errors for that NFIQ level, and vice versa; the
almost complete separation of the two distribution for
the best quality samples indicates lower recognition
error. NFIQ was trained to specifically exhibit this
behavior.
The Kolmogorov–Smirnov is considered statistic.
For better quality samples, a larger KS test statistic
(i.e., higher separation between genuine and impostor
distribution) is expected. Each row of Table 1 shows KS
statistics for one of the three quality algorithms tested.
KS statistics for each quality levels u ¼ 1, ...,5
are computed by first computing the genuine (i.e.,
{s
ii
:(i, i) 2 R(u)}) and impostor (i.e., {s
ij
:(i, j) 2 R
(u), i 6¼ j}) empirical cumulative distributions, where R
(u) ¼ {(i,j): H(q
i
(1)
, q
j
(2)
) ¼ u}. Thereafter, the largest
absolute difference between the genuine and impostor
Biometric Sample Quality. Figure 6 Error versus reject characteristics showing how NFIQ generalizes across (a) five
verification algorithms and ( b ) three operational data sets. The steps in ( a) occur at the same rejection values because the
matchers were run on a common database.
Biometric Sample Quality
B
109
B