Keyfitz N., Caswell H. Applied Mathematical Demography
Подождите немного. Документ загружается.


8.1. Concept of Reproductive Value 185
discounted back a − x years, her debt outstanding at age x is
v(x)=
β
x
e
−r(a−x)
l(a)
l(x)
m(a) da
or, as Fisher (1930) wrote,
v(x)=
1
e
−rx
l(x)
β
x
e
−ra
l(a)m(a) da, (8.1.1)
where v(x) will be called reproductive value at age x. Evidently v(0) = 1,
and, for x>β, v(x)=0.
For his studies in genetics Fisher needed to know the extent to which
persons of given age (say x), on the average contribute to the births of future
generations. This seemingly different question is answered by a function
proportional to v(x); its value can be established at v(x)/κ,where,asin
Section 6.1,
κ =
β
α
ae
−ra
l(a)m(a) da; (8.1.2)
that is, κ is the mean age of childbearing in the stable population. The
basic proposition is that the addition of a girl or woman aged x to the
population at time zero adds an expected v(x)e
rt
/κ baby girls at time
t, always supposing the continuance of the same regime of fertility and
mortality. The simplest derivation of this takes off from the real term of
solution 7.5.2 to the Lotka renewal equation. A self-contained version is
provided in Section 8.9.
8.1.1 Reproductive Value from the Lotka Integral Equation
One Woman Aged x. The continuous model of Section 7.5 provides the
curve of descendants of an arbitrary initial age distribution, and its asymp-
totic trajectory is the real term Q
1
e
r
1
t
of (7.5.2), the value of Q
1
being given
by (7.5.4). For a distribution consisting of one woman aged x, disregarding
questions of continuity and of random variation, we find that the children
expected at time t to t + dt are [l(x + t)/l(x)]m(x + t) dt, which is therefore
the function G(t). Entering it in (7.5.4), that is, in Q
1
=
β
0
e
−rt
G(t) dt/κ,
we have
Q
1
=
β−x
0
e
−rt
[l(x + t)/l(x)]m(x + t) dt
κ
, (8.1.3)
which except for the divisor κ is identical to v(x) of (8.1.1), giving the
discounted value of the expected future births to a woman aged x.Inthe
special case of a baby just born, x = 0; and, by virtue of (8.1.3) and the
characteristic equation (6.1.2), Q
1
=1/κ.

186 8. Reproductive Value from the Life Table
Stable Age Distribution. The same constant Q
1
can be readily evaluated for
a population of unity having the stable age distribution be
−ra
l(a). We can
guess in advance from the nature of stability that the asymptotic population
will be e
rt
and the births be
rt
,soQ
1
must equal b for this case.
The proof seems simplest if we start by calculating the total expected
reproductive value of a stable population:
β
0
be
−rx
l(x)v(x) dx,
then cancel the e
−rx
l(x) with the denominator of v(x) of (8.1.1) to find
b
β
0
β
x
e
−ra
l(a)m(a) da dx,
and finally integrate by parts to obtain
b
β
0
ae
−ra
l(a)m(a) da = bκ
as the reproductive value of a population of unity having a stable age
distribution. The constant Q
1
is this total reproductive value divided by κ,
that is, bκ/κ = b, as suggested by intuition.
Arbitrary Age Distribution. A more general statement can be made. Let
p(x) be the age distribution as a density function; i.e., so that the number of
individuals between ages a and a +5,say,is
5
N
a
=
a+5
a
p(x)dx. Whatever
the initial age distribution p(x) of a closed population acted on by fixed
rates of birth and death, its births have an asymptotic trajectory Q
1
e
r
1
t
where Q
1
, defined by (7.5.4), is equal to
β
0
p(x)v(x) dx/κ, that is, the
sum of reproductive value in the population divided by the mean age of
childbearing.
To see this, note that the total reproductive value of p(x)is
V =
β
0
p(x)v(x) dx =
β
0
p(x)
β−x
0
e
−rt
l(x + t)
l(x)
m(x + t) dt dx. (8.1.4)
But this is the same as the numerator of Q
1
in (7.5.4), where G(t)isthe
number of children expected to be generated by the initial population p(x).
For the number of those children born at time t will be
G(t)=
β
0
p(x)
l(x + t)
l(x)
m(x + t) dx, (8.1.5)
and multiplying by e
−rt
and then integrating over t gives the double integral
in (8.1.4). This demonstrates that Q
1
= V/κ,whereV is the number of
women, each weighted by the v(x) for her age x. Once again, 1/κ of the
present value of the balance outstanding by age x in the hypothetical loan
is equal to the contribution of a woman aged x to the ultimate trajectory,

8.1. Concept of Reproductive Value 187
and both the loan and the trajectory are additive for a group of women of
arbitrary ages.
The foregoing proof depends on the solution of the integral equation.
The proof in Section 8.9, on the other hand, stands on its own feet. The
same result can be derived using matrix formulations, without assuming
age-classification (Chapter 9).
Once we know the effect on the birth trajectory of adding one girl and
assume a fixed birth rate b, we can obtain the effect on the population
trajectory by dividing by b.Thisis obvious, for since the birth rate b is
B/N, births divided by population, the population must be N = B/b,
births divided by the birth rate. Hence the effect of adding a girl or woman
aged x is to add v(x)e
rt
/κ to ultimate births and v(x)e
rt
/κb to ultimate
population.
To obtain some intuitive feeling for the reason why the effect of one child
just born on the ultimate birth trajectory is to raise it by v
0
e
rt
/κ = e
rt
/κ,
rather than just e
rt
or some other value, suppose that all children are
born at the same maternal age and that this age is κ. Then the birth of
an additional girl child now will result in R
0
girl children in κ years, R
2
0
childrenin2κ years, and R
n
0
in the nth generation, where R
0
is, as before,
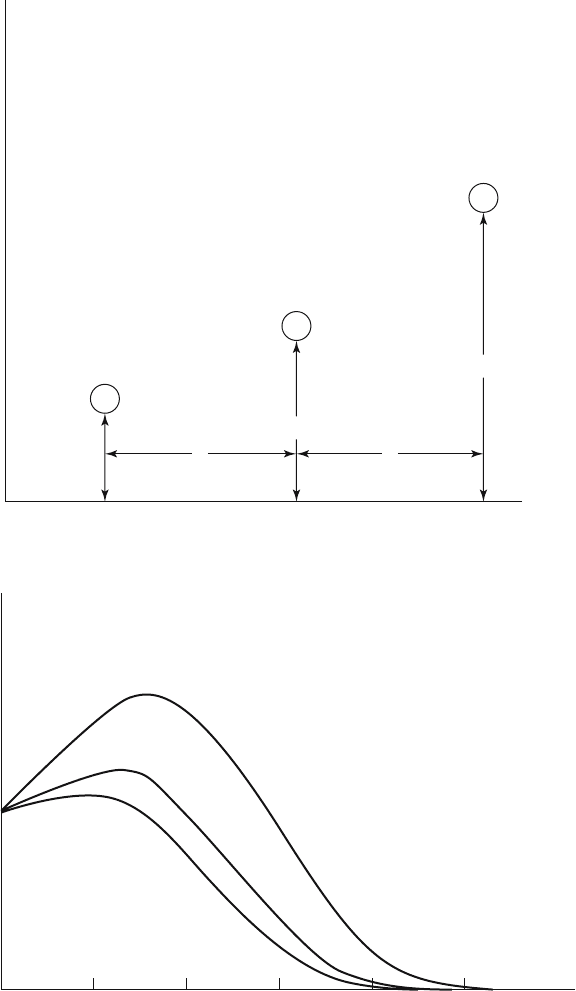
the net reproduction rate; that is to say, a child born now outlines a birth
curve (Fig. 8.1) rising in the ratio of R
0
every κ years, but with births
occurring only at κ-year intervals. In other words, the curve outlined gives
the number of births per κ years resulting from one birth at the outset; it
is reduced to births per year by dividing by κ : e
rt
/κ. This argument is at
best heuristic; the result applies much more generally than to the primitive
model in which all births occur at the same maternal age.
8.1.2 Numerical Calculation
The expression for v(x) in (8.1.1) applies to exact age x, and an approxi-
mation analogous to that customarily made for the stable age distribution
is
v
x
≈
e
−2
1
2
r
5
L
x
F
x
+ e
−7
1
2
r
5
L
x+5
F
x+5
+ ···
l
x
. (8.1.6)
This, with numerator and denominator multiplied by e
−rx
,isshownin
Table 8.1 for Mauritius females, 1966. Figure 8.2 shows the curves of v(x)
for Mauritius, the United States, and Hungary, taken from Keyfitz and
Flieger (1971, pp. 315, 361, and 443).
For the average reproductive value for the age interval x to x +4 at last
birthday the recurrence formula
5
V
x
=
5
2
F
x
+
e
−5r
5
L
x+5
5
L
x
(
5
2
F
x+5
+
5
V
x+5
) (8.1.7)
188 8. Reproductive Value from the Life Table
Births
Time (years)
1
R
0
R
0
2
Figure 8.1. Effect of one birth if all children are born at age κ of mother.
v (x)
Age
1
01020304050
Mauritius, 1966
U.S., 1967
Hungary, 1967
Figure 8.2. Curves of reproductive value for females of three countries.

8.1. Concept of Reproductive Value 189
Table 8.1. Calculation of reproductive values for females of exact ages 0, 5, 10,...,
50, Mauritius, 1966; r =0.0305371
Age
5
L
x
F
x
e
−(x+2
1
2
)r
β−5
y=x
e
−(y+2
1
2
)r
5
L
y
F
y
e
−rx
l
x
v
x
x (1) (2) (3) (4) (5) = (3)/(4)
0 0.92650 1 1 1
5 0.79531 1 0.78463 1.2745
10 0.0014 0.68269 1 0.66822 1.4965
15 0.1858 0.58602 0.99907 0.57152 1.7481
20 0.6236 0.50304 0.89019 0.48700 1.8279
25 0.6061 0.43181 0.57649 0.41212 1.3988
30 0.4730 0.37067 0.31477 0.34841 0.9034
35 0.3239 0.31818 0.13944 0.29392 0.4744
40 0.1201 0.27312 0.03639 0.24719 0.1472
45 0.0146 0.23445 0.00358 0.20816 0.0172
50 0.0008 0.20125 0.00016 0.17341 0.0009
Source: Net maternity function from Keyfitz and Flieger (1971, p. 315).
Table 8.2. Values of
5
V
x
, the Fisher reproductive value of females aged x to x +4
at last birthday, and
5
V
x
/(bκ), the coefficient of the amount by which population
at time t is raised by one added person aged x to x + 4 at time zero, Mauritius,
1966
Age
5
V
x
5
V
x
/(bκ)
0–4 1.159 1.092
5–9 1.381 1.301
10–14 1.618 1.524
15–19 1.783 1.679
20–24 1.611 1.517
25–29 1.151 1.084
30–34 0.690 0.650
35–39 0.312 0.294
40–44 0.083 0.078
45–49 0.009 0.008
v
0
=1
v
0
/(bκ)=
1
(0.03889)(27.30)
=0.942
Source: Keyfitz and Flieger (1971), p. 315.
provides a reasonable approximation. However, the
5
V
x
of Table 8.2 was
calculated, not in this way, but by the method (easier if a computer is avail-
able) of finding the left eigenvector of the projection matrix in Sections 7.1
and 7.5; see Section 9.1 for the connection between reproductive value and
eigenvectors.
Evidently total reproductive value of a population of arbitrary age dis-
tribution acted on by a fixed regime increases at rate r in the short as
190 8. Reproductive Value from the Life Table
well as the long run. Such a statement is conspicuously not true for the
size of the total population, whose increase in the short run depends on
its age distribution. Both births and population acted on by a fixed regime
ultimately go into an exponential trajectory with parameter r; the total of
reproductive values immediately follows an exponential trajectory (Fisher
1930, p. 30).
The above like other pieces of theory in this book can be justified only
by its ability to answer demographic questions. The following section deals
withthefirstofaseriesofsuchquestions.
8.2 Ultimate Effect of Small Out-Migration
Occurring in a Given Year
When people leave a crowded island like Barbados or Java, they make life
somewhat easier for those who remain behind, assuming that the rates of
mortality and fertility do not change as a result of their departure.
The age at which they leave determines the effect. Departures of persons
who are already past the ages of reproduction cannot influence the ultimate
population trajectory; the effect of their leaving is only the subtraction of
the person-years they themselves will live from the time of departure to
death.
A one-time departure of a person of reproductive age or below will lower
the expected population trajectory, but cannot change its rate of climb
as long as the age-specific rates of birth and death remain unchanged.
In symbols, if the ultimate trajectory is Qe
rt
, a one-time departure of an
individual or a group under age β can lower Q but will not alter r. It follows
from the theory of Section 8.1 that a female of age x leaving reduces the
female births at time t by v(x)e
rt
/κ and the female population at time t
by v(x)e
rt
/(bκ), where we take t to be large. Thus the change in Q for
population due to the departure of one female aged x is ∆Q = −v(x)/(bκ).
We are still on the one-sex model and suppose female dominance, that
is, that births are determined by the number of females at the several ages
and not by the number of males. This would be true if males were in the
majority or polygyny prevailed or artificial insemination were applied. The
extension of the ideas of the present chapter to a genuine two-sex model
depends on behavioral variables not readily incorporable in demographic
theory.
The effect of a one-time bulge in births follows readily. With ∆B extra
births in a given year the birth trajectory would be raised e
rt
∆B/κ,and
the population trajectory would be raised this amount divided by the birth
rate b.
Does a female of random age affect the ultimate population more or less
than a girl baby? The former, entering at time zero, raises the population

8.3. Effect of Continuing Birth Control and Sterilization 191
at time t an expected e
rt
, while the latter raises it by e
rt
/(bκ). The mean
age of childbearing κ is never very far from 27, and the reciprocal of 27 is
0.037. For low-fertility populations b is considerably less than 1/κ ≈ 0.037;
hence a baby has more effect than a female between zero and ω randomly
chosen from the stable age distribution. For high-fertility populations, on
the other hand, b is greater than 1/κ and a baby has less expected effect
than a randomly selected female. Thus for Mexico the departure of a woman
of random age has more effect than averting one birth; for the United States
averting a birth has more effect.
The same technique can be used to find a variety of equivalents. By
what amount, for example, would births have to drop in a particular year
to offset an immigration of 1000 women aged 15 to 19 in the same year?
The population at distant time t resulting from 1000 women aged 15 to 19
is 1000
5
V
15
e
rt
/(bκ). The population from B births at time t is Bv
0
e
rt
/(bκ).
Equating these two expressions, we obtain
B =
1000
5
V
15
v
0
as the required equivalent number of births. From the Mauritius informa-
tion in Table 8.2 we have, since
5
V
x
is normed to v
0
=1,
B = 1000
5
V
15
= 1783.
In any one year (or other period) a drop of 1783 female births would be
required to offset the immigration of 1000 women aged 15 to 19 at last
birthday.
8.3 Effect of Continuing Birth Control
and Sterilization
Suppose that a few women each year resort to birth control when they
are of age a, and this occurs year after year, so that the birth rate m(a)is
permanently lowered for age a, but all other age-specific birth rates remain
unaltered. If the change in the age-specific birth rate in the single year of age
a is ∆m(a), a quantity that will carry a minus sign for decrease in m(a), the
change in the intrinsic rate of the population is determined by finding the
derivative dr/dm(a) in the characteristic equation
β
α
e
−rx
l(x)m(x) dx =1
as in Section 6.3, and for finite increments ∆r and ∆m(a) is approximately
∆r ≈−
e
−ra
l(a)∆m(a)
κ
, (8.3.1)
the same as (6.3.8). The result depends on ∆m(a) being small enough so
that e
−ra
,aswellasκ, is substantially unaffected. Subject to this same
condition, we can find the combined effect of small increments at two dif-
ferent ages, say a and a + 1. The effect on r will be approximately the sum

192 8. Reproductive Value from the Life Table
of the ∆r for ∆m(a) and that for ∆m(a + 1), and similarly for any other
groups of ages. This type of perturbation analysis of the rate of increase is
expanded on in Chapter 13.
Now suppose a permanent change in m(a) for all a from age x onward,
so that the new birth function is m(a), a<x,and(1− f)m(a), a x,
f being a small positive or negative fraction. This could be the result of
sterilization becoming the custom at age x, or of the fraction f of women
at age x turning to conventional birth control in order to avoid all further
children. If f is small we can enter −fm(a) for ∆m(a) in the preceding
display, and find the total effect ∆r by adding the ∆r’s for the several
ages:
∆r = −
f
β
x
e
−ra
l(a)m(a) da
κ
. (8.3.2)
The integral here will be recognized as the same one that turned up in v(x)
of (8.1.1). Entering v(x) makes this
∆r = −
fe
−rx
l(x)v(x)
κ
.
In words, the decrease by the fraction f of fertility rates for all ages above
x lowers the intrinsic rate by v(x) multiplied by fe
−rx
l(x)/κ. Remembering
that be
−rx
l(x) is the fraction of the population at age x, where at this point
it is convenient to make x integral and have it represent exact ages x −
1
2
to x +
1
2
, we can say that the decrease in r is f/(bκ) times the fraction of
the population aged x, times the reproductive value at age x.Moresimply,
the integral in (8.3.2) is the fraction of current mothers aged x and over, so
(8.3.2) tells us that the effect on r is equal to the fraction f dropping out of
childbearing, times the fraction of babies born to women aged x and over,
divided by the mean age of childbearing. Designating by b
x
the fraction of
births occurring to mothers aged x and over, (8.3.2) can be written
∆r = −
fb
x
κ
.
Conventional birth control, sterilization, or mortality, if they take place
year after year can lower births to women over age x by a small fraction f,
and if they do the rate of increase r is reduced by f times the fraction b
x
of children born to women aged x and older, divided by the mean age of
childbearing.
The preceding discussion also covers the consequences of a fall in the
death rate. Suppose that the rate at ages x −
1
2
to x +
1
2
goes from µ(x)to
µ(x)+∆µ(x) and remains at that level, or (what is practically the same)
that ∆µ(x)/δ is permanently added to the density µ(x) over a narrow
age interval δ. Then all the results of this section apply. The derivation
first finds the effect of ∆µ(x)/δ on l(x), using the approximate formula

8.4. Large Change in Regime 193
e
−∆µ(x)/δ
≈ 1 − ∆µ(x)/δ. Thereafter the derivation is the same as for
(8.3.1), since l(a)andm(a) enter symmetrically into the characteristic
equation.
8.4 Large Change in Regime
So far only small changes have been discussed. We now ask the same ques-
tion in reference to an arbitrary, possibly large, change: if birth control is
applied by women aged x andabove,whatfractionofbirthsmustthey
avoid in order to change the rate of increase from r to r +∆r?
Suppose that in every cohort women aged x and higher apply birth con-
trol to the point where they reduce their age-specific rates by the fraction
f of what they were before; sterilization of f of the women reaching age x
would have this effect. The original intrinsic rate of increase was found by
solving for r in the characteristic equation. The equation for the new rate
of increase r +∆r breaks down into two parts:
β
α
exp
− (r +∆r)a
l(a)m(a) da
−f
β
x
exp
− (r +∆r)a
l(a)m(a) da =1, (8.4.1)
wherewesupposea x β. Equation 8.4.1 could be solved for x if f and
r +∆r were given, or for r +∆r if x and f were given. A simple explicit
solution is available for f, the fraction of decrease above the given age x
that will suffice to change the intrinsic rate from r to r +∆r:
f =
β
α
exp
− (r +∆r)a
l(a)m(a) da − 1
β
x
exp
− (r +∆r)a
l(a)m(a) da
. (8.4.2)
Result 8.4.2 depends in no way on ∆r being small. [Find its limiting value
when ∆r is small.]
The numerator of (8.4.2) is bound to be positive for ∆r<0, correspond-
ing to the birth control formulation in which f is defined as positive and
birth rates go from m(a)to(1− f)m(a). In the special case where the
desired r +∆r = 0 we would have the simpler form
f =
β
α
l(a)m(a) da − 1
β
x
l(a)m(a) da
=
R
0
− 1
β
x
l(a)m(a) da
. (8.4.3)
The f of (8.4.3) is the fraction by which women aged x and over must
reduce fertility to bring the rate of population increase r down to zero. The

194 8. Reproductive Value from the Life Table
age x is arbitrary but is required to stay within certain limits if 0 <f<1.
For data for Colombia, 1965, one observes that no reduction of fertility
in women 30 and over could bring stationarity if ages under 30 retained
existing rates, for we have R
0
=2.267 and
50
30
l(a)m(a) da =1.001, and
hence a drop to R
0
= 1 would not occur even if all fertility above age 30
disappeared.
∗
One would have thought that a girl child would contribute the same
amount to the ultimate trajectory irrespective of the age of her mother; all
babies start at age zero, after all. The expression ∆r = e
−ra
l(a)∆m(a)/κ
in (8.3.1) is consistent with this view, for it says that the effect of a small
change ∆m(a) in the age-specific birth rate is proportional to e
−ra
l(a),
that is, proportional to the number of women of that age in the stable
population; this has to be right, in that a given change in the birth rate
will alter the number of babies in proportion to the number of women to
whom the change is applied. The expression for ∆r in (8.3.1) supposes that
∆m(a) is small enough not to affect κ, the mean age of childbearing.
But for the ultimate effect of a large change that takes place generation
after generation, it does make a difference whether women are young or
old when they have their children. Avoiding births at age 40 is not as
effective as avoiding them at age 20, because of the more rapid turnover of
a population in which births occur to younger mothers. This is taken into
account in (8.4.2) and (8.4.3).
8.5 Emigration as a Policy Applied
Year After Year
Each year some inhabitants of Java go to Sumatra under an official trans-
migration program that has been government policy for two-thirds of a
century. The authorities have always recognized that the amount of re-
lief provided to Java depends on the age of the migrants at the time of
their out-migration, and that young couples are the ideal ones to go, but
they have tended to exaggerate the effect. Widjojo (1970) shows realis-
tic population projections under alternative assumptions about the rate of
movement, from which the consequences of different policies can be seen.
∗
The net reproductive rate has come to play a central role in modelling epidemic dis-
eases, treated as a problem in pathogen demography. In this context, R
0
is the expected
number of secondary cases caused by a single infected individual over its entire infectious
period. Whether R
0
is greater or less than 1, when the population consists entirely of
susceptible hosts, determines whether the disease will spread or die out. Calculations
essentially identical to those used here to determine the amount by which fertility must
be reduced in order to stop population growth are used to calculate the level of vaccina-
tion that must be imposed to stop the spread of a disease. See Diekmann et al. (1990),
Anderson and May (1991), and Diekmann and Heesterbeek (2000).