Jacques J., Raimondo M. Semi-markov risk models for finance, insurance and reliability
Подождите немного. Документ загружается.

178 Chapter 5
1.03 0.5
0.53
1.5 0.5
q
−
==
−
(2.12)
and so we get the option value
[]
1
(80,0) 40 (1 ) 0 20.5825.
1.03
fin
Cqq=×+−×= (2.13)
2.2 Multi-Period Model
2.2.1 Case Of Two Periods
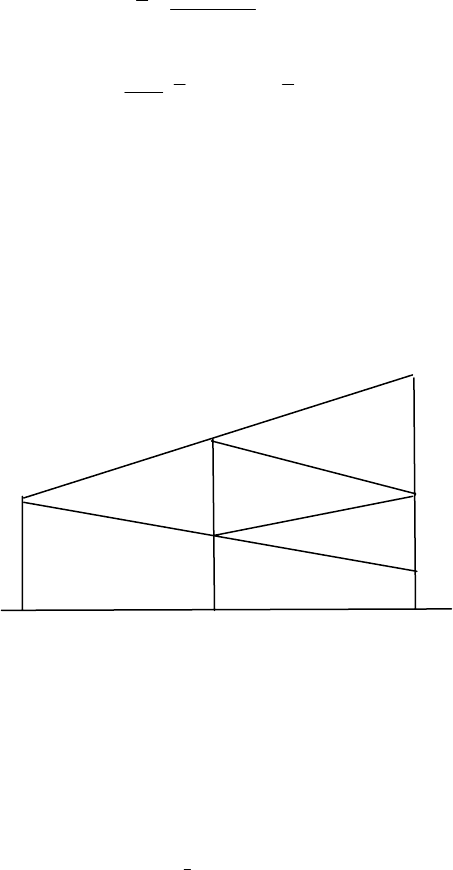
The two following figures show how the model with two periods works.
Here we have to evaluate not only the value of the call at the origin but also at the
intermediary time t=1.
0
1
2
S
uS
uuS
dS
udS
ddS
Figure 2.2: two-period model: scenarios for the underlying asset
Using the notation ( , ), 0,1, 2CSt t
=
in which the second variable represents the
time, here 0, 1 or 2, the first one is the value of the underlying asset at this
considered time.
Here too, as in the case of only one period, the call values will be assessed with
the risk neutral measure as the present values at time t of the “gains” at maturity
t=2 i.e.:
(
)
(,2).
q
ECS (2.14)

Black & Scholes extensions 179
0
1
2
C
Cu
Cuu
Cd
Cud
Cdd
Figure.2.3: two-period model: values of the call
For example we get for t = 0:
{
}
{}
{}
22
0
0
2
22
00
max 0, 2 (1 )
1
(,0) .
(1 )
max 0, (1- ) max 0,
quSKqq
CS
i
udS K q d S K
⎡⎤
−+ −
⎢⎥
=
+
⎢⎥
⋅−+ −
⎣⎦
(2.15)
Remark 2.1 Using a backward reasoning from t=2 to t=1 and from t=1 to t=0, it
is also possible to get this last result since in fact:
[]
2
000
2
000
000
1
(,1) ( ,2)(1)( ,2),
1
1
(,1) ( ,2)(1)( ,2),
1
1
(,0) ( ,1)(1 )( ,1).
1
CuS qC uS qCudS
i
CdS qCudS qCdS
i
C S qC uS q C dS
i
⎡
⎤
=+−
⎣
⎦
+
⎡
⎤
=+−
⎣
⎦
+
=+−
+
(2.16)
Substituting the first two values in the last equality given just above, we get back
to relation (2.15).
2.2.2 Case Of n Periods
If
0
(,)
jnj
ud
CSn
−
represents the call value at t=n if the underlying asset has had j up
movements and nj− down movements and with an initial value of the
underlying asset of (0)S , that is:
{
}
00
( , ) max 0, , 0,1,..., ,
jnj
jnj
ud
CSn udSKj n
−
−
=−=
(2.17)
a straightforward extension of the case of two periods gives the following result:
0
0
1
(,0) (1 ) ()
(1 )
jnj
n
jnj
n
ud
j
n
CS q q C n
j
i
−
−
=
⎛⎞
=−
⎜⎟
+
⎝⎠
∑
(2.18)

180 Chapter 5
and similar results for intermediary time values.
From the computational point of view, Cox and Rubinstein introduced the
minimum number of up movements a so that the call will be “in the money”, that
will mean that the holder has the advantage to exercise his option; clearly, this
integer is given by:
{
}
0
min : .
jnj
ajNudSK
−
=∈ >
(2.19)
Of course, if a is strictly larger than n, the call will always finish “out of the
money” so that the call value at t=n is null.
From relation (2.19), we get:
1
0
0
1
log
1,
log
n
jnj
KS d
ud S K a
ud
−−
−
−
⎢⎥
=
⇔= +
⎢⎥
⎣⎦
(2.20)
x
⎢⎥
⎣⎦
representing the larger integer smaller than or equal to the real x.
From Chapter 1, section 5.1, we know that if X is a r.v. having a binomial
distribution with parameters (n,q), we have:
()
1(1)((,;)).
n
jnj
ja
n
PX a q q Bnqa
j
−
=
⎛⎞
>− = − =
⎜⎟
⎝⎠
∑
(2.21)
As we have (see Cox, Rubinstein (1985), p.178):
1
1,
i
q
u
+
<
<
(2.22)
it follows that the quantity
'q defined below is such that 0'1q
<
< and so the call
value can be written in the form:
00
(,0) (,';) (,;),
(1 )
1
,' .
1
fin
n
K
C S SBnq a Bnqa
i
id u
qqq
ud i
=−
+
+−
==
−+
(2.23)
In conclusion, the binomial distribution is sufficient to compute the call values.
2.2.3 Numerical Example
Coming back to the preceding example for which
0
80, 80, 1.5, 0.5, 3%,SKudi===== (2.24)
and
0.53q = but now for n=2, we get:
1.5
' 0.6 0.7718
1.03
q =×= (2.25)
and consequently
(80,0) 26.4775.C
=
(2.26)

Black & Scholes extensions 181
3 THE BLACK-SCHOLES FORMULA AS LIMIT OF
THE BINOMIAL MODEL
3.1 The Log-Normality Of The Underlying Asset
Since nowadays financial markets operate in continuous time, we will study the
asymptotic behaviour of the CRR formula (2.23) to obtain the value of a call at
time 0 and of maturity T.
To begin with, we will work with a discrete time scale on [0,T] with a unit time
period h defined by n=T/h or more precisely /nTh=
⎢
⎥
⎣
⎦
.
Moreover, if i represents the annual interest rate, the rate for a period of length h
called
ˆ
i is defined by the relation:
ˆ
(1 ) (1 )
nT
ii
+
=+
, (3.1)
so that
ˆ
(1 ) 1.
T
n
ii
=
+−
(3.2)
If
n
J
represents the r.v. giving the number of ascending movements of the
underlying asset, we know that:
(,)
n
J
Bnq≺ (3.3)
and so, starting from
0
,S the value of the underlying asset at the end of period n
is given by
,,
0
() .
nn
JnJ
Sn u d S
−
= (3.4)
It follows that
0
()
log log log .
n
Sn u
J
nd
Sd
=+ (3.5)
The results of the binomial distribution (see Chapter 1, section 5.1) imply that
0
2
0
2
2
2
()
ˆ
log ,
()
ˆ
var log ,
ˆˆ
log ,
ˆ
(1 ) log .
Sn
En
S
Sn
n
S
qd
u
qq
d
μ
σ
μσ
σ
⎛⎞
=
⎜⎟
⎝⎠
⎛⎞
=
⎜⎟
⎝⎠
=+
⎛⎞
=−
⎜⎟
⎝⎠
(3.6)
To obtain a limit behaviour, for every fixed n, we must introduce a dependence
of u, d and q with respect to /nTh=
⎢
⎥
⎣
⎦
so that
182 Chapter 5
22
ˆ
lim ( ) ,
ˆ
lim ( ) ,
n
n
nn T
nn T
μα
σσ
→∞
→∞
=
=
(3.7)
,
α
σ
being constant values as parameters of the limit model. As an example, Cox
and Rubinstein (1985) select the values
/
1
,( ),
11
/.
22
T
Tn
n
ue d e
u
qTn
σ
σ
α
σ
−
===
=+
(3.8)
This choice leads to the values:
222
ˆ
() ,
ˆ
() .
nn T
T
nn T
n
μ
α
σσα
=
⎛⎞
=−
⎜⎟
⎝⎠
(3.9)
Using a version of the central limit theorem for independent but non-identically
distributed r.v., the authors show that
0
()/Sn S
converges in law to a log-normal
distribution for n →∞
.
More precisely, we have:
0
()
ˆ
log ( )
(),
ˆ
Sn
nn
S
Pxx
n
μ
σ
⎛⎞
−
⎜⎟
⎜⎟
≤→Φ
⎜⎟
⎜⎟
⎝⎠
(3.10)
Φ being as defined in Chapter 1, section 5.3, the distribution function of the
reduced normal distribution provided that the following condition is satisfied:
33
3
ˆˆ
log (1 ) log
0.
ˆ
n
qu q u
n
μμ
σ
→∞
−+− −
⎯
⎯⎯→
(3.11)
This condition is equivalent to
22
(1 )
0
(1 )
qq
nq q
−+
→
−
(3.12)
which is true from assumption (3.8).
This result and the definition given in Chapter 1, section 5.4, give the next
proposition:
Proposition 3.1(Cox and Rubinstein (1985))
Under the assumptions (3.8), the limit law of the underlying asset is a lognormal
law with parameters
2
(, )TT
ασ
or
0
()
log
()().
ST
T
S
Pxx
T
α
σ
−
≤=Φ
(3.13)
Black & Scholes extensions 183
In particular, it follows that:
2
22
2
0
2
0
()
,
()
var ( 1).
TT
TT T
ST
Ee
S
ST
ee
S
σ
α
ασ σ
+
+
⎛⎞
=
⎜⎟
⎝⎠
⎛⎞
=
−
⎜⎟
⎝⎠
(3.14)
3.2 The Black-Scholes Formula
Starting from the result (2.21) and using Proposition 3.1 under the risk neutral
measure, Cox & Rubinstein (1985) proved that the asymptotic value of the call is
given by the famous
Black and Scholes (1973) formula:
()
(,) () (1 ) ( ),
ln / (1 )
1
.
2
T
T
CST S x K i x T
SK i
xT
T
σ
σ
σ
−
−
=Φ − + Φ −
+
=+
(3.15)
Here, we note the call using the maturity as second variable and S representing
the value of the underlying asset at time 0.
The interpretation of the Black and Scholes formula can be given with the
concept of a hedging portfolio.
Indeed, we already know that in the CRR model, the value of the call takes the
form:
CS B
=
Δ+
,
(3.16)
Δ
representing the proportion of assets in the portfolio and B the quantity
invested on the non-risky rate at t=0.
From the result (3.16), at the limit, we obtain:
(),
(1 ) ( ).
T
x
B
Ki x T
σ
−
Δ=Φ
=− + Φ −
(3.17)
So, under the assumption of an efficient market, the hedging portfolio is also
known in continuous time.
Remark 3.1 This hedging portfolio must of course, at least theoretically, be
rebalanced at every time s on [0,T]. Rewriting the Black and Scholes formula for
computing the call at time s, the underlying asset having the value S, we get:
()
()
()
(), (1 ) ( ),
ln / (1 )
1
.
2
Ts
Ts
x
BKi x Ts
SK i
xTs
Ts
σ
σ
σ
−−
−−
Δ=Φ =− + Φ − −
+
=+−
−
(3.18)
184 Chapter 5
Of course a continuous rebalancing and even a portfolio with frequent time
changes are not possible due to the transaction costs.
4 THE BLACK-SCHOLES CONTINUOUS TIME MODEL
4.1 The Model
In fact, Black and Scholes used a continuous time model for the underlying asset
introduced by Samuelson (1965).
On a complete filtered probability space
(
)
(
)
Pt
t
,0,,, ≥
ℑ
ℑ
Ω
(see Definition 7.2
of Chapter 1) the stochastic process
(
)
(), 0SStt
=
≥
(4.1)
will now represent the time evolution of the underlying asset.
The basic assumption is that the stochastic dynamic of the S-process is given by
0
() () () (),
(0) ,
dSt Stdt StdBt
SS
μ
σ
=
+
=
(4.2)
where the process
[
]
((), 0, )
B
Bt t T=∈is a standard Brownian process (see
Chapter 1, section 9 adapted to the considered filtration.
4.2 The Itô Or Stochastic Calculus
In (4.2), the equation is in fact a stochastic differential equation or an Itô
differential equation as the term dB(t) must be considered formally since we
know that the sample paths of a Brownian motion are a.s. non-differentiable (see
Chapter 1,
Proposition 9.1).
That is why Itô (1944) created a new type of calculus, called stochastic calculus
in which the integral with respect to b is defined as follows for every stochastic
process
[]
(
)
(), 0,
f
ft t T=∈ adapted and integrable:
[]
1
1
0
0
(,) (,) lim (,) ( ,) (,),
t
n
kk k
k
k
ft dBt ft Bt Bt
ω
ωωωω
−
+
→∞
=
=−
∑
∫
(4.3)
where
(
)
[
]
01 0
, ,..., ,( 0, , 0, )
nn
tt t t t tt T==∈ is a subdivision of
[
]
0,t whose norm
tends to 0 for n tending to
+∞ , the limit being the so-called uniform convergence
in probability (see Protter (1990)).
Conversely, using the differential notation, if the stochastic process
[
]
(
)
(), 0,tt T
ξξ
=∈ is declared to satisfy the following relation, called the Itô
differential of
ξ
:

Black & Scholes extensions 185
d
ξ
(t)
=
a(t)dt
+
b(t)dB(t)
; (4.4)
then:
00
() (0) ( ) ( ) ( ).
tt
tasdsbsdBs
ξξ
−= +
∫∫
(4.5)
For our applications, the main result is the so-called Itô´s lemma or the Itô
formula, which is equivalent to the rule of derivatives for composed functions in
the classical differential calculus.
Let f be a function of two non-negative real variables x ,t such that
00
,, , .
xxxt
fC fff C
+
+
××
∈∈
(4.6)
Then the composed stochastic process
f (
ξ
(t), t),t ≥ 0
(
)
(4.7)
is also Itô differentiable and its stochastic differential is given by:
(
)
2
2
22
((),)
1
((),)() ((),) ((),) ()
2
( ( ), ) ( ) ( ).
df tt
ff
ttat tt f ttbt dt
xtx
f
ttbtdBt
x
ξ
∂∂∂
ξξ ξ
∂∂∂
∂
ξ
∂
=
⎡⎤
++
⎢⎥
⎣⎦
+
(4.8)
Remark 4.1 Compared with the classical differential calculus, we know that in
this case, we should have:
()
( ( ), ) ( ( ), ) ( ) ( ( ), )
( ( ), ) ( ) ( ).
ff
df tt ttat tt dt
xt
f
ttbtdBt
x
∂∂
ξξ ξ
∂∂
∂
ξ
∂
⎡
⎤
=+
⎢
⎥
⎣
⎦
+
(4.9)
So, the difference between relations (4.8) and (4.9) is the supplementary term
1
2
∂
2
∂
2
2
x
f (
ξ
(t),t)b
2
(t)
(4.10)
appearing in (4.8) and which is null iff in two cases:
1) f is a linear function of x,
2) b is identically equal to 0.
Examples
1) For
ξ
given by:
d
ξ
(t)
=
dB(t),
ξ
(0) = 0.
(4.11)
Using notation (4.4), we get:
a(t)=0, b(t)=1. (4.12)

186 Chapter 5
With the aid of the Itô formula, the value of
2
()dt
ξ
is given by
d
2
ξ
(t ) = 2
ξ
(t ). 0 + 0 +
1
2
.2.1
⎡
⎣
⎢
⎤
⎦
⎥
dt + 2
ξ
(t).1. dB(t),
(4.13)
and so
2
() 2 (). ().dB t dt B t dB t=+ (4.14)
As we can see, the first term is the supplementary term with respect to the
classical formula and is called the drift.
2) Proceeding as for the preceding example, we get for
()
B
t
de :
() () ()
1
().
2
Bt Bt Bt
de e dt e dB t=+ (4.15)
Here, the drift is given by the first term of the second member of (4.15).
4.3 The Solution Of The Black-Scholes-Samuelson Model
Let us go back to the model (4.2) given by:
.)0(
),()()()(
0
SS
tdBt
S
dtt
S
td
S
=
+
=
σ
μ
(4.16)
Using the Itô formula for lnS(t), we get:
2
ln ( ) ( )
2
dSt dt dBt
σ
μσ
⎛⎞
=− +
⎜⎟
⎝⎠
(4.17)
and so by integration:
2
0
ln ( ) ln ( ).
2
St S t Bt
σ
μσ
⎛⎞
−=− +
⎜⎟
⎝⎠
(4.18)
Since for every fixed t, B(t) has a normal distribution with parameters (0,t) - t for
the variance - (see Chapter 1,
Definition 9.1), this last result shows that the r.v.
S(t)/S
0
has a log-normal distribution with parameters
2
2
,
2
tt
σ
μσ
⎛⎞
⎛⎞
−
⎜⎟
⎜⎟
⎜⎟
⎝⎠
⎝⎠
and so:
2
0
2
0
()
log ,
2
()
var log .
St
E
t
S
St
t
S
σ
μ
σ
⎛⎞
⎛⎞
=−
⎜⎟
⎜⎟
⎝⎠
⎝⎠
⎛⎞
=
⎜⎟
⎝⎠
(4.19)
Of course, from result (4.18), we obtain the explicit form of the trajectories of the
S-process:
2
2
()
0
() .
t
B
t
St Se e
σ
μ
σ
⎛⎞
−
⎜⎟
⎜⎟
⎝⎠
= (4.20)
This process is called a geometric brownian motion.

Black & Scholes extensions 187
The fact of having the log-normality confirms the CRR process at the limit as,
indeed, a lot of empirical studies show that, for an efficient market, stock prices
are well adjusted with such a distribution.
From properties of the log-normal distribution (see Chapter 1, section 5.4), we
obtain:
2
0
2
0
()
,
()
var ( 1).
t
tt
St
Ee
S
St
ee
S
μ
μσ
⎛⎞
=
⎜⎟
⎝⎠
⎛⎞
=
−
⎜⎟
⎝⎠
(4.21)
So, we see that the mean value of the asset at time t is given as if the initial
amount S
0
was invested at the non-risky instantaneous interest rate
μ
and that its
value is above or below S
0
following the “hazard” variations modelled with the
Brownian motion.
We also see that the variance of S(t) increases with time in conformity with the
fact that, for long time periods, variations of the asset are very difficult to predict.
The explicit relation (4.20) can also be written in the form:
2
2
()
0
()
.
t
Bt
St
e
Se
σ
μ
σ
⎛⎞
−
⎜⎟
⎜⎟
⎝⎠
= (4.22)
This allows us to distinguish three cases:
(i)
2
.
2
σ
μ
= (4.23)
If so, the evolution of the asset is that of a pure Brownian exponential.
(ii)
2
.
2
σ
μ
> (4.24)
Here, S(t) will vary faster than the pure Brownian exponential and so, we may
expect at certain times large gains but also large losses parallel with the time
evolution of the pure brownian exponential
(iii)
2
.
2
σ
μ
< (4.25)
Here, the situation is similar but the evolution is opposed to that of the pure
Brownian exponential.
From the second result of (4.21), it is also clear that the expectations of large
gains - and losses! - are better for large values of
σ
; that is why
σ
is called the
volatility of the considered asset.
It follows that a market with high volatility will attract risk lover investors and
not risk averse investors
From the explicit form, it is not difficult to simulate trajectories of the S-process.
The next figure shows a typical form.