Jackson S.L. Research Methods and Statistics: A Critical Thinking Approach
Подождите немного. Документ загружается.

112
■ ■
CHAPTER 5
toward it and thus increases or inflates the mean. Thus, in distributions that
have one or a few extreme scores (either high or low), the mean is not a
good indicator of central tendency. In such cases, a better measure of central
tendency is the median.
The median is the middle score in a distribution after the scores have
been arranged from highest to lowest or lowest to highest. The distribution
of salaries in Table 5.6 is already ordered from lowest to highest. To deter-
mine the median, we simply have to find the middle score. In this situation,
with 25 scores, that is the 13th score. You can see that the median of the dis-
tribution is a salary of $27,000, which is far more representative of the central
tendency for this distribution of salaries.
Why is the median not as influenced as the mean by extreme scores?
Think about the calculation of each of these measures. When calculating the
mean, we must add in the atypical income of $1,800,000, thus distorting the
calculation. When determining the median, however, we do not consider the
size of the $1,800,000 income; it is only a score at one end of the distribution
whose numerical value does not have to be considered to locate the middle
score in the distribution. The point to remember is that the median is not
affected by extreme scores in a distribution because it is only a positional
value. The mean is affected by extreme scores because its value is deter-
mined by a calculation that has to include the extreme values.
In the salary example, the distribution has an odd number of scores
(N 25). Thus, the median is an actual score in the distribution (the 13th
score). In distributions that have an even number of observations, the
median A measure of central
tendency; the middle score in
a distribution after the scores
have been arranged from
highest to lowest or lowest to
highest.
median A measure of central
tendency; the middle score in
a distribution after the scores
have been arranged from
highest to lowest or lowest to
highest.
TABLE 5.6 Yearly Salaries for 25 Employees
SALARY FREQUENCY fX
$ 15,000 1 15,000
20,000 2 40,000
22,000 1 22,000
23,000 2 46,000
25,000 5 125,000
27,000 2 54,000
30,000 3 90,000
32,000 1 32,000
35,000 2 70,000
38,000 1 38,000
39,000 1 39,000
40,000 1 40,000
42,000 1 42,000
45,000 1 45,000
1,800,000 1 1,800,000
N 25 X 2,498,000
10017_05_ch5_p103-139.indd 112 2/1/08 1:19:00 PM

Data Organization and Descriptive Statistics
■ ■
113
median is calculated by averaging the two middle scores. In other words, we
determine the middle point between the two middle scores. Look back at the
distribution of exam scores in Table 5.5. This distribution has 30 scores. The
median is the average of the 15th and 16th scores (the two middle scores).
Thus, the median is 75.5—not an actual score in the distribution, but the
middle point nonetheless. Notice that in this distribution, the median (75.5)
is very close to the mean (74.00). They are so similar because this distribution
contains no extreme scores; both the mean and the median are representative
of the central tendency of the distribution.
Like the mean, the median can be used with ratio and interval data and
is inappropriate for use with nominal data, but unlike the mean, the median
can be used with most ordinal data. In other words, it is appropriate to
report the median for a distribution of ranked scores.
Mode. The third measure of central tendency is the mode—the score in a dis-
tribution that occurs with the greatest frequency. In the distribution of exam
scores, the mode is 74 (similar to the mean and median). In the distribution
of salaries, the mode is $25,000 (similar to the median but not the mean). In
some distributions, all scores occur with equal frequency; such a distribu-
tion has no mode. In other distributions, several scores occur with equal
frequency. Thus, a distribution may have two modes (bimodal), three modes
(trimodal), or even more. The mode is the only indicator of central tendency
that can be used with nominal data. Although it can also be used with ordi-
nal, interval, or ratio data, the mean and median are more reliable indicators
of the central tendency of a distribution, and the mode is seldom used.
mode A measure of central
tendency; the score in a dis-
tribution that occurs with the
greatest frequency.
mode A measure of central
tendency; the score in a dis-
tribution that occurs with the
greatest frequency.
Measures of Central Tendency IN REVIEW
TYPES OF CENTRAL TENDENCY MEASURES
MEAN MEDIAN MODE
Definition The arithmetic average The middle score in a distribution The score occurring with
of scores organized from highest greatest frequency
to lowest or lowest to highest
Use with Interval and ratio data Ordinal, interval, and ratio data Nominal, ordinal, interval,
or ratio data
Cautions Not for use with distributions Not a reliable measure
with a few extreme scores of central tendency
CRITICAL
THINKING
CHECK
5.2
1. In the example described in Critical Thinking Check 5.1, a researcher
collected data on drivers’ gender, type of vehicle, and speed of
travel. What is an appropriate measure of central tendency to calcu-
late for each type of data?
2. If one driver was traveling at 100 mph (25 mph faster than anyone
else), which measure of central tendency would you recommend
against using?
10017_05_ch5_p103-139.indd 113 2/1/08 1:19:00 PM

114
■ ■
CHAPTER 5
Measures of Variation
A measure of central tendency provides information about the “middle-
ness” of a distribution of scores but not about the width or spread of the
distribution. To assess the width of a distribution, we need a measure
of variation or dispersion. A measure of variation indicates the degree
to which scores are either clustered or spread out in a distribution. As
an illustration, consider the two very small distributions of exam scores
shown in Table 5.7. Notice that the mean is the same for both distribu-
tions. If these data represented two very small classes of students, report-
ing that the two classes had the same mean on the exam might lead you
to conclude that the classes performed essentially the same. Notice, how-
ever, how different the distributions are. Providing a measure of variation
along with a measure of central tendency conveys the information that
even though the distributions have the same mean, their spreads are very
different.
We will discuss three measures of variation: the range, the average devia-
tion, and the standard deviation. The range can be used with ordinal, inter-
val, or ratio data; however, the standard deviation and average deviation are
appropriate for only interval and ratio data.
Range. The simplest measure of variation is the range—the difference
between the lowest and the highest scores in a distribution. The range is usu-
ally reported with the mean of the distribution. To find the range, we simply
subtract the lowest score from the highest score. In our hypothetical distribu-
tions of exam scores in Table 5.7, the range for Class 1 is 100 points, whereas
the range for Class 2 is 10 points. Thus, the range provides some information
concerning the difference in the spreads of the distributions. In this simple
measure of variation, however, only the highest and lowest scores enter the
calculation, and all other scores are ignored. For example, in the distribution
of 30 exam scores in Table 5.5, only 2 of the 30 scores are used in calculating
the range (9545 50). Thus, the range is easily distorted by one unusually
high or low score in a distribution.
Average Deviation and Standard Deviation. More sophisticated measures
of variation use all of the scores in the distribution in their calculation. The
most commonly used measure of variation is the standard deviation. Most
people have heard this term before and may even have calculated a standard
deviation if they have taken a statistics class. However, many people who
know how to calculate a standard deviation do not really appreciate the
information it provides.
To begin, let’s think about what the phrase standard deviation means.
Other words that might be substituted for the word standard include aver-
age, normal, and usual. The word deviation means to diverge, move away from,
or digress. Putting these terms together, we see that the standard deviation
means the average movement away from something. But what? It is the
average movement away from the center of the distribution—the mean.
measure of variation A
number that indicates the de-
gree to which scores are either
clustered or spread out in a
distribution.
measure of variation A
number that indicates the de-
gree to which scores are either
clustered or spread out in a
distribution.
TABLE 5.7 Two
Distributions of
Exam Scores
CLASS 1 CLASS 2
0 45
50 50
100 55
150 150
50 50
TABLE 5.7 Two
Distributions of
Exam Scores
CLASS 1 CLASS 2
0 45
50 50
100 55
150 150
50 50
range A measure of
variation; the difference between
the lowest and the highest
scores in a distribution.
range A measure of
variation; the difference between
the lowest and the highest
scores in a distribution.
10017_05_ch5_p103-139.indd 114 2/1/08 1:19:01 PM
Data Organization and Descriptive Statistics
■ ■
115
The standard deviation, then, is the average distance of all the scores in
the distribution from the mean or central point of the distribution—or, as
you’ll see shortly, the square root of the average squared deviation from the
mean. Think about how we would calculate the average distance of all the
scores from the mean of the distribution. First, we would have to determine
how far each score is from the mean; this is the deviation, or difference,
score. Then, we would have to average these scores. This is the basic idea
behind calculating the standard deviation.
The data in Table 5.5 are presented again in Table 5.8. Let’s use these data
to calculate the average distance from the mean. We begin with a calculation
that is slightly simpler than the standard deviation, known as the average
deviation. The average deviation is essentially what the name implies—the
average distance of all the scores from the mean of the distribution. Referring
to Table 5.8, you can see that we begin by determining how much each score
deviates from the mean, or
X
Then we need to sum the deviation scores. Notice, however, that if we
were to sum these scores, they would add to zero. Therefore, we first take
the absolute value of the deviation scores (the distance from the mean,
irrespective of direction), as shown in the last column of Table 5.8. To cal-
culate the average deviation, we sum the absolute value of each deviation
score:
X
Then we divide the sum by the total number of scores to find the average
deviation:
AD
X
________
N
Using the data from Table 5.8, we can calculate the average deviation as
follows:
AD
X
________
N
332
____
30
11.07
For the exam score distribution, the scores fall an average of 11.07 points
from the mean of 74.00.
Although the average deviation is fairly easy to compute, it isn’t as use-
ful as the standard deviation because, as we will see in later chapters, the
standard deviation is used in many other statistical procedures.
The standard deviation is very similar to the average deviation. The
only difference is that rather than taking the absolute value of the devia-
tion scores, we use another method to “get rid of” the negative deviation
scores—we square them. This procedure is illustrated in Table 5.9. Notice
that this table is very similar to Table 5.8. It includes the distribution of exam
standard deviation A mea-
sure of variation; the average
difference between the scores in
the distribution and the mean or
central point of the distribution,
or more precisely, the square
root of the average squared
deviation from the mean.
standard deviation A mea-
sure of variation; the average
difference between the scores in
the distribution and the mean or
central point of the distribution,
or more precisely, the square
root of the average squared
deviation from the mean.
average deviation An
alternative measure of variation
that, like the standard deviation,
indicates the average differ-
ence between the scores in a
distribution and the mean of the
distribution.
average deviation An
alternative measure of variation
that, like the standard deviation,
indicates the average differ-
ence between the scores in a
distribution and the mean of the
distribution.
10017_05_ch5_p103-139.indd 115 2/1/08 1:19:01 PM

116
■ ■
CHAPTER 5
TABLE 5.8 Calculations for the Sum of the Absolute Values of the
Deviation Scores ( 74)
X X |X |
45 29.00 29.00
47 27.00 27.00
54 20.00 20.00
56 18.00 18.00
59 15.00 15.00
60 14.00 14.00
60 14.00 14.00
63 11.00 11.00
65 9.00 9.00
69 5.00 5.00
70 4.00 4.00
74 0.00 0.00
74 0.00 0.00
74 0.00 0.00
75 1.00 1.00
76 2.00 2.00
77 3.00 3.00
78 4.00 4.00
78 4.00 4.00
80 6.00 6.00
82 8.00 8.00
82 8.00 8.00
85 11.00 11.00
86 12.00 12.00
87 13.00 13.00
90 16.00 16.00
92 18.00 18.00
93 19.00 19.00
94 20.00 20.00
95 21.00 21.00
|X| 332.00
10017_05_ch5_p103-139.indd 116 2/1/08 1:19:02 PM
Data Organization and Descriptive Statistics
■ ■
117
scores, the deviation scores, and the squared deviation scores. The formula
for the standard deviation is
_________
(X )
2
_________
N
This formula represents the standard deviation for a population. The
symbol for the population standard deviation is (pronounced “sigma”). To
derive the standard deviation for a sample, the calculation is the same, but
the symbols differ. We will discuss this later in the chapter.
Notice that the formula for is similar to that for the average devia-
tion. We determine the deviation scores, square the deviation scores, sum
the squared deviation scores, and divide by the number of scores in the
distribution. Last, we take the square root of that number. Why? Squaring
the deviation scores has inflated them. We now need to bring the squared
deviation scores back to the same level of measurement as the mean so that
the standard deviation is measured on the same scale as the mean.
Now, using the sum of the squared deviation scores (5,580.00) from
Table 5.9, we can calculate the standard deviation:
__________
(X )
2
__________
N
________
5,580.00
________
30
______
186.00 13.64
We can compare this number with the average deviation calculated on
the same data (AD 11.07). The standard deviation tells us that the exam
scores fall an average of 13.64 points from the mean of 74.00. The standard
deviation is slightly larger than the average deviation of 11.07 and will
always be larger whenever both of these measures of variation are calculated
on the same distribution of scores. This occurs because we are squaring the
deviation scores and thus giving more weight to those that are farther from
the mean of the distribution. The scores that are lowest and highest have the
largest deviation scores; squaring them exaggerates this difference. When
all of the squared deviation scores are summed, these large scores neces-
sarily lead to a larger numerator and, even after we divide by N and take
the square root, result in a larger number than what we find for the average
deviation.
If you have taken a statistics class, you may have used the “raw-score (or
computational) formula” to calculate the standard deviation. The raw-score
formula is shown in Table 5.10, where it is used to calculate the standard
deviation for the same distribution of exam scores. The numerator repre-
sents an algebraic transformation from the original formula that is somewhat
shorter to use. Although the raw-score formula is slightly easier to use, it is
more difficult to equate this formula with what the standard deviation actu-
ally is—the average deviation (or distance) from the mean for all the scores
in the distribution. Thus, I prefer the definitional formula because it allows
you not only to calculate the statistic but also to understand it better.
As mentioned previously, the formula for the standard deviation for
a sample (S) differs from the formula for the standard deviation for a
10017_05_ch5_p103-139.indd 117 2/1/08 1:19:02 PM

118
■ ■
CHAPTER 5
TABLE 5.9 Calculations for the Sum of the Squared Deviation Scores
X X (X )
2
45 29.00 841.00
47 27.00 729.00
54 20.00 400.00
56 18.00 324.00
59 15.00 225.00
60 14.00 196.00
60 14.00 196.00
63 11.00 121.00
65 9.00 81.00
69 5.00 25.00
70 4.00 16.00
74 0.00 0.00
74 0.00 0.00
74 0.00 0.00
75 1.00 1.00
76 2.00 4.00
77 3.00 9.00
78 4.00 16.00
78 4.00 16.00
80 6.00 36.00
82 8.00 64.00
82 8.00 64.00
85 11.00 121.00
86 12.00 144.00
87 13.00 169.00
90 16.00 256.00
92 18.00 324.00
93 19.00 361.00
94 20.00 400.00
95 21.00 441.00
(X )
2
5,580.00
10017_05_ch5_p103-139.indd 118 2/1/08 1:19:02 PM

Data Organization and Descriptive Statistics
■ ■
119
population () only in the symbols used to represent each term. The formula
for a sample is
S
__________
(X
X )
2
_________
N
where
X each individual score
X sample mean
N number of scores in the distribution
S sample standard deviation
Note that the main difference is in the symbol for the mean (
X rather
than ). This difference reflects the symbols for the population mean versus
the sample mean. However, the calculation is exactly the same as for . Thus,
if we used the data set in Table 5.9 to calculate S, we would arrive at exactly
the same answer that we got for , 13.64.
If, however, we are using sample data to estimate the popula-
tion standard deviation, then the standard deviation formula must be
slightly modified. The modification provides what is called an “unbiased
estimator” of the population standard deviation based on sample data.
The modified formula is
s
__________
(X
X )
2
_________
N 1
Notice that the symbol for the unbiased estimator of the population stand-
ard deviation is s (lowercase), whereas the symbol for the sample standard
deviation is S (uppercase). The main difference, however, is the denomina-
tor: N1 rather than N. The reason is that the standard deviation within a
small sample may not be representative of the population; that is, there may
not be as much variability in the sample as there actually is in the popula-
tion. We therefore divide by N1 because dividing by a smaller number
increases the standard deviation and thus provides a better estimate of the
population standard deviation.
We can use the formula for s to calculate the standard deviation on the
same set of exam score data. Before we even begin the calculation, we know
that because we are dividing by a smaller number (N1), s should be larger
than either or S (which were both 13.64). Normally we would not com-
pute , S, and s on the same distribution of scores because is the standard
TABLE 5.10 Standard Deviation Raw-Score Formula
=
2
2
=
169,860
(2,220)
2
30
30
=
169,860
X
X
N
N
−
∑
()
∑
4,928,400
30
30
=
169,860 164,280
30
=
5,580
30
=18
66 = 13.64
10017_05_ch5_p103-139.indd 119 2/1/08 1:19:02 PM

120
■ ■
CHAPTER 5
deviation for the population, S is the standard deviation for a sample, and
is the unbiased estimator of the population standard deviation based on
sample data. We are doing so here simply to illustrate the difference in the
formulas.
s
__________
(X
X )
2
_________
N 1
________
5,580.00
________
30 1
________
5,580.00
________
29
______
192.41 13.87
Note that s (13.87) is slightly larger than and S (13.64).
One final measure of variability is called the variance. The variance is
equal to the standard deviation squared. Thus, the variance for a population
is
2
, for a sample is S
2
, and for the unbiased estimator of the population is
s
2
. Because the variance is not measured in the same level of measurement as
the mean (it’s the standard deviation squared), it isn’t as useful a descriptive
statistic as the standard deviation. Thus, we will not discuss it in great detail
here; however, the variance is used in more advanced statistical procedures
presented later in the text.
The formulas for the average deviation, standard deviation, and variance
all use the mean. Thus, it is appropriate to use these measures with interval
or ratio data but not with ordinal or nominal data.
variance The standard
deviation squared.
variance The standard
deviation squared.
TYPES OF VARIATION MEASURES
Range Average Deviation Standard Deviation
Definition The difference between The average distance of The square root of the average
the lowest and highest the scores from the mean squared deviation from
scores in the distribution of the distribution the mean of a distribution
Use With Primarily interval and Primarily interval and Primarily interval and
ratio data ratio data ratio data
Cautions A simple measure that does A more sophisticated measure in The most sophisticated measure
not use all scores in the which all scores are used but and most frequently used
distribution in its calculation which may not weight extreme measure of variation
scores adequately
IN REVIEW Measures of Variation
CRITICAL
THINKING
CHECK
5.3
1. For a distribution of scores, what information does a measure of
variation add that a measure of central tendency does not convey?
2. Today’s weather report included information on the normal rain-
fall for this time of year. The amount of rain that fell today was
1.5 inches above normal. To decide whether this is an abnormally
high amount of rain, you need to know that the standard deviation
for rainfall is 0.75 of an inch. What would you conclude about how
normal the amount of rainfall was today? Would your conclusion be
different if the standard deviation were 2 inches rather than 0.75 of
an inch?
10017_05_ch5_p103-139.indd 120 2/1/08 1:19:03 PM
Data Organization and Descriptive Statistics
■ ■
121
Types of Distributions
In addition to knowing the central tendency and the width or spread of a
distribution, it is important to know about the shape of the distribution.
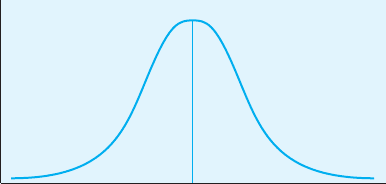
Normal Distributions. When a distribution of scores is fairly large
(N 30), it often tends to approximate a pattern called a normal distribution.
When plotted as a frequency polygon, a normal distribution forms a sym-
metrical, bell-shaped pattern often called a normal curve (see Figure 5.4).
We say that the pattern approximates a normal distribution because a true
normal distribution is a theoretical construct not actually observed in the
real world.
The normal distribution is a theoretical frequency distribution that has
certain special characteristics. First, it is bell-shaped and symmetrical—the
right half is a mirror image of the left half. Second, the mean, median, and
mode are equal and are located at the center of the distribution. Third, the
normal distribution is unimodal—it has only one mode. Fourth, most of
the observations are clustered around the center of the distribution, with
far fewer observations at the ends or “tails” of the distribution. Last, when
standard deviations are plotted on the x-axis, the percentage of scores fall-
ing between the mean and any point on the x-axis is the same for all normal
curves. This important property of the normal distribution will be discussed
more fully later in the chapter.
Kurtosis. Although we typically think of the normal distribution as being
similar to the curve depicted in Figure 5.4, there are variations in the shape
of normal distributions. Kurtosis refers to how flat or peaked a normal dis-
tribution is. In other words, kurtosis refers to the degree of dispersion among
the scores, or whether the distribution is tall and skinny or short and fat. The
normal distribution depicted in Figure 5.4 is called mesokurtic—the term
meso means middle. Mesokurtic curves have peaks of medium height, and
the distributions are moderate in breadth. Now look at the two distributions
depicted in Figure 5.5. The normal distribution on the left is leptokurtic—the
term lepto means thin. Leptokurtic curves are tall and thin, with only a few
scores in the middle of the distribution having a high frequency. Last, see the
normal curve A
symmetrical, bell-shaped
frequency polygon representing
a normal distribution.
normal curve A
symmetrical, bell-shaped
frequency polygon representing
a normal distribution.
normal distribution
A theoretical frequency
distribution that has certain
special characteristics.
normal distribution
A theoretical frequency
distribution that has certain
special characteristics.
kurtosis How flat or peaked
a normal distribution is.
kurtosis How flat or peaked
a normal distribution is.
mesokurtic Normal curves
that have peaks of medium
height and distributions that are
moderate in breadth.
mesokurtic Normal curves
that have peaks of medium
height and distributions that are
moderate in breadth.
leptokurtic Normal curves
that are tall and thin, with only
a few scores in the middle of
the distribution having a high
frequency
.
leptokurtic Normal curves
that are tall and thin, with only
a few scores in the middle of
the distribution having a high
frequency.
FIGURE 5.4
A normal
distribution
Mean
Median
Mode
10017_05_ch5_p103-139.indd 121 2/1/08 1:19:04 PM