Heiman G. Basic Statistics for the Behavioral Sciences
Подождите немного. Документ загружается.


208 CHAPTER 10 / Introduction to Hypothesis Testing
Also, the introduction of each inferential statistical procedure will include a check-
list of the procedure’s assumptions. The assumptions are the rules for when to use it:
they tell you that a procedure is appropriate assuming that your design and your data
meet certain requirements. (Note: Select your inferential procedure and check its
assumptions prior to actually collecting data. Otherwise, your data may fit no proce-
dure, in which case the study is useless.)
WHY IS IT IMPORTANT TO KNOW ABOUT THE z-TEST?
The z-test is one of the simplest inferential statistics around, so it is a good starting
point for learning these procedures. Also, when reading behavioral research, you may
encounter a study that employs it, so you should understand how it works. Most impor-
tantly, the discussion will introduce the formal system researchers use in all inferential
procedures. Therefore, understand the general steps and terminology involved here
because you’ll see them again and again.
THE ROLE OF INFERENTIAL STATISTICS IN RESEARCH
As you saw in the previous chapter, a random sample may be more or less representa-
tive of a population because, just by the luck of the draw, the sample may contain too
many high scores or too many low scores relative to the population. Because the sam-
ple is not perfectly representative, it reflects sampling error, and so the sample mean
does not equal the population mean.
Here is how sampling error can impact on an experiment. Recall that in experiments,
we hope to see a relationship in which, as we change the conditions of the independent
variable, scores on the dependent variable change in a consistent fashion. Therefore, if
the means for the conditions are different from each other, we infer that if we measured
the entire population, we would find a different population of scores located around a
different for each condition. But here is where sampling error comes in. Maybe the
sample means for the conditions differ because of sampling error, and actually they all
poorly represent the same population. If so, then the relationship does not exist: We’d
find the same population of scores, having the same , in each condition. Or because
of sampling error, perhaps the actual relationship in the population is different from the
relationship in our sample data.
For example, say that we compare men and women on the dependent variable of cre-
ativity. In nature, men and women don’t really differ on this variable, so their are
equal. However, through sampling error—the luck of the draw—we might end up with
some female participants who are more creative than our male participants, or vice
versa. Then sampling error will mislead us into thinking that this relationship exists,
even though it really does not. Or, say that we measure the heights of some men and
women and, by chance, obtain a sample of relatively short men and a sample of tall
women. If we didn’t already know that men are taller, sampling error would mislead us
into concluding that women are taller.
Researchers perform inferential statistics in every study, because it is always possi-
ble that we are being misled by sampling error so that the relationship we see in our
sample data is not the relationship found in nature.
Previously we’ve said that inferential statistics are used to decide if sample data
represent a particular relationship in the population. Using the process discussed in
the previous chapter, the decision boils down to this: (1) Should we believe that the
s

Setting Up Inferential Procedures 209
relationship we see in the sample data is generally the same as the relationship we
would find if we tested the entire population? or (2) Should we conclude that
the relationship in the sample is a coincidence produced by sampling error, and that
the sample does not accurately represent the populations and relationship found
in nature?
The specific inferential procedure employed in a given research situation depends
upon the research design and on the scale of measurement used when measuring the
dependent variable. We have, however, two general categories of inferential statistics:
Parametric statistics are procedures that require specific assumptions about the char-
acteristics of our populations. (Remember parametric by recalling that a population’s
characteristics are called parameters.) Two assumptions common to all parametric
procedures are (1) the population of dependent scores forms a normal distribution, and
(2) the scores are interval or ratio scores. Thus, parametric procedures are used when it
is appropriate to compute the mean in each condition. In this and upcoming chapters,
we’ll focus on parametric procedures.
The other category is nonparametric statistics, which are inferential procedures
that do not require stringent assumptions about our populations. These procedures are
used with nominal or ordinal scores or with skewed interval or ratio distributions (when
it is appropriate to calculate the median or mode). Chapter 15 presents nonparametric
procedures.
REMEMBER Parametric and nonparametric inferential statistics are for
deciding if the data accurately represent a relationship in nature, or if sam-
pling error is misleading us into thinking there is this relationship.
As we’ll see, parametric procedures are often preferable, so typically we use non-
parametric procedures only when the data clearly violate the assumptions of paramet-
ric procedures. Instead, we can use a parametric procedure if the data come close to
meeting its assumptions. For example, if our population is approximately normally dis-
tributed, we can still use a parametric procedure.
As you’ll see, both parametric and nonparametric procedures are performed in the
same way. The first step is setting up the procedure.
SETTING UP INFERENTIAL PROCEDURES
Researchers follow four steps when setting up an experiment: Create the experimental
hypotheses, design the experiment to test these hypotheses, translate the experimental
hypotheses into statistical hypotheses, and select and set up the appropriate statistical pro-
cedure to test the statistical hypotheses.
Creating the Experimental Hypotheses
Recognize that the purpose of all experiments is to obtain data that will help us to
resolve the simplest of debates: maybe my independent variable works as I think it does
versus maybe it does not. From this, we first create two experimental hypotheses.
Experimental hypotheses describe the predicted relationship we may or may not find.
One hypothesis states that we will demonstrate the predicted relationship (manipulat-
ing the independent variable will work as expected). The other hypothesis states that
we will not demonstrate the predicted relationship (manipulating the independent vari-
able will not work as expected).

210 CHAPTER 10 / Introduction to Hypothesis Testing
However we can predict a relationship in one of two ways. Sometimes we expect a
relationship, but we are not sure whether scores will increase or decrease as we change
the independent variable. This leads to a two-tailed statistical procedure. A two-tailed
test is used when we predict a relationship but do not predict the direction in which scores
will change. Notice that a two-tailed test occurs when we predict that one group will pro-
duce different dependent scores than the other group, without saying which group will
score higher. For example, we have a two-tailed test if we propose that “men and women
differ in creativity” or that “higher anxiety levels will alter participants’ test scores.”
At other times, we do predict the direction in which the dependent scores will
change. A one-tailed test is used when we predict the direction in which scores will
change. We may predict that as we change the independent variable, the dependent
scores will only increase, or we may predict that they will only decrease. Notice that a
one-tailed test occurs when we predict which group will have the higher dependent
scores. For example, we have a one-tailed test if we predict that “men are more creative
than women” or that “higher anxiety levels will lower test scores.”
REMEMBER A two-tailed test is used when you do not predict the direction
that scores will change. A one-tailed test is used when you do predict the
direction that scores will change.
Let’s first examine a study involving a two-tailed test. Say that we’ve discovered a
chemical that is related to intelligence, which we are ready to test on humans in an “IQ
pill.” The amount of the pill is our independent variable, and a person’s resulting IQ is
the dependent variable. We believe that this pill will affect IQ, but we are not sure
whether it will make people smarter or dumber. Therefore, here are our two-tailed
experimental hypotheses:
1. We will demonstrate that the pill works by either increasing or decreasing IQ
scores.
2. We will not demonstrate that the pill works, because IQ scores will not change.
Remember, however, that ultimately researchers want to describe what occurs in
nature, in what we call the population. Therefore, although we must first see that the
independent variable works as predicted in our sample, the real issue is whether we can
conclude that it works in the population.
Designing a One-Sample Experiment
There are many ways we might design a study to test our pill, but the simplest way is
as a one-sample experiment. We will randomly select one sample of participants and
give each person, say, one pill. Then we’ll give participants an IQ test. The sample will
represent the population of people who have taken one pill, and the sample will rep-
resent the population .
To demonstrate a relationship, however, we must demonstrate that different amounts
of the pill produce different populations of IQ scores, having different s. Therefore,
we must compare the population represented by our sample to some other population
receiving some other amount of the pill. To perform a one-sample experiment, we must
already know the population mean under some other condition of the independent vari-
able. Here our independent variable is the amount of the pill taken, and one amount that
we already know about is zero amount. The IQ test has been given to many people
over the years who have not taken the pill, and let’s say this population has a of 100.
X
Setting Up Inferential Procedures 211
X
Low IQ scores
IQ scores
f
High IQ scores
No pill One pill
XXXXXXXXXXXXXXXXX
μ
=100
μ
>100
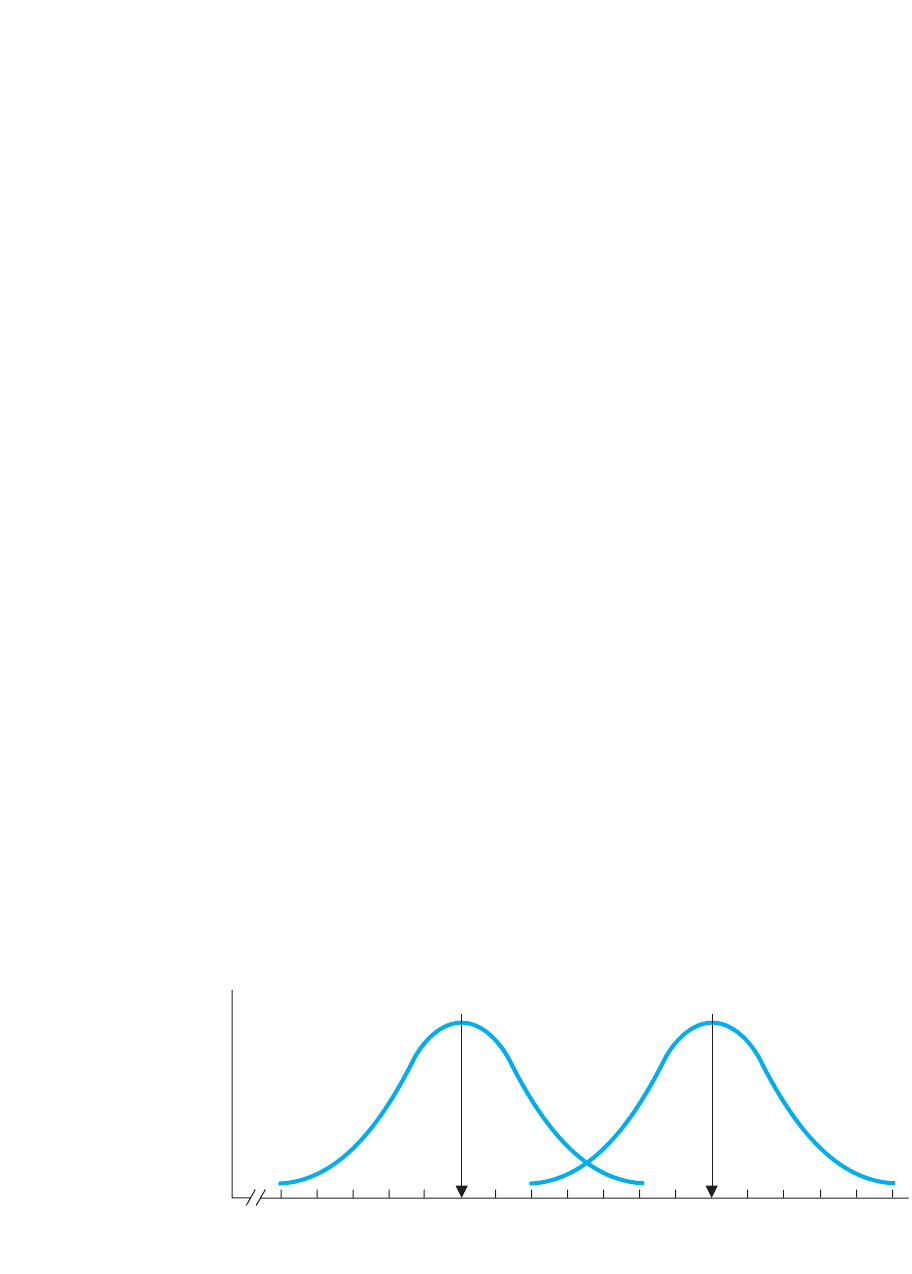
FIGURE 10.1
Relationship in the
population if the IQ pill
increases IQ scores
We will compare this population that has not taken the pill to the population that has taken
the pill that is represented by our sample. If the population without the pill has a different
than the population with the pill, then we will have demonstrated a relationship.
Creating the Statistical Hypotheses
So that we can apply statistical procedures, we translate our experimental hypotheses
into statistical hypotheses. We are still debating whether our independent variable
works, but now we state this in terms of the corresponding statistical outcomes. Statis-
tical hypotheses describe the population parameters that the sample data represent if
the predicted relationship does or does not exist. The two statistical hypotheses are the
alternative hypothesis and the null hypothesis.
The Alternative Hypothesis It is easier to create the alternative hypothesis first
because it corresponds to the experimental hypothesis that the experiment does work as
predicted. The alternative hypothesis describes the population parameters that the
sample data represent if the predicted relationship exists. The alternative hypothesis is
always the hypothesis of a difference; it says that changing the independent variable
produces the predicted difference in the populations.
For example, Figure 10.1 shows the populations we’d find if the pill increases IQ.
This shows a relationship because everyone’s IQ score is increased so that the distribu-
tion moves to the right, over to the higher scores. We don’t know how much scores will
increase, so we do not know the value of the new with the pill. But we do know that
the of the population with the pill will be greater than 100 because 100 is the of
the population without the pill.
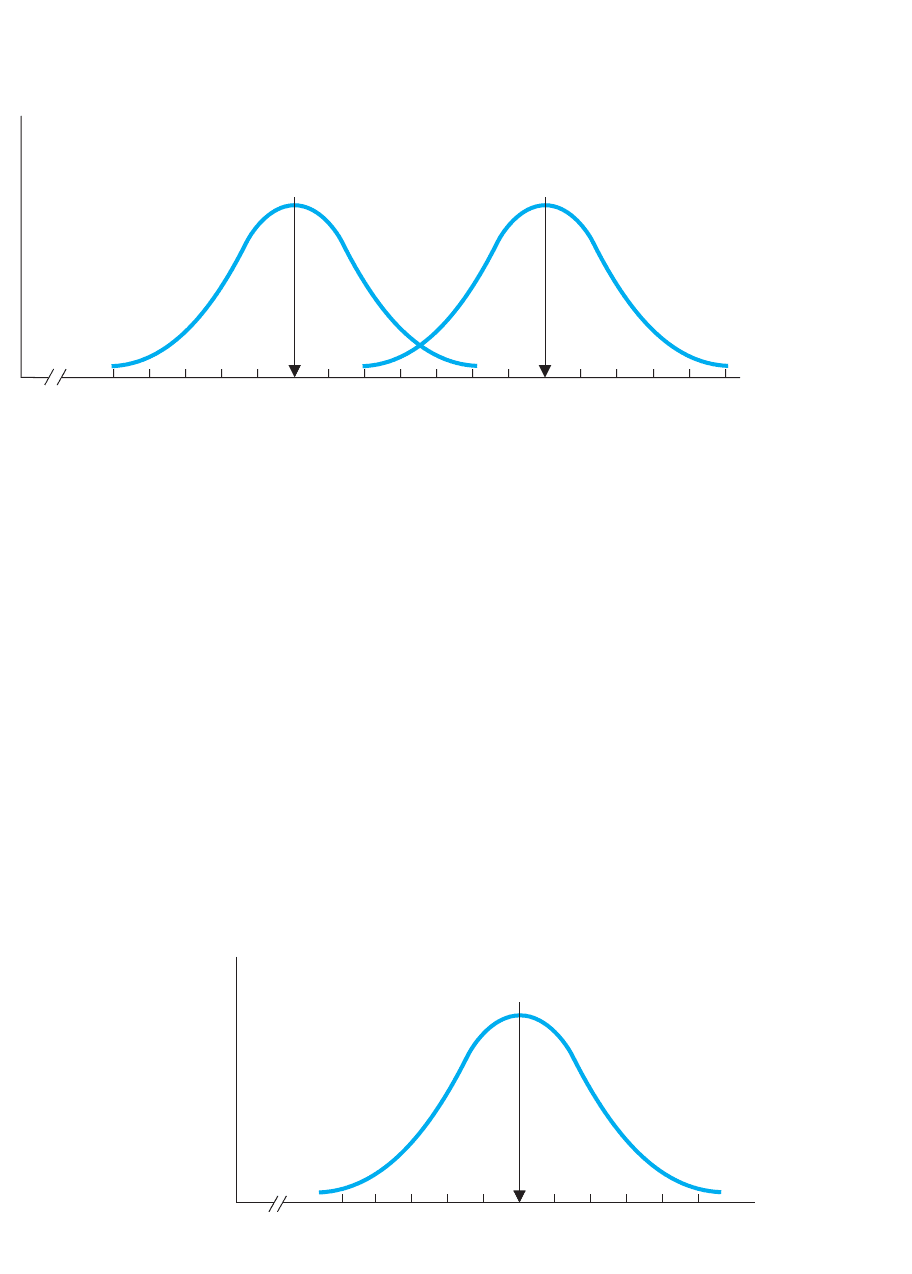
On the other hand, Figure 10.2 shows the populations if the pill decreases IQ. Here,
the pill moves the distribution to the left, over to the lower scores. Again, we don’t
know how much the pill will decrease scores, but we do know that the of the popula-
tion with the pill will be less than 100.
The alternative hypothesis is a shorthand way of communicating all of the above. If
the pill works as predicted, then the population with the pill will have a that is either
greater than or less than 100. In other words, the population mean with the pill will not
equal 100. The symbol for the alternative hypothesis is . (The stands for hypothe-
sis and the subscript a stands for alternative.) Our alternative hypothesis in this study is
H
a
: ? 100
HH
a
212 CHAPTER 10 / Introduction to Hypothesis Testing
X
Low IQ scores
IQ scores
μ
=100
f
High IQ scores
μ
<100
One pill No pill
XXXXXXXXXXXXXXXXX
FIGURE 10.2
Relationship in the population if the IQ pill decreases IQ scores
f
Low IQ scores
IQ scores
High IQ scores
XXXXXXXXXXX
μ = 100
with or
without pill
FIGURE 10.3
Population of scores if
the IQ pill does not
affect IQ scores
This proposes that the sample mean produced by our pill represents a not equal to
100. Because the without the pill is 100, implies that a relationship exists in the
population. Thus, we can interpret as stating that our independent variable works as
predicted.
The Null Hypothesis The statistical hypothesis corresponding to the experimental
hypothesis that the independent variable does not work as predicted is called the null
hypothesis. The null hypothesis describes the population parameters that the sample
data represent if the predicted relationship does not exist. It is the hypothesis of “no dif-
ference,” saying that changing the independent variable does not produce the predicted
difference in the population.
If the IQ pill does not work, then it would be as if the pill were not present. We
already know that the population of IQ scores without the pill has a of 100. There-
fore, if the pill does not work, the population of scores will be unchanged and will
still be 100. Thus, if we measured the population with and without the pill, we would
have one population of scores, located at the of 100, as shown in Figure 10.3.
H
a
H
a

Setting Up Inferential Procedures 213
The null hypothesis is a shorthand way of communicating the above. The symbol for
the null hypothesis is . (The subscript is 0 because null means zero, as in zero rela-
tionship.) The null hypothesis for the IQ pill study is
This proposes that our sample comes from and represents the population where is
100. Because this is the same population found without the pill, implies that the pre-
dicted relationship does not exist in nature (that the independent variable does not
work).
REMEMBER The alternative hypothesis says the sample data represent
a and population that reflects the predicted relationship. The null hypothe-
sis says the data represent the and population that is found when the
predicted relationship does not occur in nature.
1H
0
2
1H
a
2
H
0
H
0
: 5 100
H
0
■
The null hypothesis shows the value of that our
represents if the predicted relationship does not exist.
■
The alternative hypothesis shows the value of that
our represents if the predicted relationship does
exist.
MORE EXAMPLES
In an experiment, we compare a sample of men to the
population of women who have a of 75. We predict
simply that men are different from women, so this is
a two-tailed test. The alternative hypothesis is that
our men represent a different population, so their is
not 75; thus, . The null hypothesis is that
men are the same as women, so the men’s is also 75,
so .
For Practice
1. A ____ test is used when we do not predict the
direction that scores will change; a ____ test is
H
0
: 5 75
H
a
: ? 75
X
X
used when we do predict the direction that scores
will change.
2. The ____ hypothesis says that the sample data rep-
resent a population where the predicted relationship
exists. The ____ hypothesis says that the sample
data represent a population where the predicted
relationship does not exist.
3. The for adults on a personality test is 140. We
test a sample of children to see if they are different
from adults. What are and ?
4. The for days absent among workers is . We
train a sample of new workers and ask whether the
training changes worker absenteeism. What are
and ?
Answers
1. two-tailed; one-tailed
2. alternative; null
3.
4. H
a
: ? 15.6; H
0
: 5 15.6
H
a
: ? 140; H
0
: 5 140
H
0
H
a
15 .6
H
0
H
a
A QUICK REVIEW
The Logic of Statistical Hypothesis Testing
The statistical hypotheses for the IQ pill study are and .
Remember, these are hypotheses—guesses—about the population that our sample may
represent. Notice that, together, and include all possibilities because the after
everyone has taken the pill would either equal or not equal 100. We use inferential pro-
cedures to test (choose between) these hypotheses. (Inferential procedures are also
called statistical hypothesis testing.)
H
a
H
0
H
a
: ? 100H
0
: 5 100

214 CHAPTER 10 / Introduction to Hypothesis Testing
Say that we randomly selected a sample of 36 people, gave them the pill, measured
their IQ, and found that their mean score was 105. On the one hand, the obvious
interpretation is this: People who have not taken this pill have a mean IQ of 100, so if
the pill did not work, then the sample mean “should” have been 100. Therefore, a sam-
ple mean of 105 suggests that the pill does work, raising IQ scores about 5 points. If
the pill does this for the sample, it should do this for the population. Therefore, our
results appear to support our alternative hypothesis, : If we measured
everyone in the population with and without the pill, we would have the two distribu-
tions shown back in Figure 10.1, with the population that received the pill located at
the of 105. Conclusion: It seems that the pill works. We appear to have evidence of
a relationship in nature where increased amounts of the pill are associated with
increased IQ scores.
But hold on! Remember sampling error? We just assumed that our sample is per-
fectly representative of the population it represents. But what if there was sampling
error? Maybe we obtained a mean of 105 not because the pill works, but because we
inaccurately represented the situation where the pill does not work. Maybe the pill does
nothing, but by chance we happened to select too many participants who already had
an above-average IQ and too few with a low IQ, so that our mean is 105 instead of 100.
Thus, maybe the null hypothesis is correct. Even though it doesn’t look like it, maybe
our sample actually represents the population where is 100. Maybe we have not
demonstrated that the pill works.
In fact, we can never know whether our pill works based on the results of one study.
Whether the sample mean is 105, 1050, or 105,000, it is still possible that the sample
mean is different from 100 simply because of sampling error. As this illustrates, one
side of the debate (that we’re calling the null hypothesis) is to always argue that the
independent variable does not work as predicted, regardless of what our sample data
seem to show. Instead, it is always possible that the data poorly represent the situation
where the predicted relationship does not occur in nature.
REMEMBER The null hypothesis always implies that if our sample data show
the predicted relationship, we are being misled by sampling error and there
really is not that relationship in nature.
Thus, we cannot automatically infer that the relationship exists in the population
when our sample data show the predicted relationship because two things can pro-
duce such data: sampling error or our independent variable. Maybe is correct
because sampling error produced our sample data, the independent variable really
does not work as predicted, and thus the we’re representing is 100. Or maybe is
correct because a relationship in nature produced our sample data, so we can believe
that the independent variable does work as predicted, and thus the we’re represent-
ing is not 100.
The only way to resolve this dilemma for certain would be to give the pill to the
entire population and see whether was 100 or 105. We cannot do that so we can never
prove whether the null hypothesis is true. However, we can determine how likely it is to
be true. That is, we can determine the probability that sampling error would produce a
sample mean of 105 when the sample actually comes from and represents the popula-
tion where is 100. If such a mean is very unlikely, we’ll reject the that our sample
represents this population.
If this sounds familiar, it’s because it is the procedure discussed in the previous
chapter. In fact, that procedure is a parametric inferential procedure called the z-test.
H
0
H
a
H
0
H
a
: ? 100
Performing the z-Test 215
PERFORMING THE z-TEST
The z-test is the procedure for computing a z-score for a sample mean on the sampling
distribution of means. The formula for the z-test is the formula we used in Chapters 6
and 9 (and we’ll see it again in a moment). The z-test is used in a one-sample experi-
ment when we can meet these four assumptions:
1. We have randomly selected one sample.
2. The dependent variable is at least approximately normally distributed in the popu-
lation, and involves an interval or ratio scale.
3. We know the mean of the population of raw scores under some other condition of
the independent variable.
4. We know the true standard deviation of the above population.
Say that from past research, we know that in the IQ population where is 100, the
standard deviation is 15. Therefore, the z-test is appropriate for our study.
REMEMBER The z-test is used only if the raw score population’s is
known.
Setting Up the Sampling Distribution for a Two-Tailed Test
We always test by examining the sampling distribution created from the raw score
population that says we are representing. Here says that the sample represents a
population with . Therefore, it is as if we again hired our (very) bored statisti-
cian. Using the of 36 that we used, she infinitely samples the raw score population of
IQ scores without the pill where is 100. This produces a sampling distribution of
means with a of 100, as in Figure 10.4. Notice, the of the sampling distribution
always equals the value of given in the null hypothesis.
REMEMBER The mean of the sampling distribution always equals the of
the raw score population that says we are representing.
A sampling distribution always describes the situation when is true. Here it shows
the sample means that occur when we are drawing samples from the IQ population
where is 100. Any sample mean not equal to 100 occurs solely because of sampling
error—the luck of the draw that produced an unrepresentative sample. Thus, you can
H
0
H
0
N
5 100
H
0
H
0
H
0
σ
X
1σ
X
2
X
f
μ
X X X X X
100
X
X X X X X
–3 –2 –1
0+3+2+1
Region of rejection
equals 2.5%
Region of rejection
equals 2.5%
Sample means
z-scores
z
crit
= –1.96 z
crit
= +1.96
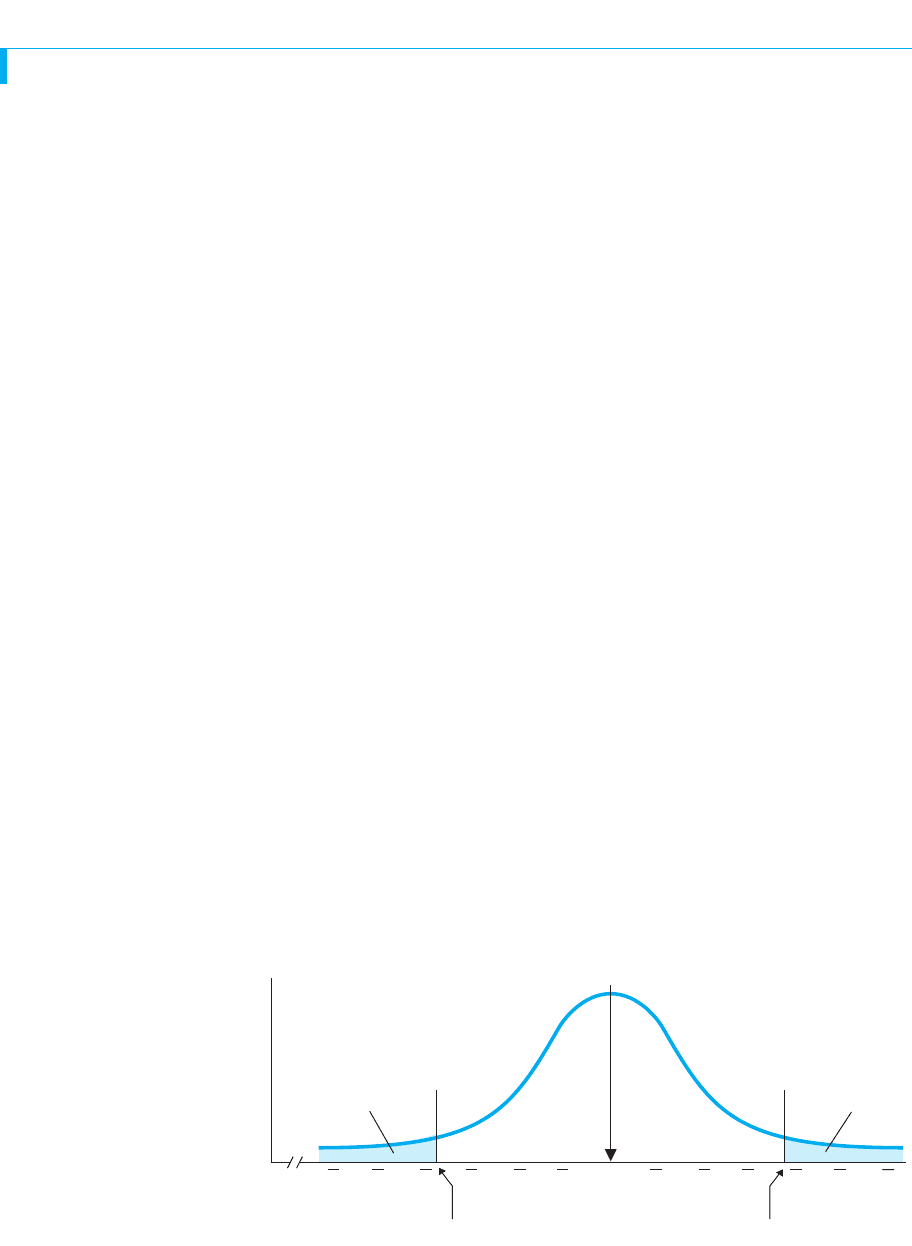
FIGURE 10.4
Sampling distribution of
IQ means for a two-tailed
test
A region of rejection is in
each tail of the distribution,
marked by the critical values
of 1.96;

216 CHAPTER 10 / Introduction to Hypothesis Testing
think of the sampling distribution as showing the frequency of all s we might get
through sampling error when the pill doesn’t work. (Always add the phrase “when
is true” to any information you get from a sampling distribution.)
Next we set up the sampling distribution as we did in the previous chapter: Deter-
mine the size and location of the region of rejection and then identify the critical value.
However, we have some new symbols and terms.
1. Choose alpha: Recall that the criterion probability defines sample means as being
too unlikely to represent the underlying raw score population, which in turn
defines the size of the region of rejection. The symbol for the criterion probability
is , the Greek letter alpha. Usually the criterion is , so in code, a .
2. Locate the region of rejection: Recall that the region of rejection may be in both
tails or only one tail of the sampling distribution. To decide, consider your
hypotheses. With our pill, we created two-tailed hypotheses for a two-tailed test
because we predicted the pill might raise or lower IQ scores. We will be correct if
our sample mean is either above 100 or below 100 and we can reject that it repre-
sents the no-pill population. Thus, back in Figure 10.4, with a two-tailed test, we
placed a region of rejection in each tail.
3. Determine the critical value: We’ll abbreviate the critical value of as . With
, the total region of rejection is , of the curve, so the region in each tail
is of the curve. From the z-table, a z-score of 1.96 demarcates this region,
and so we complete Figure 10.4 by adding that is .
Now the test of boils down to comparing the z-score for our sample mean to the
of . Therefore, it’s time to compute the z-score for the sample.
Computing z
Here is some more code. The z-score we compute is “obtained” from the data, so we’ll
call it obtained, which we abbreviate as . You know how to compute this from pre-
vious chapters.
z
obt
z
;1.96z
crit
H
0
;1.96z
crit
.025
.05␣ 5 .05
z
crit
z
␣ 5 .05.05␣
H
0
X
First, we compute the standard error of the mean In the formula, is the num-
ber of scores in the sample and is the true population standard deviation. For our IQ
pill study, is 15 and is 36, so
σ
X
5
σ
X
1N
5
15
136
5
15
6
5 2.50
Nσ
X
σ
X
N1σ
X
2
The formula for the z-test is
where
σ
X
5
σ
X
1N
z
obt
5
X 2
σ
X

Performing the z-Test 217
Next we compute . In the formula, the value of is the of the sampling distri-
bution, which is also the of the underlying raw score population that says the sam-
ple represents. The is computed from our sample. The is the standard error of the
mean. Thus, our , , and , so
Our is .
.
The final step is to interpret this by comparing it to .
Comparing the Obtained z to the Critical Value
Figure 10.5 shows the location of our (and sample mean) on the sampling distribu-
tion. Remember that the sampling distribution describes the situation when is true:
Here it shows all possible means that occur when, as our claims happened to us, sam-
ples are drawn from the population where is 100. If we are to believe , the sampling
distribution should show that a mean of 105 occurs relatively frequently and is thus
likely in this situation. However, Figure 10.5 shows just the opposite.
A of tells us that the bored statistician hardly ever obtained a sample mean
of 105 when drawing samples from the population where is 100. This makes it diffi-
cult to believe that our sample came from this population. In fact, because a of
is beyond the of , our sample is in the region of rejection. Therefore, we con-
clude that our sample is unlikely to have come from and represent the population where
, rejecting that our sample is poorly representing this population.
In statistical terms, we have “rejected” the null hypothesis. If we reject , then we
are left with , and so we “accept .” Here, is , so we accept that our
sample represents a population where is not 100. Thus, in sum, we have determined
that the sample is unlikely to represent the population where is 100, so we conclude
that it is likely to represent a population where is not 100.
REMEMBER When a sample statistic falls beyond the critical value, the sta-
tistic lies in the region of rejection, so we reject and accept .
Once we have made a decision about the statistical hypotheses , we then
make a decision about the corresponding original experimental hypothesis. We rejected
, so we will also reject the experimental hypothesis that our independent variable doesH
0
1H
0
and H
a
2
H
a
H
0
? 100H
a
H
a
H
a
H
0
5 100
;1 .96z
crit
12z
obt
12z
obt
H
0
H
0
H
0
z
obt
z
crit
z
obt
12 .00z
obt
z
obt
5
X 2
σ
X
5
105 2 100
2.5
5
15
2.5
512.00
σ
X
5 2.50 5 100X 5 105
σ
X
X
H
0
z
obt
z
crit
= –1.96 z
crit
= +1.96
z
obt
= +2.00
(X = 105)
X
f
μ
X X X X X
100
X
X X X X X
–3 –2 –1
0+3+2+1
Sample means
z-scores
FIGURE 10.5
Sampling distribution
of IQ means
The sample mean of 105 is
located at 2.00 z
obt
51