Heard D.E. (editor) Analytical Techniques for Atmospheric Measurement
Подождите немного. Документ загружается.


428 Analytical Techniques for Atmospheric Measurement
When driven by solar radiation, this mechanism produces O
3
P atoms about five to ten
times faster than O
1
D (Table 9.1). In the troposphere, however, only the formation
of O
1
D is relevant. The reaction of O
1
D with water vapour produces the important
atmospheric OH radicals (see Section 9.1.1), whereas tropospheric O
3
P atoms are
converted back completely to ozone via reaction R 9.2, resulting in a do-nothing cycle.
The photolysis frequency for O
3
→ O
1
D is generally called jO
1
D. It has been
measured in various tropospheric field experiments by chemical actinometers, which
are listed in Table 9.3. The measurement of jO
1
D by chemical actinometry involves
the difficult task of detecting extremely reactive O
1
D atoms. A suitable scheme is the
scavenging of O
1
D by N
2
O and measurement of the resulting reaction products (Bahe
and Schurath, 1978; Dickerson et al., 1979):
O
1
D +N
2
O −→ N
2
+O
2
(R 9.11a)
−→ NO+NO (R 9.11b)
The resulting NO, however, is not stable and is converted into higher oxides by reactions
with excess ozone:
NO +O
3
−→ NO
2
+O
2
(R 9.12)
NO
2
+O
3
−→ NO
3
+O
2
(R 9.13)
NO
2
+NO
3
+M N
2
O
5
+M (R 9.14)
The O
1
D production rate can be quantified from measurements either of N
2
or of the
nitrogen oxides, NO
y
=NO, NO
2
,NO
3
,N
2
O
5
(Table 9.3). In any case, the branching ratio
k
a
/k
b
must be accurately known, with k
a
and k
b
being the bimolecular rate constants
for reactions R 9.11a and R 9.11b, respectively. Furthermore, if NO
y
is measured, its
chemical yield per initially formed NO molecule must be known. With this information
the photolysis frequency can be determined as
jO
1
D =
1 +
k
b
k
a
1
O
3
N
2
t
(9.25)
or
jO
1
D =
1
2
1 +
k
a
k
b
1
1
O
3
NO
y
t
(9.26)
Published measurements of k
b
/k
a
+k
b
have been critically evaluated by Cantrell et al.
(1994), who recommend a value of 061 ±008 (95% confidence interval). This value
was adopted by IUPAC (Atkinson et al., 2004) and agrees within the uncertainty also
with the current recommendation of 0.58 by NASA-JPL (Sander et al., 2003). The value
by Cantrell et al. (1994) corresponds to k
a
/k
b
= 064, which may be compared with the
data used by different research groups for their chemical actinometers (Table 9.3). The
error of the ratio is usually the dominating uncertainty in the measurement of j(O
1
D) by
chemical actinometry, which has a total uncertainty of about ±(10–15)%.
Measurement of Photolysis Frequencies in the Atmosphere 429
When jO
1
D is determined from NO
y
measurements, an additional error arises from
the determination of , which has to be calibrated individually for each chemical
actinometer. The calibration can be performed by adding a known amount of NO to the
actinometer gas flow at the entrance of the photolysis reactor and measurement of the
corresponding increase of the NO
y
signal.
The photolysis of ozone to O
1
D atoms is a process with a pronounced temperature
dependence. In order to measure representative jO
1
D values, it is therefore necessary
to operate the chemical actinometer at ambient temperature. If the actinometer gas is
not in thermal equilibrium with the surrounding atmosphere, temperature corrections
have to be applied to the jO
1
D data. See Section 9.5.4 for a discussion of the expected
temperature dependence.
Static ozone actinometers use the measurement of N
2
as a proxy for O
1
D. This concept
has the advantage that nitrogen is a stable compound which undergoes no further
chemical reactions. A disadvantage is the limitation of the N
2
detection by spurious
background signals which are caused by possible air leaks in the instrumental setup,
or by N
2
contaminations in the bottled gases from which the actinometer mixture is
prepared. Typical background levels of 1–3 ppmv N
2
have been reported for the chemical
actinometers listed in Table 9.3. In order to achieve sufficiently high N
2
concentra-
tions that exceed the background significantly by photolysis, relatively high initial ozone
concentrations and long irradiance times have to be applied. For example, given a
photolysis frequency of jO
1
D = 3×10
−5
s
−1
(a typical clear-sky value at overhead sun
and 300 DU of total ozone) and an exposure time of 30 minutes, 2 hPa O
3
in an excess
of N
2
O will produce approximately 40 ppmv N
2
at 1 atm of total pressure.
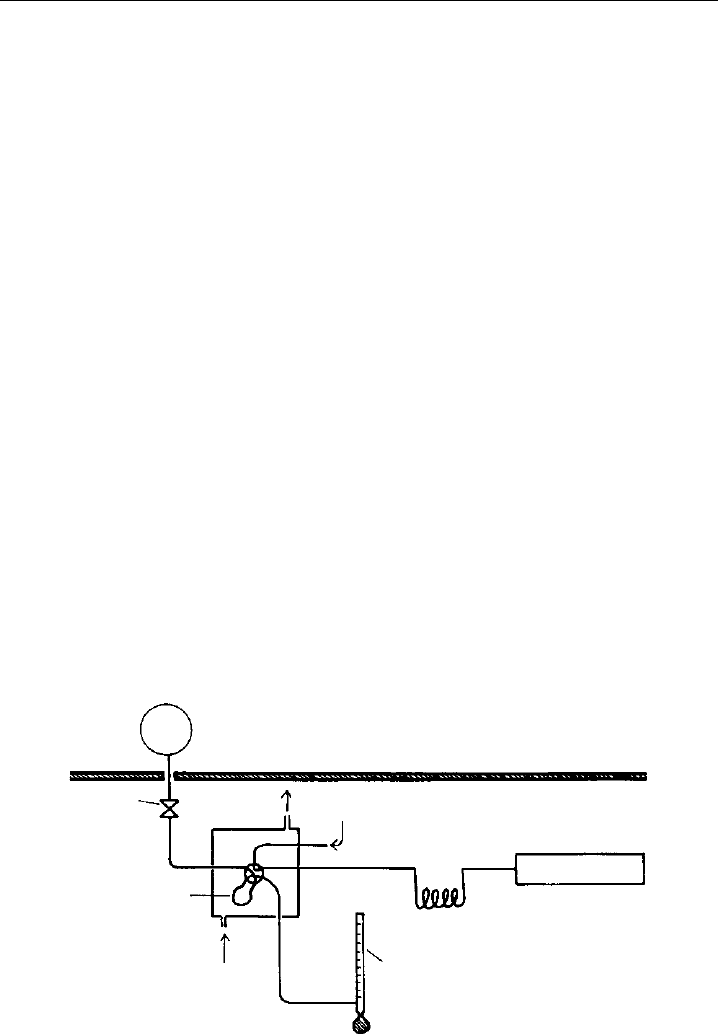
An example for a static actinometer is shown in Figure 9.10 (Bahe & Schurath, 1978;
Bahe et al., 1979). A quartz bulb (∼7cm dia.) was filled with a mixture of about 13 hPa
O
3
and 1.5–3 atm N
2
O. After exposure to solar radiation, gas samples were drawn from
Quartz actinometer
(pressurized)
He carrier gas
Needle
valve
Sampling
loop
He purge
gas
Flow meter
GC column
GC detector
Figure 9.10 Schematic of a chemical actinometer system for measurement of the photolysis frequency
of O
3
. In the quartz reactor a gas mixture of N
2
O and O
3
is exposed to solar radiation. After exposure the
amount of photolytically formed N
2
is analysed by gas chromatography (GC) (from Bahe and Schurath,
1978, used with permission of Birkhäuser/Springer).

430 Analytical Techniques for Atmospheric Measurement
the reactor for N
2
analysis with a gas chromatographic system. The data were evaluated
following Equation 9.25, but corrections ∼50% had to be applied since the actinometer
was not optically thin and the ozone concentration was not stable. About 50% O
3
loss
within 1 hour of exposure was caused by photolysis and O
3
consumption by the reaction
with O
3
P atoms:
O
3
P +O
3
−→ O
2
+O
2
(R 9.15)
The concept by Bahe et al. (1979) was improved by reducing the initial O
3
concentrations
∼2 hPa to ensure optically thin conditions (Junkermann et al., 1989; Müller et al., 1995).
Furthermore, the O
3
losses during sun exposure were reduced by addition of 100 hPa
O
2
(Müller et al., 1995). While the O
2
removes a few per cent of O
1
D by collisional
deactivation, it has the advantage to recycle all O
3
P atoms back to O
3
(via R 9.2),
reducing the effective loss of O
3
to about 10% per hour. This technique has been applied
successfully for calibration of jO
1
D filter radiometers (see Section 9.5.4), but owing to
its poor time resolution it is less useful for extensive atmospheric field measurements.
Flowing ozone actinometers use online methods with high sensitivity for NO
y
detection,
which has several advantages. First, the high sensitivity allows to measure much
smaller product yields than has been possible with N
2
detection, reducing the necessary
measurement time for jO
1
D to less than a minute (Table 9.3). Second, the online mode
enables continuous measurements, which makes them ideal for atmospheric field exper-
iments over extended time periods. Third, small flow tube diameters (typically 1–2 cm)
and relative low ozone concentrations provide optically thin conditions which require no
corrections in the derived j-values.
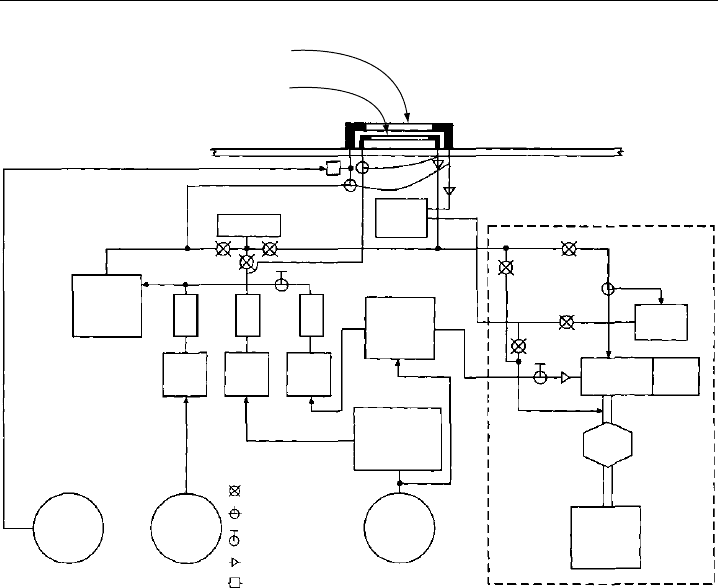
An example of a chemical actinometer developed for airborne operation is shown
schematically in Figure 9.11 (Dickerson et al., 1982). Two flow reactors, one for O
3
photolysis and one for NO
2
photolysis, are mounted atop the aircraft with free view of
the sky. The reactors are supplied with gas mixtures prepared online from stored gases
(NO, N
2
O, O
2
). For the determination of jO
1
D, a flow of oxygen is ozonized and mixed
with a larger flow of N
2
O, providing about 2000 ppmv of ozone, which is passed through
the photolysis reactor. The resulting NO
y
is reduced catalytically to NO by passing the
gas over heated Palladium at 650
C, which also destroys the remaining ozone. The NO is
then measured by a chemiluminescence detector. Care had to be exercised in the choice
of the catalyst to avoid conversion of N
2
O into NO (Dickerson et al., 1979). The efficiency
of the NO retrieval from NO
y
is calibrated by injection of a known flow of a standard
NO gas mixture upstream of the reactor inlet.
Following the concept by Dickerson et al. (1982), other O
3
actinometers were developed,
but with major modifications in the NO
y
detection. Blackburn et al. (1992) passed the
gas mixture after its exposure through liquid methanol, where NO
3
and N
2
O
5
react with
traces of water to form nitric acid. The resulting change in electrical conductivity was
calibrated and used to quantify the NO formation in the actinometer. Bairai and Stedman
(1992) operated their chemical actinometer with much less ozone ∼5 ppmv, resulting
in conversion of NO into NO
2
without significant production of higher oxides. The NO
2
was then measured by detection of the chemiluminescence produced during the reaction
of NO
2
with a luminol solution. In the actinometer developed by Shetter et al. (1996),
the NO is converted mostly into N
2
O
5
, which is then transferred through a permeable
Measurement of Photolysis Frequencies in the Atmosphere 431
FM FM FM
FC FC FC
RXN
chamber
Ozonizer
Quartz flow reactors (2x)
O
3
→ O(
1
D)
NO
2
→ NO
Pressure
Bulkhead
PMT
NO
2
conv.
650°
conv.
Vacuum
pump
Ozone
detector
O
2
tank
O
3
killer
N
2
O
tank
50 ppm
NO
tank
NO
x
Analyzer
NO
2
permeation
oven
Solenoid
Manual shutoff
3-Way solenoid
Capillary
Frit
Figure 9.11 Schematic of an airborne chemical actinometer for measurement of photolysis frequencies.
Two photolysis flow reactors, one for O
3
and one for NO
2
, are mounted atop the aircraft with free view
of the sky. NO is photolytically formed in both actinometers and is measured by an NO
x
analyser that
takes alternatingly samples from one or the other reactor. Abbreviations used: FC, flow controller; FM,
flow meter; Conv., conversion of nitrogen oxides into NO; RXN, reaction chamber; PMT, photomultiplier
tube (adapted from Dickerson et al., 1982, printed with permission from American Geophysical Union).
Nafion® membrane into liquid water. The increase in electrical water conductivity due
to formation of nitrate ions is then measured to quantify the initially formed NO.
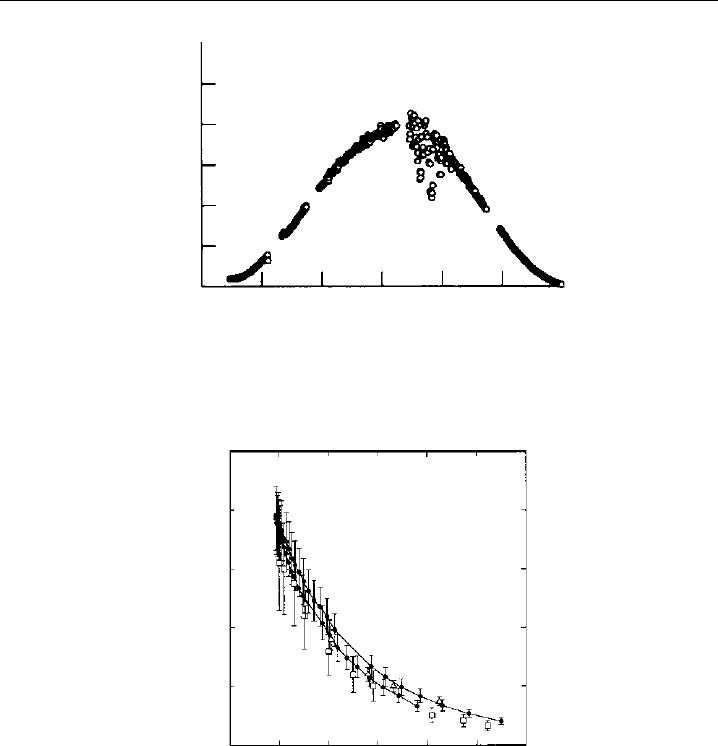
Measurement examples are shown in Figures 9.12 and 9.13. The first figure displays a
typical diurnal profile, which was measured by a chemical flow actinometer during a field
experiment on Mauna Loa in 1992 (Shetter et al., 1996). Smooth jO
1
D variations under
almost cloudless sky can be seen in the morning and late afternoon, demonstrating a high
measurement precision. The fluctuations occuring in the early afternoon were caused by
clouds that influenced the solar actinic flux. The general shape of the diurnal profile is
determined mainly by the jO
1
D dependence on the slant ozone column t
O
3
/ cos ,
which effectively absorbs solar radiation at wavelengths below 320 nm (see Section 9.1.6
and Figure 9.3). Examples of the functional dependence of jO
1
D on atmospheric ozone,
measured at different ground-based locations, are shown in Figure 9.13. Good agreement
of the clear-sky data is found within the errors associated with each measurement
technique. For further comparisons of published jO
1
D data, see Hofzumahaus et al.
(1992) and Kraus and Hofzumahaus (1998).
432 Analytical Techniques for Atmospheric Measurement
Time (HST)
j (O
1
D) (10
–5
s
–1
)
6
5
4
3
2
1
0
6 8 10 12 14 16 18
Figure 9.12 Diurnal variation of jO
1
D measured by a chemical actinometer at the NOAA Mauna Loa
Observatory on the island of Hawai, on 3 May, 1992 (adapted from Shetter et al., 1996, printed with
permission from American Geophysical Union).
200 400 600 800
0
1
2
3
4
5
Slant ozone column (DU)
j (O
1
D) (10
–5
s
–1
)
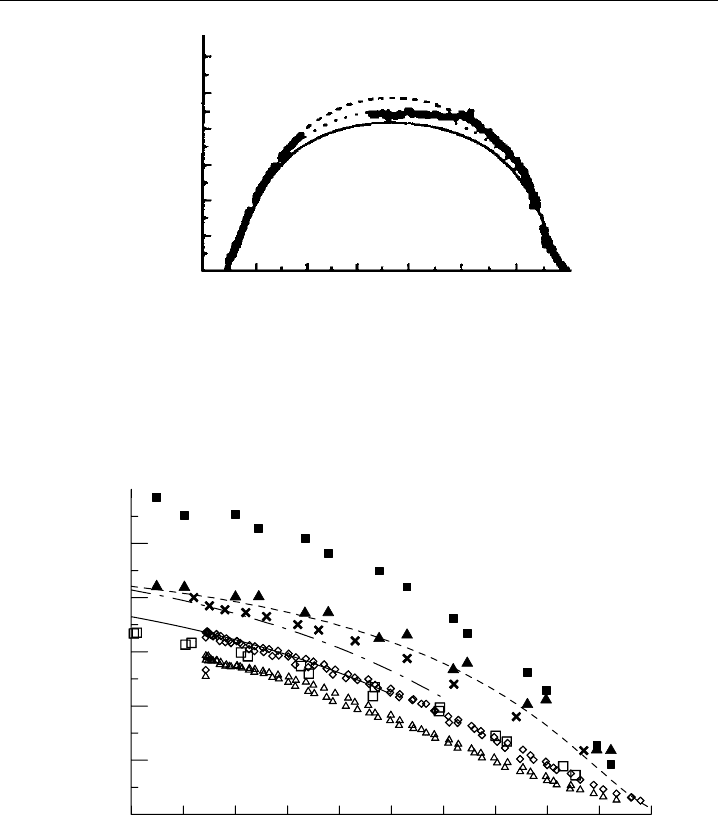
Figure 9.13 Dependence of jO
1
D on the slant ozone column. Data are from: • Mauna Loa on 6 May,
1992, measured by a chemical actinometer (Shetter et al., 1996); Atlantic Ocean 28
N 30
W on
24 September, 1988, measured by a calibrated filter radiometer (Hofzumahaus et al., 1992); Denver,
Colorado, measured by chemical actinometer on 18 May, 1991 (Bairai and Stedman, 1992) (adapted
from Shetter et al., 1996, printed with permission from American Geophysical Union).
9.3.5 Nitrogen-dioxide chemical actinometers
The photodissociation of NO
2
has one energetically allowed pathway in the troposphere,
which exhibits only a weak temperature dependence (Shetter et al., 1988).
NO
2
+h < 420 nm −→ NO +O
3
P (R 9.3)
Since the photolytical loss of NO
2
is directly related to the primary NO formation, the
photolysis frequency jNO
2
can be determined either from the measured loss rate of NO
2

Measurement of Photolysis Frequencies in the Atmosphere 433
or from the rate of NO production. However, secondary reactions of the O
3
P atoms
must be taken into account in the evaluation of the jNO
2
data.
The O-atom chemistry is a function of the operating conditions of the chemical
actinometer and must be analysed for each experimental setup. In a system of pure NO
2
(or NO
2
mixed in N
2
), O
3
P will react at low pressure primarily with NO
2
and produce
another NO molecule:
O
3
P +NO
2
−→ NO+O
2
(R 9.16)
Thus, the effective NO yield per absorbed photon is two. This condition has been realised
in a chemical actinometer, for example, by Parrish et al. (1983), who photolysed 30 ppmv
NO
2
in 60 hPa ultrapure nitrogen.
When the N
2
pressure is increased, side reactions start to compete with R 9.16 and
reduce the effective yield of NO:
O
3
P +NO
2
+N
2
−→ NO
3
+N
2
(R 9.17)
NO
3
+NO −→ NO
2
+NO
2
(R 9.18)
O
3
P +NO +N
2
−→ NO
2
+N
2
(R 9.19)
At a total pressure of 1 atm N
2
, the NO yield reaches a value of 161 ±007 for a range
of initial concentrations of 1–4 ppmv NO
2
and 0–0.3 ppmv NO (Zafonte et al., 1977).
The yield is additionally influenced by trace amounts of O
2
, which may be present as a
contaminant in the nitrogen supply. A modified value of 169±008 was estimated for
an impurity of 0.5 ppmv O
2
in 1 atm N
2
(Dickerson and Stedman, 1980).
Another approach to perform NO
2
actinometry involves the addition of a large amount
of oxygen or air to the actinometer. At sufficiently high pressure, for example 1 atm,
nearly all O
3
P atoms are converted into O
3
by R9.2. When the actinometer conditions
are chosen properly, for example when the time between formation and analysis of NO
is short, the influence of consecutive O
3
reactions like R9.12 can be neglected and the
effective NO yield becomes unity (Harvey et al., 1977; Shetter et al., 1992).
Static nitrogen-dioxide actinometers generally use pure NO
2
(1–5 hPa) as actinometer
gas (Table 9.4). During photolysis the NO
2
decay over time is either monitored directly
by photometric measurements (Bahe et al., 1980; Schultz et al., 1995) or derived indirectly
from the pressure increase associated with the NO
2
photodecomposition in the sealed
actinometer cell (Madronich et al., 1983, 1985). The primary photodissociation R9.3
followed by R9.16 results in the net reaction
2NO
2
+h −→ 2NO +O
2
(R 9.20)
Considering the stoichiometry of this reaction, Equation 9.24 can be modified to calculate
jNO
2
from the NO
2
concentration measured before t = 0 and after t = t light
exposure:
jNO
2
=−
1
2t
ln
NO
2
t
NO
2
t=0
(9.27)

434 Analytical Techniques for Atmospheric Measurement
Equation 9.27 is only accurate when low NO
2
pressures are used. At high concentra-
tions, NO
2
produces significant amounts of the dimer N
2
O
4
in a temperature-dependent
equilibrium:
NO
2
+NO
2
+M N
2
O
4
+M (R 9.21)
When NO
2
is photolysed, the fast equilibrium will replenish some NO
2
by thermal
decomposition of N
2
O
4
and apparently slows down the NO
2
decay. The N
2
O
4
concen-
tration that is present in the actinometer can be calculated from the equilibrium constant
K = p
2
NO
2
/p
N
2
O
4
(147 hPa at 298 K; Sander et al., 2003). At room temperature and 1 hPa
NO
2
, the fraction of N
2
O
4
is 0.7% which can be neglected. At higher NO
2
concentrations
or much lower temperatures, N
2
O
4
becomes relevant and the equilibrium R9.21 must be
explicitly taken into account in the jNO
2
evaluation (for details, see Madronich et al.,
1983).
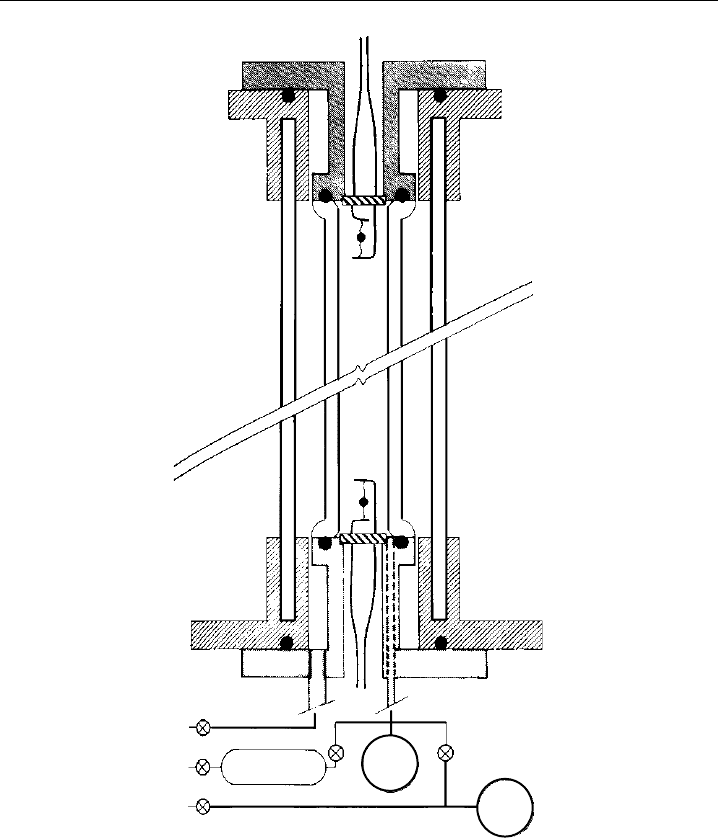
An example for a static jNO
2
actinometer, developed for measurements on a strato-
spheric balloon payload (Madronich et al., 1983, 1985), is shown in Figure 9.14. The
inner quartz cylinder serves as a photolysis cell which can be filled with NO
2
from a
reservoir, or can be pumped by a 7 litre pre-evacuated tank. The cell is equipped with
sensors for pressure and temperature and the NO
2
decay is determined from the total
pressure increase associated with R9.20. The photolysis cell is thermally isolated from the
ambient air by a second quartz cylinder, with the annulus evacuated. A cylindrical shutter
which encloses the photolysis assembly can be driven up and down for exposure of the
photolysis cell. This system is the only chemical actinometer that was deployed in the
stratosphere. The measurements, which had uncertainties of ±6% to ±15%, were used
for tests of radiative-transfer model predictions for this atmospheric regime (Madronich
et al., 1985). Other applications of static jNO
2
actinometers have involved tests and
calibrations of actinic-flux filter radiometers for tropospheric use (Schultz et al., 1995;
Volz-Thomas et al., 1996; Kraus et al., 1998). In these cases the actinometer measurements
had typical uncertainties of about ±5%.
Flowing nitrogen-dioxide actinometers use highly sensitive chemiluminescence instru-
ments for online detection of NO and NO
2
, which allows continuous measurements of
jNO
2
with high time resolution (Table 9.4). An example is the airborne actinometer
shown schematically in Figure 9.11 (Dickerson et al., 1982). For the determination of
jNO
2
, a flow of pure oxygen is doped with about 20 ppmv NO
2
from a permeation
device. The mixture is passed through a photolysis reactor mounted atop the aircraft and
is analysed after short irradiation t ∼ 1s by a chemiluminescence instrument. The
jNO
2
is then derived from the measured increase NO and the initial concentration
NO
2
0
:
jNO
2
=
1
t
NO
NO
2
0
(9.28)
Other chemical flow actinometers listed in Table 9.4 follow essentially the same principle.
Their measurement uncertainties are typically in the range between ±5% and ±12%
(e.g., Kelley et al., 1995; Lantz et al., 1996; Shetter et al., 2003).
Measurement examples are shown in Figures 9.15 and 9.16. The first figure displays
a typical diurnal profile of jNO
2
, which was measured by a chemical actinometer at
Measurement of Photolysis Frequencies in the Atmosphere 435
T
T
B3
B1
M1 M2
7L
P
B2
75 CC
Figure 9.14 Schematic of a balloon-borne chemical actinometer for measurement of the photolysis
frequency of NO
2
. In the quartz cell, pure NO
2
is photolysed by solar radiation, leading to a measurable
increase of total cell pressure. Abbreviations used: P, absolute pressure transducer; T, thermistors; B1,
B2, B3 bellows valves (closed during flight); M1, M2, latching solenoid valves; 75 cc, reservoir filled with
NO
2
; 7 L, volume evacuated before flight (from Madronich et al., 1985, with kind permission of Springer
Science and Business Media).
an observatory on Mauna Loa in 1988, and is compared with corresponding theoretical
model calculations (Shetter et al., 1992). The maximum jNO
2
value at noon is around
9 ×10
−3
s
−1
and corresponds to a photolytical NO
2
lifetime of about 1.9 minutes. The
diurnal profile of jNO
2
may be compared to the one of jO
1
D measured at the same
place and season in a different year (Figure 9.12). The jO
1
D profile is narrower, because
436 Analytical Techniques for Atmospheric Measurement
5791113151719
Time (HST)
0
4
8
12
j (NO
2
) (10
–3
s
–1
)
Figure 9.15 Diurnal variation of jNO
2
measured by chemical actinometry at the Mauna Loa Obser-
vatory on the island of Hawai, at an elevation of 3410 m, on 21 May, 1988. Experimental data are
shown as points; the curves represent theoretical model calculations assuming slightly different amounts
of albedo enhancement by clouds lying in a valley below the observation point (adapted from Shetter
et al., 1992, printed with permission from American Geophysical Union).
0
8
6
4
2
Solar zenith angle (degree)
40 60 80
j (NO
2
) (10
–3
s
–1
)
10
12
50 70
Figure 9.16 Dependence of jNO
2
on the solar zenith angle under cloud-free conditions. Data obtained
by chemical actinometry: — — Dickerson et al. (1982), × Madronich et al. (1983), - - Parrish et al. (1983),
— Müller and Schurath (1986), Shetter et al. (1992), Lantz et al. (1996); spectroradiometry: ♦
Kraus and Hofzumahaus (1998); filter radiometry: Kraus and Hofzumahaus (1998), Brauers and
Hofzumahaus (1992). Solid and dashed lines are parametrisations from original data (adapted from Kraus
and Hofzumahaus, 1998, with kind permission of Springer Science and Business Media).
it depends on radiation that is strongly absorbed by stratospheric ozone at low sun,
whereas jNO
2
is essentially independent on ozone absorption. Examples of the functional
dependence of jNO
2
on the solar zenith angle are given in Figure 9.16 displaying
observations at different ground-based locations for clear-sky conditions.

Measurement of Photolysis Frequencies in the Atmosphere 437
9.4 Actinic-flux spectroradiometry
Spectroradiometry is the measurement of absolute photon fluxes in narrow spectral
intervals at selected wavelengths (see e.g. McCluney, 1994). This task requires an optical
instrument (spectrometer) that contains three basic elements:
•
A receiver optic for radiation incident from outside.
•
A device for the spectral dispersion of radiation into different wavelengths.
•
A detection system for quantification of the dispersed light.
If a spectrometer is primarily designed and calibrated for the absolute measurement of
photon-flux densities, it is called a spectroradiometer.
A scanning spectroradiometer uses a monochromator which selects radiation in a small
spectral interval that can be scanned through the wavelength range of interest over time.
In this operational mode the radiation spectrum is measured sequentially.
A spectrograph exposes a dispersed spectrum of a whole range of wavelengths at once
to a many-element detector array, such that radiation of certain wavelengths can be
assigned to specific detector elements. In this mode of operation the radiation spectrum
is measured simultaneously.
Spectroradiometers can measure different radiometric quantities, usually irradiances
or radiances, depending on the design of the reception optics. In atmospheric physics,
spectroradiometers have been used for many decades for measuring solar UV and visible
irradiances (see Section 9.6). Only since the second half of 1990s, spectroradiometers
have been developed and used for the direct measurement of solar actinic fluxes, in
order to determine atmospheric photolysis frequencies (e.g. Müller et al., 1995; Kraus &
Hofzumahaus, 1998; Shetter & Müller, 1999; Webb et al., 2002b; Eckstein et al., 2003;
Edwards & Monks, 2003; Kanaya et al., 2003; Jäkel et al., 2005). Instruments that have
been used for field measurements are listed in Table 9.5.
9.4.1 Principle of actinic-flux spectroradiometry
Actinic-flux spectroradiometers collect incident solar radiation with isotropically sensitive
receiver optics and record the spectrum of the radiation by either a scanning double-
monochromator system or a spectrograph. A photolysis frequency can then be calculated
from the measured spectrum (cf. Equation 9.12), when three conditions are fulfilled:
1. The intensities and wavelengths of the measured radiation are absolutely calibrated.
2. The absorption spectrum and quantum yield of the relevant photolysis reaction
are accurately known.
3. The measured radiation spectrum covers the full range of wavelengths that contributes
to the photodissociation.
This concept has the important advantage that photolysis frequencies of a variety of
atmospheric gases can be obtained from the same measurement of radiation obtained by
a single instrument.