Heard D.E. (editor) Analytical Techniques for Atmospheric Measurement
Подождите немного. Документ загружается.

162 Analytical Techniques for Atmospheric Measurement
the high levels observed >20 ppt were shown to be the cause of O
3
depletion events. In
addition, BrO measurements have also been performed at mid-latitude locations such as
the Dead Sea (Hebestreit et al., 1999), a salt lake (Stutz et al., 2002), and the mid-latitude
coastal marine boundary layer (Saiz-Lopez et al., 2004). ClO has also been detected by
DOAS in a salt lake mid-latitude boundary layer (Stutz et al., 2002).
A number of iodine species have been detected in the marine boundary layer by LP-
DOAS, including IO (Alicke et al., 1999; Allan et al., 2000a), OIO (Allan et al., 2001)
and I
2
(Saiz-Lopez & Plane, 2004). Figure 3.6(a) shows a spectral fit confirming the
presence of I
2
: the grey line is the atmospheric OD spectrum after subtracting several
absorbing species (e.g. H
2
O NO
2
and OIO, but not I
2
, compared to a reference spectrum
of I
2
(black line) (Saiz-Lopez & Plane, 2004). The molecule was detected at nighttime
concentrations of up to 90 ppt together with OIO levels of 10 ppt (averaged over the
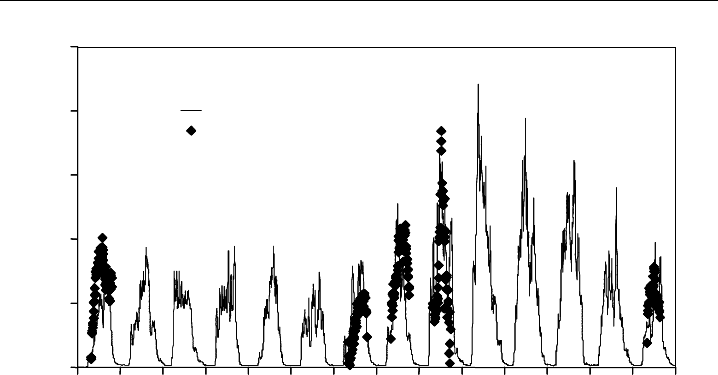
4.2 km pathlength, illustrated in Figure 3.6b). Figure 3.7 shows measurements of the IO
radical off the north coast of Tenerife, Spain, which is probably more typical of open
ocean conditions. The measurements (solid points) are compared with model predictions
of IO from a constrained model that includes a full treatment of the processing of
iodine-containing species in sea-salt aerosol (solid lines) (McFiggans et al., 2000).
Finally, commercial DOAS systems have been also routinely used in air pollution–
monitoring networks (e.g. Kourtidis et al., 2000; Xie et al., 2004). The commercial
instruments usually consist of a transmitter and a receiver telescope attached to a
computer-controlled spectrometer (Section 3.3.1.1). Because of the higher concentrations
involved when studying urban pollution, optical pathlengths of typically a few hundred
0
3
× 10
–3
–3 × 10
–3
2 × 10
–3
–2 × 10
–3
1 × 10
–3
–1 × 10
–3
Differential optical density
540 580570560550
Wavelength (nm)
Time (GMT)
(a)
(b)
100
80
60
40
20
0
8
10
12
6
4
2
0
18.00 0.00 6.00 12.00 18.00
OIO / ppt
I
2
/ ppt
0
1
2
3
4
5
Tidal Height (m)
(i) (ii)
Figure 3.6 Spectral fit and concentration profiles of I
2
. (a) The atmospheric OD spectrum (grey) is
matched to an OD reference spectrum for I
2
(black) corresponding to a retrieved concentration of
88±41 ppt. (b) The I
2
and OIO concentration profiles with the corresponding detection limits (thin black
lines) are plotted against tidal height (thick broken lines). The white and grey backgrounds indicate day
and nighttime periods, respectively. (Saiz-Lopez & Plane, 2004, reproduced with permission from the
American Geophysical Union.)
UV-Visible Differential Optical Absorption Spectroscopy 163
0
1
2
3
4
5
185 186 187 188 189 190 191 192
Julian days
193 194 195 196 197 198 199
Mixing ratio (ppt)
Predicted IO
Measured IO
Figure 3.7 Time series measurements of IO made by LP-DOAS off Tenerife, Spain. The measured
concentrations (solid points) are compared to model predictions of IO (solid lines) for a number of days
during the field campaign. (McFiggans et al., 2000, reproduced with permission from the American
Geophysical Union.)
metres are used. Generally, DOAS monitoring networks emphasise measurements of
urban pollutants such as SO
2
, NO, NO
2
,O
3
and aromatics.
3.3.2 Laser sources
3.3.2.1 OH radical measurements in the atmosphere
Hydroxyl radical has been detected in the atmosphere by optical absorption in the
A
2
+
−X
2
electronic transition around 308 nm (Perner et al., 1987; Dorn et al., 1988;
Comes et al., 1992; Mount, 1992). Because the rotational constant of OH is very large,
rotational lines in the (0,0) vibrational band can be resolved even at atmospheric pressure.
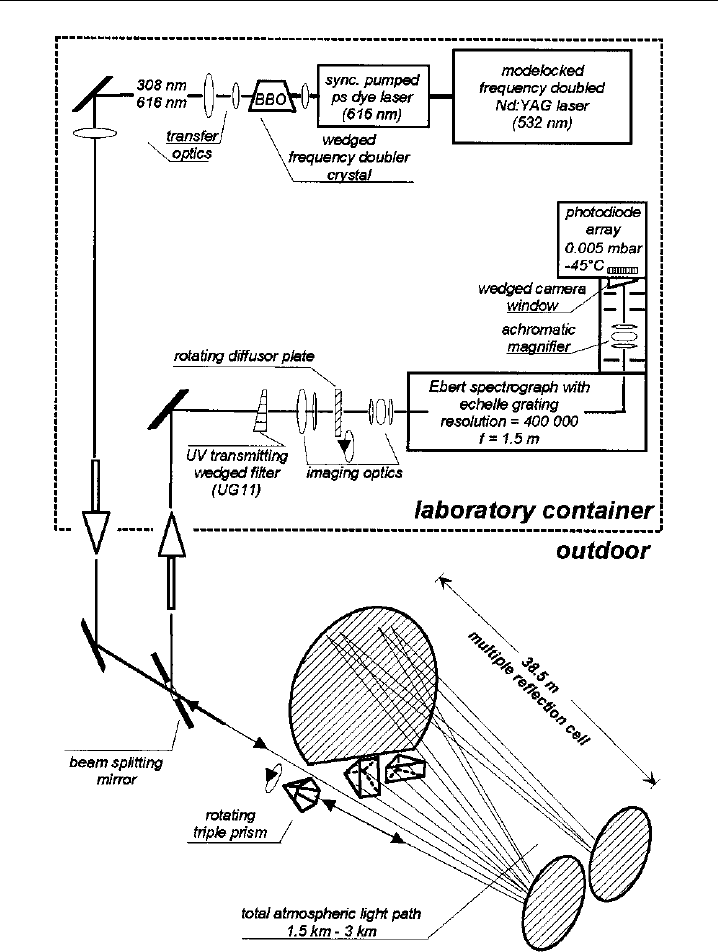
Hence, a laser can be used as the light source in a DOAS instrument, such as the example
shown in Figure 3.8 (Hausmann et al., 1997). A picosecond laser at 616 nm is frequency-
doubled to 308 nm, and spectra are recorded with a high resolution Echelle spectrograph
coupled to a PDA detector. This set-up provides simultaneous monitoring of a spectral
width of 0.26 nm, which covers a number of OH absorption lines (Figure 3.9). An open
multi-reflection or White cell (38.5 m long) is used to achieve an absorption path of more
than 3 km. This is necessary because OH has a typical daytime peak concentration of only
about 5 ×10
6
molecules cm
−3
. The OD
min
of the instrument is about 2 ×10
−4
,sothe
detection limit of OH is about 15 ×10
6
molecules cm
−3
(Hausmann et al., 1997). There
have been other laser systems used for OH detection, for example a pulsed XeCl excimer
laser covering several OH lines (Mount, 1992) and a continuous wave narrow spectral
linewidth laser which scans very rapidly over several OH rotational lines (Armerding
et al., 1996).
164 Analytical Techniques for Atmospheric Measurement
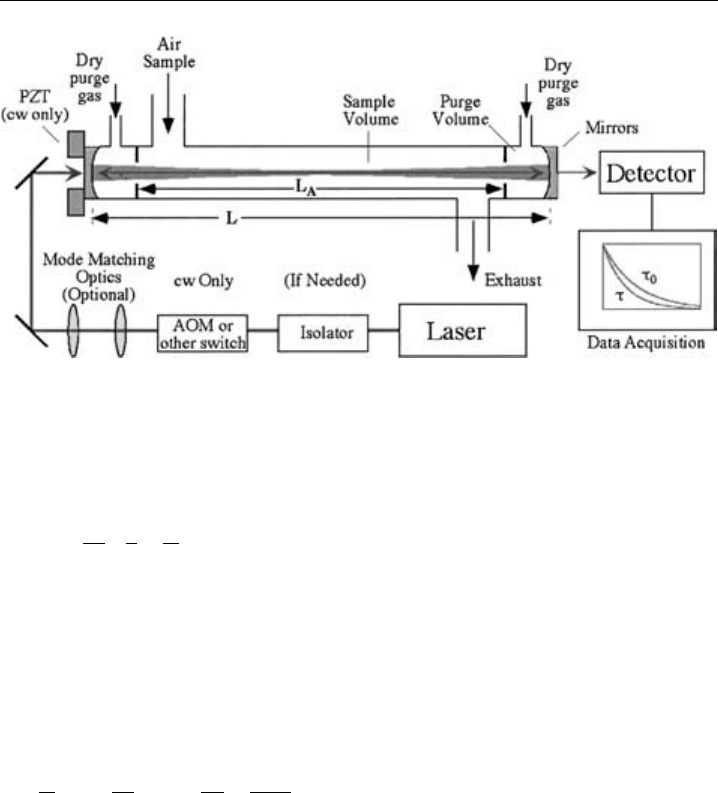
Figure 3.8 Schematic diagram of a long-path DOAS instrument employing a laser light source for
tropospheric OH detection. The instrument consists of a high resolution Ebert spectrometer-photodiode
array (PDA) detector system in combination with an open path multiple-reflection cell. (Hausmann et al.,
1997, reproduced with permission from the American Geophysical Union.)
UV-Visible Differential Optical Absorption Spectroscopy 165
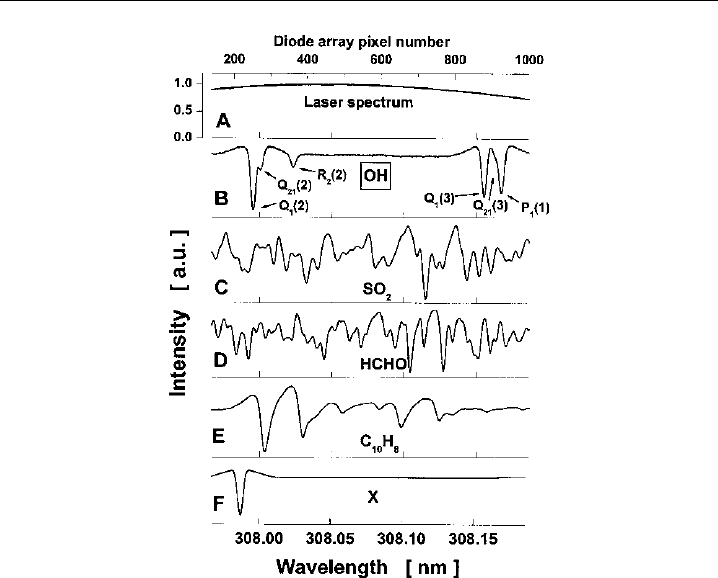
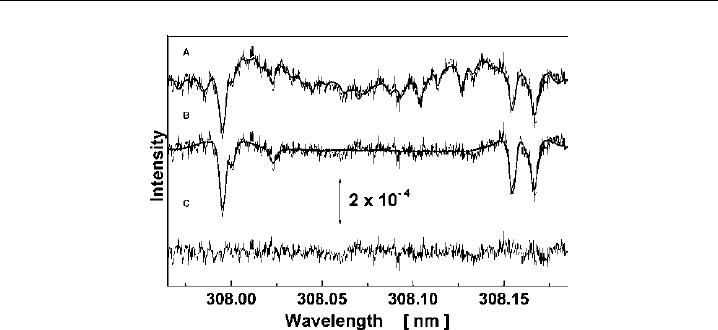
Figure 3.9 Wavelength interval used for OH tropospheric observations. The laser output spectrum,
the absorption spectrum around 308 nm of the A-X(0,0) band of OH (with individual rotational lines
identified), and the absorption spectra of other trace gases that potentially interfere in the LP-DOAS
detection of OH are plotted in panels (A) to (F), respectively. Note that the absorption band depicted in (F)
corresponds to an unidentified atmospheric component. (Dorn et al., 1996, reproduced with permission
from the American Geophysical Union.)
Note that in contrast to traditional LP-DOAS, where the retrieved concentration is
integrated over several kilometres, the multi-pass arrangement provides a measurement
integrated over a few tens of meters, which can be considered as in situ monitoring. Inter-
comparison of OH measurements by LP-DOAS and in situ laser-induced fluorescence
(LIF) systems has shown very satisfactory agreement (Hofzumahaus et al., 1998).
The spectra are analysed in a similar way to the broadband DOAS technique
(Section 3.3.1.2), as illustrated in Figure 3.9. This shows the laser output spectrum
(Panel (A)), and reference spectra for OH, SO
2
, HCHO and naphthalene (Panels (B)–(E),
respectively). Panel (F) records the absorption band of an unknown absorber. Very
precise calibrations of the reference spectra are needed because of the very narrow
wavelength interval used (307.96–308.19 nm) (Dorn et al., 1996; Mount et al., 1997;
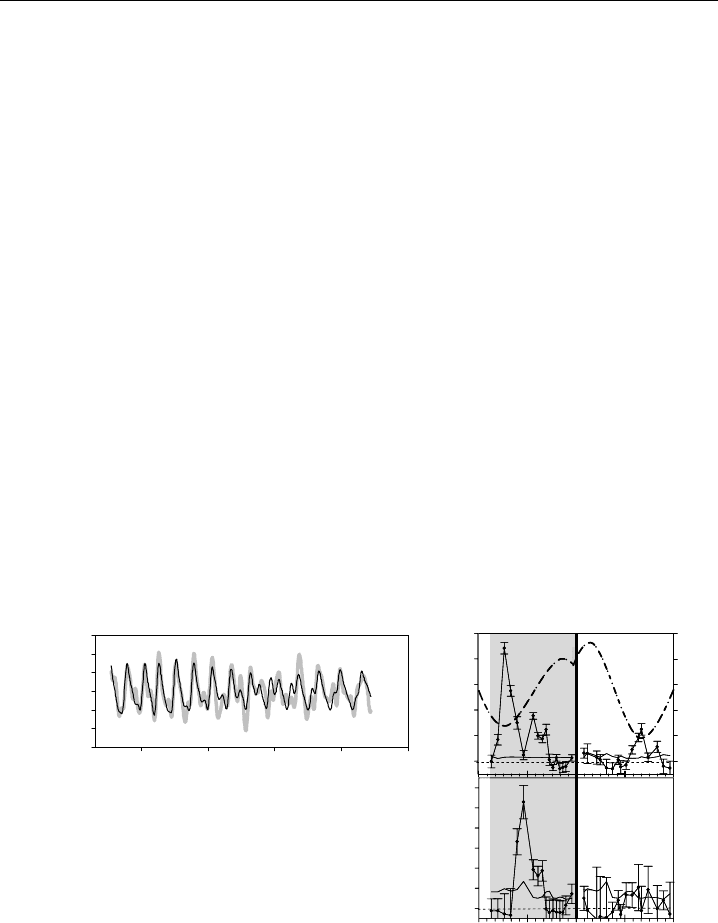
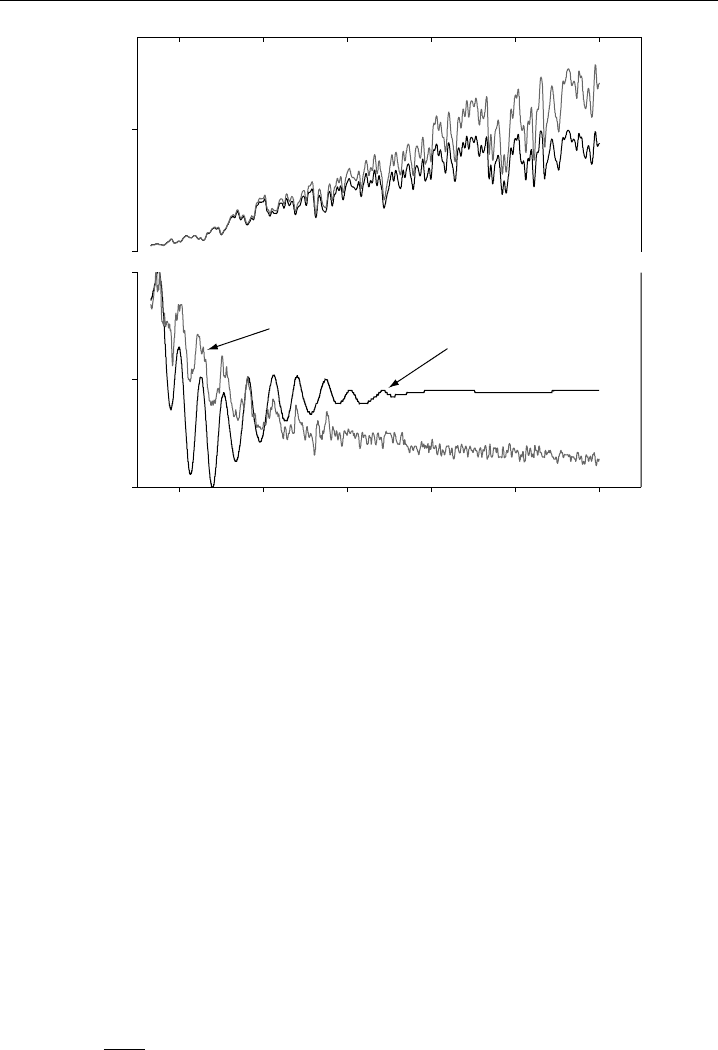
Brauers et al., 2001). Figure 3.10(A) shows an atmospheric absorption spectrum at 308 nm,
and the corresponding superimposed fitted reference spectra together with a ninth-order
polynomial. The high-order polynomial is applied to correct the laser spectral baseline
and the broadband component of the atmospheric spectrum. Figure 3.10(B) depicts the
atmospheric spectrum after subtracting all the fitted reference spectra except for OH,
166 Analytical Techniques for Atmospheric Measurement
Figure 3.10 Spectral de-convolution of OH: (A) a fit (dark line) to an atmospheric absorption spectrum
(grey line); (B) atmospheric spectrum with all species but OH fitted out (grey line), and the fitted OH
reference spectrum (dark line); (C) the residual obtained after all species are fitted and subtracted from
the atmospheric spectrum. (Dorn et al., 1996, reprinted with permission from the American Geophysical
Union.)
and Figure 3.10(C) shows the residual after subtracting all reference spectra. The OH
absorption corresponds to an optical density of 2×10
−4
, demonstrating the ability of the
DOAS system to provide in situ measurements of OH radicals.
3.3.2.2 Cavity ring-down spectroscopy
Cavity ring-down spectroscopy (CRDS) was first developed in the late 1980s (O’Keefe
& Deacon, 1988), and since then its use for laboratory and atmospheric spectroscopy
has grown substantially (Paul & Saykally, 1997; Scherer et al., 1997; Ball & Jones, 2003;
Brown, 2003). The principle of the method is based on the gradual decrease of light
intensity as a light pulse undergoes multiple reflections between two highly reflective
mirrors in an optical cell. Figure 3.11 is an illustration of a typical CRDS set-up (Brown,
2003). The laser pulse is introduced into the CRD cavity through one of the mirrors. The
intensity of light transmitted out of the cavity by leaking through the mirrors will decay
exponentially with time (Paul & Saykally, 1997; Scherer et al., 1997). This intensity is
usually measured by placing a photomultiplier, with an appropriate optical filter, on the
far side of the optical cavity from the laser. The cavity length L is the distance between
the mirrors. The transit time between the mirrors should be large compared to the laser
pulsewidth in order to discriminate discrete pulses or cavity modes inside the cell, thus
ensuring the ring-down decay is exponential. If an absorbing species is now introduced
into the cavity, then the decay in light intensity will be caused both by reflection losses
and by molecular absorption, and as a result decay will be faster. The change in time
decay can be used to measure the OD of the absorbing species (Ball & Jones, 2003;
Brown, 2003).
The time decay depends ultimately on the mirror transmission T
R
=1−R, where R is
the reflectivity of the mirrors (see Equation 3.19)). The time for the beam to traverse the
cavity is given by L/c, where c is the speed of light. For a known absorption cross-section
UV-Visible Differential Optical Absorption Spectroscopy 167
Figure 3.11 Schematic diagram of a cavity ringdown spectrometer. (Brown, 2003, reproduced with
permission from American Chemical Society.)
i
, the absorption coefficient of species i (A
i
,incm
−1
of the gas injected in the cavity
cell can then be written as:
A
i
=
R
L
c
1
−
1
0
=
i
c
i
(3.18)
where 1/ and 1/
0
are the first-order decay rates for the empty CRD cell and in the
presence of the absorbing gas of concentration c
i
, respectively. The factor R
L
is the ratio
of L to the length in the cell over which the absorbing species is present. For atmospheric
applications, extinction due to Rayleigh and Mie scattering, and absorption by other
gas-phase species, must be considered together with the losses by mirror transmission in
the definition of
0
in the absence of the target gas (Brown, 2003):
1
0
= c
⎛
⎝
T
R
L
+
R
+
M
R
L
+
i
A
i
R
L
⎞
⎠
(3.19)
where
R
and
M
are the wavelength-dependent extinction coefficients for Rayleigh and
Mie scattering, and A
i
are the absorption coefficients for the gas-phase species other than
the target compound. Hence, monitoring the CRD time decay with the empty cavity
and in the presence of the sample gas allows the measurement of the gas concentration
following the Beer–Lambert law.
Cavity ring-down spectroscopy has been used increasingly since 1990s for kinetic and
spectroscopic studies of a number of species of interest in atmospheric chemistry (Zhu
& Johnston, 1995; Atkinson & Hudgens, 1997; Newman et al., 1998, 1999; Schulz &
Simpson, 1998; Wheeler et al., 1998; Ashworth et al., 2002; Mazurenka et al., 2003; Nakano
et al., 2003). This proliferation of laboratory applications of CRDS has been due to the
high sensitivity against minimum detectable fractional absorbance per pass ∼10
−6
, and
a good time resolution 10
−6
–10
−4
s (Ball & Jones, 2003; Brown, 2003). In addition,

168 Analytical Techniques for Atmospheric Measurement
CRDS instruments have been used for field measurements of atmospheric species such
as NO
3
and N
2
O
5
(King et al., 2000; Ball et al., 2001; Brown et al., 2001; Simpson, 2003).
These nitrogen compounds are in thermal equilibrium NO
3
+NO
2
+M ↔ N
2
O
5
+M.
In order to achieve simultaneous measurements of both species, the CRDS instrument
contains two flow systems and ring-down cavities. The first flow system is kept at ambient
temperature for the detection of ambient NO
3
, whereas the second is heated up to
∼80
C to thermally decompose N
2
O
5
, therefore yielding the sum of the NO
3
and N
2
O
5
concentrations. An accurate measurement with CRDS requires a precise determination
of the empty cavity ring-down time
0
. For instance, to measure the NO
3
radical
0
includes other absorbers such as water vapour, NO
2
,O
3
and the aerosol contribution. A
measurement of
0
can therefore be obtained by titrating with NO NO
3
+NO →2NO
2
,
without affecting the concentrations of the other constituents (Brown et al., 2003).
An extension of CRDS is to use a broadband laser source (typically a dye laser with
a 20 nm bandwidth), and replace the photomultiplier with a spectrometer and a two-
dimensional CCD with fast time-clocking to record spectra with a better than 1 s time
resolution (Ball et al., 2001). Cavity ring-down absorption spectra are therefore obtained
simultaneously over a range of wavelengths, so in principle this technique combines the
advantages of CRDS with conventional DOAS. The technique has so far been employed
to detect the NO
3
radical by monitoring the spectral region between 650 and 670 nm
(Ball et al., 2001).
Finally, it should be noted that CRDS and LP-DOAS are complementary techniques
because they probe different spatial scales. The latter averages the trace gas concentration
over typically several kilometres and thus provides some degree of remote sensing, whereas
CRDS is an in situ measurement. The techniques have similar detection limits. Thus,
combining the two techniques at a field site where there is likely to be significant
heterogeneity because of local sources and sinks (e.g. in an urban environment or the
marine coastal zone) provides a very useful way of studying fast chemistry and transport.
Another new locked cavity method which offers absorbance detection limits as low
as 10
−13
has been developed. The noise-immune cavity-enhanced Optical Heterodyne
Modulation Spectrometry (NICE-OHMS) combines a high reflectivity cavity with signif-
icant noise reduction by modulation of the laser frequency (Ye et al., 1998). Although,
to date, the technique has not been applied to atmospheric measurements, its potential
capabilities have been demonstrated by detecting absorbances of ∼3 ×10
−11
from C
2
H
2
,
by using an ultra-stabilised Nd:YAG laser (Ma et al., 1999).
3.4 DOAS using scattered sunlight
The earliest spectroscopic remote sensing measurement was the observation of O
3
in the
atmosphere by Dobson and Harrison in 1926. In the mid-1970s, Noxon measured NO
2
in the upper troposphere and stratosphere by observing scattered sunlight at the zenith
(Noxon, 1975, 1976). This pioneering work was followed by a wide variety of studies
of many important atmospheric species (Noxon, 1981, 1983; McKenzie & Johnston,
1982; Solomon et al., 1987a,b; Mount et al., 1988; Pommereau & Goutail, 1988; Roscoe
et al., 1990; Smith & Solomon, 1990; Wahner et al., 1990a,b; Perner et al., 1991, 1994;
Fiedler et al., 1993; Sanders et al., 1993; Arpag et al., 1994; Pfeilsticker & Platt, 1994;

UV-Visible Differential Optical Absorption Spectroscopy 169
Pommereau & Piquard, 1994; Vanroozendael et al., 1994; Aliwell & Jones, 1996b; Aliwell
et al., 1997; Eisinger et al., 1997; Kreher et al., 1997; Platt et al., 1997; Richter et al.,
1999; Roscoe et al., 1999; Wittrock et al., 2000; Friess et al., 2001, 2004; Allan et al., 2002;
Honninger & Platt, 2002; von Friedeburg et al., 2002; Leser et al., 2003). Note that DOAS
measurements performed using lunar or stellar light are not the subject of this chapter,
but have been discussed in previous reviews of the DOAS technique (Platt, 1994; Plane &
Smith, 1995). This section contains a brief overview of the spectroscopic principles and
the main applications of scattered-sunlight DOAS, or passive DOAS.
3.4.1 Spectroscopic principles
As the source of light is now outside the earth’s atmosphere, the Beer–Lambert law
(Equation 3.1) is modified (Solomon et al., 1987a):
I
tr
= I
0
exp
−SCD
(3.20)
where SCD is the slant column density of an atmospheric species, integrated along the
path followed by solar photons through the atmosphere. If n species are present, the total
OD is given by:
OD = ln
I
0
I
tr
=
n
i=1
OD
i
=
n
i=1
i
SCD
i
(3.21)
Photons traversing the atmosphere are subject to Rayleigh and Mie scattering, and thus
wavelength-dependent extinction coefficients are introduced in the analysis in the same
manner as for the LP-DOAS technique (Section 3.2.1).
Passive DOAS spectra can therefore be analysed using the same analysis procedure as
for LP-DOAS, but there are several additional considerations when using scattered solar
radiation as the light source. The first is that the unattenuated I
0
spectrum cannot
be measured (the same applies in LP-DOAS, but boundary layer spectra can at least be
normalised by dividing by the spectrum of the lamp in the transmitter – Section 3.3.1.2).
Instead, the I
0
spectrum is usually taken as the solar spectrum when the solar zenith
angle (SZA) is at its minimum (i.e. at local noon), since the slant column through the
atmosphere is then a minimum (Noxon, 1975, 1976; Noxon et al., 1979). The objective
is to remove the Fraunhofer lines present in the solar spectrum, since these structures
correspond to up to 30% absorption, and are much larger than molecular absorption
features. Taking the ratio of the spectra at high and low SZAs largely removes the Fraun-
hofer structure, as shown in Figure 3.12. The two atmospheric scattered sunlight spectra
in Figure 3.12(a) are taken at 70
and 90
SZA, and the ratio compared to an O
3
reference
spectrum in Figure 3.12(b). This demonstrates how the strong absorption bands of O
3
become visible in the 317–335 nm region after the solar Fraunhofer structure is removed.
Another factor to consider when retrieving atmospheric species from scattered sunlight
spectra is the so-called ‘Ring effect’, named after Grainger and Ring (1962). This describes
the partial ‘filling-in’ of the Fraunhofer structures in the solar spectrum as sunlight
traverses through the atmosphere, resulting in a decrease of the ODs of Fraunhofer lines.
170 Analytical Techniques for Atmospheric Measurement
Intensity (arb. units)
0
2
Wavelength (nm)
320 330 340 350 360 370
0.0
0.5
1.0
O
3
reference
Atmospheric spectrum
a
b
Figure 3.12 Scattered sunlight atmospheric spectra: (a) atmospheric spectra taken at 70
(grey line) and
90
(solid line) SZA, showing the dominant Fraunhofer structure (the signal intensity is shown on the
left-hand axis); (b) the ratio of the atmospheric spectra in (a) (grey line) – the Fraunhofer lines largely
disappear to reveal the strong O
3
absorption bands in the region 317–335 nm, which are compared to
an O
3
reference spectrum (solid line). Note that both spectra have been normalised for comparison.
The Ring effect is most likely due to Raman scattering (Kattawar et al., 1981; Fish & Jones,
1995; Vountas et al., 1998; Sioris & Evans, 1999). The size of the Ring effect depends
strongly on SZA, with the result that at larger SZA the observed Fraunhofer lines are
weaker. Accurate removal of the Ring effect is necessary because it represents a change in
OD that can be an order of magnitude larger than that from absorption by atmospheric
trace gases. An artificially generated Ring spectrum is usually employed in the analysis
of scattered sunlight spectra (Chance & Spurr, 1997). An additional complication is that
cloudy conditions increase the optical path of scattered sunlight reaching the ground,
which can greatly enhance the Ring effect (de Beek et al., 2001).
Analysis of scattered sunlight spectra yields the SCD (Equation 3.21). However, the
vertical column density (VCD) is a more useful quantity. The conversion from SCD to
VCD is obtained by means of the so-called air mass factor (AMF) (Solomon et al., 1987a;
Perliski & Solomon, 1993):
VCD =
SCD
AMF
(3.22)
The AMF depends on the radiative transfer of the atmosphere and can be calculated
from radiative transfer models (Marquard et al., 2000; von Friedeburg et al., 2002).

UV-Visible Differential Optical Absorption Spectroscopy 171
These models must include parameters such as wavelength-dependent Rayleigh and Mie
scattering, vertical profiles of pressure, temperature and the species of interest, as well as
the SZA and azimuth angle of the receiving telescope. For SZA < 75
, the AMF is well
approximated by the simple geometrical relationship 1/ cosSZA.
3.4.2 Zenith-viewing geometry: Retrieval of NO
3
vertical
profiles
Zenith-sky spectroscopy is based on the collection of scattered photons using a zenith-
pointing telescope, from either a ground-based or airborne instrument. Although routine
monitoring of O
3
and NO
2
in the stratosphere has been conducted for many years
using zenith-pointing instruments (Noxon, 1975; Harrison, 1979; Noxon et al., 1979;
Syed & Harrison, 1980; Noxon, 1981; McKenzie & Johnston, 1982, 1983; Noxon, 1983;
McKenzie & Johnston, 1984; Mount et al., 1988; Pommereau & Goutail, 1988; Roscoe
et al., 1990; Goutail et al., 1994; Gil et al., 1996; Sarkissian et al., 1997; VanRoozendael
et al., 1997; Vaughan et al., 1997; Preston et al., 1998; Roscoe et al., 1999; Gil et al.,
2000; Liley et al., 2000), here we will focus on ground-based DOAS measurements of
NO
3
. During the night, NO
3
has been monitored using direct observations of the moon
as a light source (Noxon et al., 1978, 1980; Noxon, 1983; Sanders et al., 1987; Solomon
et al., 1989a,b; Wagner et al., 2000). Since 1990s NO
3
columns have been measured for
an hour or so before sunrise, by collecting scattered sunlight using zenith and off-axis
DOAS when the SZA is less than about 95
(Weaver et al., 1996; Aliwell & Jones, 1998;
von Friedeburg et al., 2002). In fact, NO
3
is photolysed so rapidly that the decrease in
NO
3
column as the solar terminator sweeps downward before sunrise can be used to
determine the vertical profile of the radical in the troposphere and lower stratosphere
(Smith & Solomon, 1990; Smith et al., 1993).
Figure 3.13(a) shows how NO
3
is sequentially removed by photolysis as the SZA decreases
to 90
(sunrise). The VCDs of NO
3
are derived in a similar way to the NO
3
concentrations
determined with an LP-DOAS instrument (Allan et al., 2002) (Section 3.3.1.2), where each
processed atmospheric spectrum is divided by a processed daytime reference spectrum. Note
that the lifetime of NO
3
against photolysis is only a few seconds in full sunlight, so the persis-
tence of NO
3
when SZA is less than 90
indicates a large quantity of N
2
O
5
is present. This is in
equilibrium with NO
3
NO
3
+NO
2
↔ N
2
O
5
, so the relatively slow thermal decomposition
of N
2
O
5
has the effect of delaying the disappearance of NO
3
after sunrise. This effect occurs
in semi-polluted environments with NO
2
mixing ratios above 500 ppt (Coe et al., 2002).
The generic optimal estimation method (OEM) developed by Rodgers (1976, 1990) for
solving atmospheric data inversion problems has been successfully developed to retrieve
vertical profile information of NO
3
from zenith-sky spectroscopic measurements of
column abundance made through sunrise (Coe et al., 2002). A forward model described by
the expression y =Kx predicts the column density time series, y, that would be observed
from a vertical concentration profile, x, connected through a weighting function, K. The
elements of the matrix K are the degree of photolysis of NO
3
as a function of height,
SZA and time (Coe et al., 2002). In fact, since x is unknown the forward model is
inverted to yield the backward model x = K
−1
y. The inversion process begins from an
a priori guess of the NO
3
profile x
0
; the backward model is then used to calculate an