Graziani F. (editor) Computational Methods in Transport
Подождите немного. Документ загружается.


Reflectance Modeling with Turbid Medium Radiative Transfer 193
µI
∂
∂τ
+ G (µ) I
→
I
c
(τ,µ)
=
1
−1
dµ
Γ(µ
,µ)
→
I
c
(τ,µ
)+Γ(µ
0
,µ)
1
0
e
−τ/ξ
0
→
I
c
(0,µ)=0
→
I
c
(∆, −µ)=2ρ
T
µ
0
e
−τ/ξ
0
+
1
0
dµ
µ
I
c
(∆,µ
)
1
p
T
(17)
Once (17) is solved numerically for the angular intensity, the desired quanti-
ties are the vector reflectance
R
fI
R
fQ
=
1
µ
0
1
0
dµ
µ
→
I
(0, −µ
) (18a)
as well as the degree of polarization at the top of canopy (ToC)
Dp
0
≡
1
0
dµ
µ
Q (0, −µ
) /
1
0
dµ
µ
I (0, −µ
) . (18b)
The Converged SN (CSN) Algorithm
Simplicity and versatility are the hallmarks of the discrete ordinates (SN)
numerical algorithm developed for neutron transport calculations but widely
applied in all particle transport fields. The method amounts to a convenient
bookkeeping scheme for a particle population as one sweeps in a specified
direction across the spatial domain. Of course, inherent in the method are
numerical errors resulting from the discretization of the spatial and angu-
lar domains; and as a result, the SN method has always been considered
an approximate numerical scheme. In this section, a variation of the SN al-
gorithm will be devised for radiative transfer in canopies. The methodology
couples a Romberg iterative strategy with a Wynn-Epsilon (Wε) acceleration
to generate nearly 4-place accuracy for the canopy reflectance.
SN/Romberg/Wε Theory
The method will be developed for the radiative transfer equation (17) for a
canopy slab of optical depth (LAI) ∆ and an impinging (plane) beam source
in direction µ
0
at ToC. At the bottom canopy boundary, a partially reflecting
condition is imposed possibly representing a target or soil. After inclusion of
the impinging source as a volume source, introducing the SN approximation
and integrating over a spatial interval h, as shown in Fig. 18, we arrive at
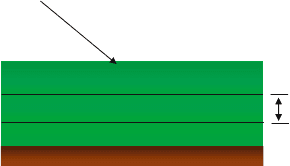
194 Barry D. Ganapol
h
τ
j
τ
j+1
Fig. 18. Discretized spatial domain
the following SN equations without spatial approximation for the collided
intensity
→
I
c
:
µ
m
→
I
c,j+1,m
−
→
I
c,j,m
+ G
m
h
dτ
→
I
c,m
(τ)
=
N
m
=1
ω
m
Γ(µ
m
,µ
m
)
h
dτ
→
I
c,m
(τ)
+ ξ
0
e
−τ
j
/ξ
0
− e
−τ
j+1
/ξ
0
Γ
0,m
1
0
,
(19)
where
Γ(µ
m
,µ
m
)=
Lmc
j=1
ω
j
g
j
a
j,m
b
j,m
.
The m-subscript represents the angular discretization, while the j-subscript
represents the spatial discretization at the interval edges. The angular quadra-
ture points are chosen to be the zeros of the Legendre polynomial of degree
N/2 over the half ranges [–1,0] and [0,1]
P
N/2
(±µ
m
)=0,m=1,N/2 .
The quadrature weights ω
m
are for the corresponding Gauss/Legendre quadra-
ture. Spatial discretization is uniform over [0,∆] with
h ≡ ∆/N
h
.
In (19), the following quantities have been defined:
→
I
c,j,m
≡
→
I
c
(τ
j
,µ
m
)
G
m
≡ G (µ
m
)
Γ
m
,m
≡ Γ(µ
m
,µ
m
) .

Reflectance Modeling with Turbid Medium Radiative Transfer 195
If we were to follow the common practice of relating the integral of the in-
tensity over interval h to the edge fluxes, we would call the average intensity
(represented by the integrals) the average of the interval edge fluxes. Here, we
adopt a more general view where the integration is interpreted as a quadra-
ture approximation of a given order K
h
dxg (x)=
K
k=1
α
k
g
k
+ O
h
K+1
If a trapezoidal rule is assumed, then K is 3 and the α’s are
1
/
2
and we have
the usual “diamond difference” approximation. More importantly, we know
the order of the error and the form of the error tail of the solution [10]
→
I
Exact
c,j,m
=
→
I
c,j,m
+
∞
k=1
→
β
k
h
2k
. (20)
With this knowledge, a Romberg iterative scheme [11] can be applied to (19)
in the fully discretized form
T
−
m
→
I
c,j+1,m
−T
+
m
→
I
c,j,m
=
→
q
j,m
+
h
2
N/2
m
=1,=m
ω
m
Γ
m
,m
⎡
⎣
→
I
c,j+1,m
+
+
→
I
c,j,m
⎤
⎦
+
h
2
N
m
=N/2+1,=m
ω
m
Γ
m
,m
⎡
⎣
→
I
c,j+1,m
+
+
→
I
c,j,m
⎤
⎦
(21)
with
T
−
m
≡
µ
m
+
h
2
G
m
I − ω
m
Γ
m,m
h
2
T
+
m
≡
µ
m
+
h
2
G
m
I + ω
m
Γ
m,m
h
2
→
q
j,m
≡ ξ
0
e
−x
j
/ξ
0
− e
−x
j+1
/ξ
0
Γ
0,m
1
0
in order to successively eliminate the higher order error terms in the error
tail of (20). This is an extension of Richardson’s extrapolation as applied
previously to the transport equation [12].
Iteration Strategy
The SN algorithm of order N is implemented in the standard way with sweep
iteration in the positive and negative angular directions. The convergence of
the sweeps is accelerated using the Wynn-Epsilon algorithm. In this algo-
rithm,
196 Barry D. Ganapol
ε
(n)
−1
=0,ε
(n)
0
= S
n
ε
(n)
k+1
= ε
(n+1)
k
+
ε
(n+1)
k
− ε
(n)
k
−1
,
S
n
represents the sweep iterates and ε
(n)
2k
the subsequent improved approx-
imation forming a tableau of approximations. The tableau diagonal is then
interrogated for convergence of the canopy reflectance. Each S
n
calculation
contributes the first element of a Romberg scheme for convergence in spatial
discretization. Finally, convergence in the quadrature order N is performed
again through a Wε acceleration. Thus, three convergence accelerations are
used to mine the SN solution for high accuracy.
3 LCM2 Demonstration
The three modules described above have been combined into the LCM2
nested radiative transfer CR code. The code can be run in two distinct
modes – Single Pixel and Independent Pixel Approximations. In this sec-
tion, both modes will be demonstrated.
3.1 Single Pixel Approximation (SPA)
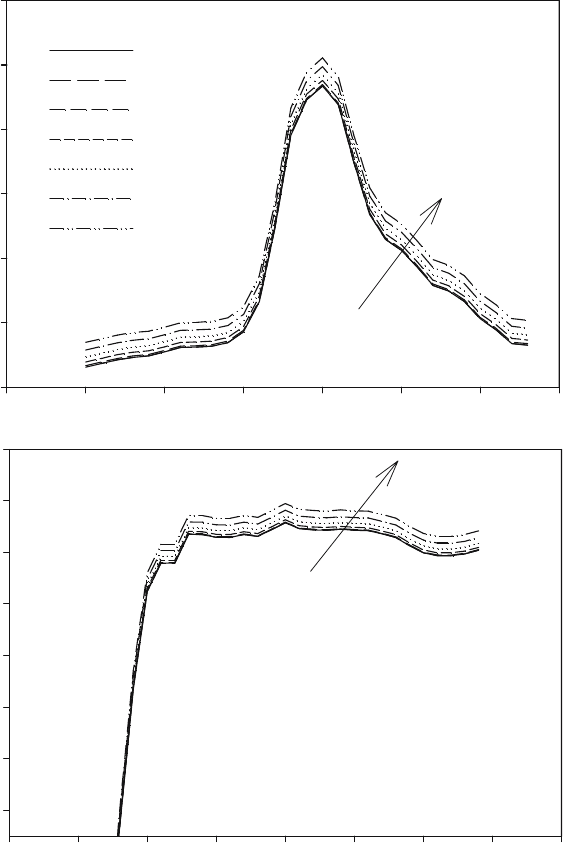
Figure 19 shows the variation of the reflectance of the intensity component
for the visible and NIR wavebands for a canopy of with an LAI of 2 and
erectophile (upright) LAD as the surface index of refraction varies. A soil
background reflectance of 0.2 is assumed. The behavior is similar at all wave-
lengths. In particular, as the index of refraction increases from 1 (air) to 1.5,
the reflectance increases. With increasing specular reflection from the leaf’s
adaxial surface, more photons avoid the leaf’s interior and therefore there
is less absorption allowing more to exit the canopy. This is in light of the
tradeoff of less photons being diffusely scattered from the leaf’s interior. The
magnitude of the overall effect will no doubt depend on canopy properties,
but the tendency to increase reflection with increasing refractive index seems
readily apparent.
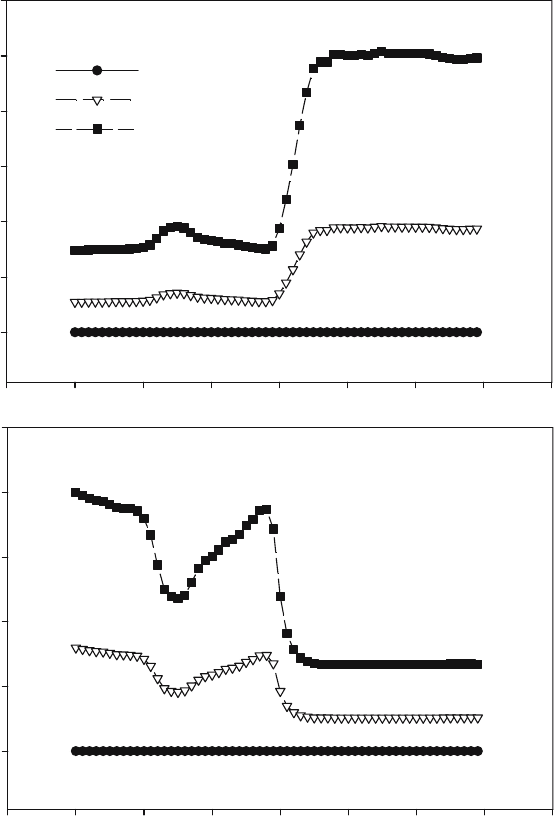
Figure 20 displays the change in the reflection of the Q-component with
increasing index of refraction n ·R
fQ
also increases with n as does the degree
of polarization at ToC. This is to be expected since an index of refraction
different from 1 is the origin of linear polarization. It should also be noted
that R
fQ
does not exhibit the usual pronounced variation at the green peak
associated with the leaf’s interior. While there is some evidence of a green
peak, there is no distinct chlorophyll well effect. This result is a direct conse-
quence of the fact that polarization arises from the leaf surface as modeled.
The slight rise at green (factor of 0.5 compared to a factor of 2 for R
f
),
is a result of multiple scattering of the intensity component providing the
Reflectance Modeling with Turbid Medium Radiative Transfer 197
350 400 450 500 550 600 650 700
R
fI
0.03
0.04
0.05
0.06
0.07
0.08
0.09
n = 1
n = 1.01
n = 1.1
n= 1.2
n = 1.3
n = 1.4
n = 1.5
λ
(nm)
650 700 750 800 850 900 950 1000 1050
R
fI
0.26
0.28
0.30
0.32
0.34
0.36
0.38
0.40
Fig. 19. Canopy reflectance with specular leaf reflection for an unpolarized target
198 Barry D. Ganapol
300 400 500 600 700 800 900 1000 1100
R
fQ
0.000
0.001
0.002
0.003
0.004
0.005
0.006
n = 1
n = 1.25
n = 1.5
λ
(nm)
300 400 500 600 700 800 900 1000 1100
D
p0
0.00
0.01
0.02
0.03
0.04
0.05
LAI = 2
Fig. 20. Linearly polarized reflectance R
fQ
and degree of polarization (DP0)
Reflectance Modeling with Turbid Medium Radiative Transfer 199
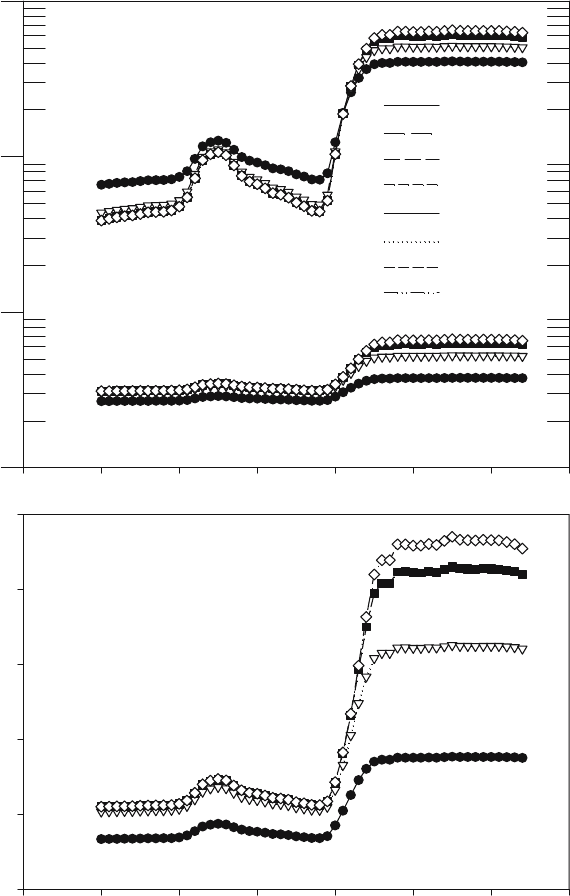
source of polarization. The difference between the two components is more
clearly evident in Fig. 21 where the two components are shown for increasing
canopy over-story (increasing canopy LAI). Saturation is observed in both
components when, as the canopy become denser, there is little change in the
reflectances. One difference to be noted is that with increasing LAI, R
f
de-
creases in the visible and increases in the NIR. This is a result of the highly
absorbing nature of the leaf in the visible–allowing for increased absorption
in a dense canopy and its highly scattering nature in the NIR–allowing for in-
creased scattering out of the canopy. Also note that the increase in the NIR
reflectance over the visible is a factor of two for the polarized component
while it is a factor of 10 for the intensity component – again a consequence
of leaf surface scattering being responsible for polarization.
3.2 Independent Pixel Approximation (IPA)
Application to Precision Agriculture
Currently the transport methods development group at the University of
Arizona is a part of a demonstration of the use of Un-piloted Aerial Vehicles
(UAVs) by NASA in precision agriculture. In particular, the effort is focused
on using a UAV to provide a synoptic view of the Kawai Coffee Company
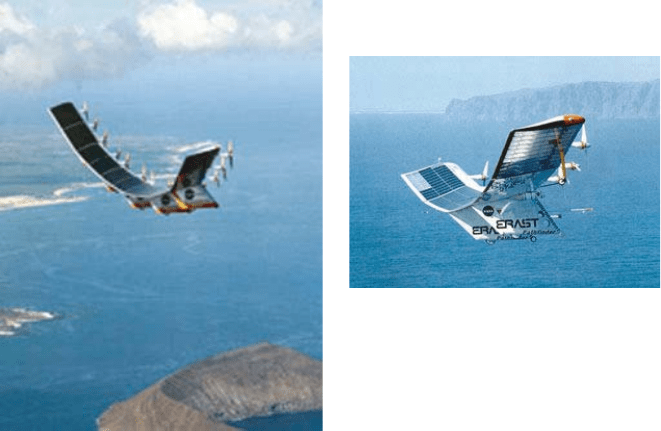
coffee fields. The Pathfinder UAV, carrying several cameras to record the
visible and NIR reflectance (shown in Fig. 22), was flown over the coffee
fields. The intent of the campaign was to explore the possibility of transferring
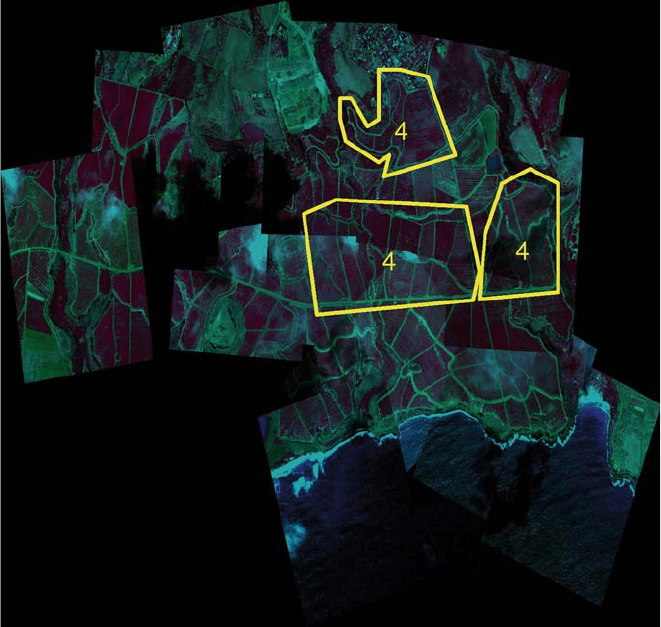
NASA technology to the agricultural community. LCM2 in the IPA mode
was the basis of a predictive Neural Net (NN) to distinguish the amount
of yellow coffee cherries (ripe crop) from green (under ripe) and red cherries
(over ripe) in the fields. LCM2 was used to train the NN to predict the three
cherry classifications in a scene given reflectance estimates. The reflectances
from the UAV flyover was then introduced as input and a prediction made
based on the LCM2 model as shown in Fig. 23. The prediction of yellow
cherries agreed to within 10% of the ground truth which is truly remarkable
agreement.
Linearly polarized Targets
Now consider a linearly polarizing target beneath the canopy. To test LCM2
in a more realistic manner, a 64 (8 × 8) pixel scene was constructed. The
LAI and soil reflectance were fixed at 2 and 0.2 for all pixels respectively and
random amounts of 5 LAD distributions were assumed to represent a random
LAD. Figure 25 shows the reflectances for the scene at three wavelengths 550
nm, 680 nm and 800 nm. For the same wavelengths, Fig. 26, shows a T-
72 tank in the clear, which is subsequently to be hidden under a canopy of
various LAIs. The vehicle surface is assumed to be fully linearly polarizing
and reflects at 0.3. The surrounding soil is assumed to be reflecting at 0.1.
200 Barry D. Ganapol
300 400 500 600 700 800 900 1000
R
f
0.001
0.01
0.1
1
LAI = 1:R
f
LAI = 2
LAI = 4
LAI = 8
LAI = 1:R
fQ
LAI = 2
LAI = 4
LAI = 8
λ
(nm)
300 400 500 600 700 800 900 1000
R
fQ
0.002
0.003
0.004
0.005
0.006
0.007
Fig. 21. Variation of LAI over unpolarized target (LAD = Planophile)
Reflectance Modeling with Turbid Medium Radiative Transfer 201
Fig. 22. Helios and Pathfinder UAVs
Figures 27a,b show R
fI
and Dp0 for the T-72 under canopies of LAIs of
4 and 6 at the three wavelengths. With increasing LAI, the T-72 becomes
increasingly obscured in both measures and all wavelengths as expected.
An alternative way of viewing the scene information is to plot the degree
of polarization (Dp0) against R
fI
. When this is done for the canopy without
a target we have Fig. 28a indicating no correlation between the degree of
polarization and the R
fI
. Doing the same for the target under a canopy of
LAI = 6 and recalling that the target could not be identified at all from the
scene variations of R
fI
, and Dp0 individually, we observe the result that the
T-72 target becomes clearly defined in all wavelengths with the NIR yielding
the clearest definition. This result can be explained by noting that the T-72
is a much brighter object than the surrounding background and it polarizes
while soil and canopy do not. In the Dp0/R
fI
plot this places the T-72 target
in the upper right corner and the soil variation is confined to the bottom.
The soil variation however still remains uncorrelated as in Fig. 28a on a very
narrow scale. We believe this to be a very significant result indeed in the field
of target identification.
Future Computational Challenges Facing CR Modeling
Several serious computational challenges face canopy modelers in the future.
One major challenge is the inverse problem of which the coffee cherry estima-
tion in Kauai is an example. Can canopy state variables, important for eco-
logical prediction and precision agriculture, be reliably obtained by inversion?
202 Barry D. Ganapol
Fig. 23. Yellow coffee cherry amounts predicted in indicated fields (Field 408 –
topmost field)
This challenge involves not only more powerful computational architectures,
but also the development of fast running and accurate inversion algorithms.
NNs are an example of the wave of new methods, but more powerful opti-
mization concepts need to be developed if CR models are expected to see
routine use. Of course, this must go hand in hand with the development of
larger memories and faster parallel methodologies. In addition, programming
languages must keep pace with the new architectures to make their use read-
ily accessible. Finally, the establishment of reliable canopy optical properties
must also be part of the mix. Experimental resources should be dedicated to
providing more representative leaf and canopy properties as the CR models
become more sophisticated.