Gibilisco S. Everyday Math Demystified: A Self-Teaching Guide
Подождите немного. Документ загружается.

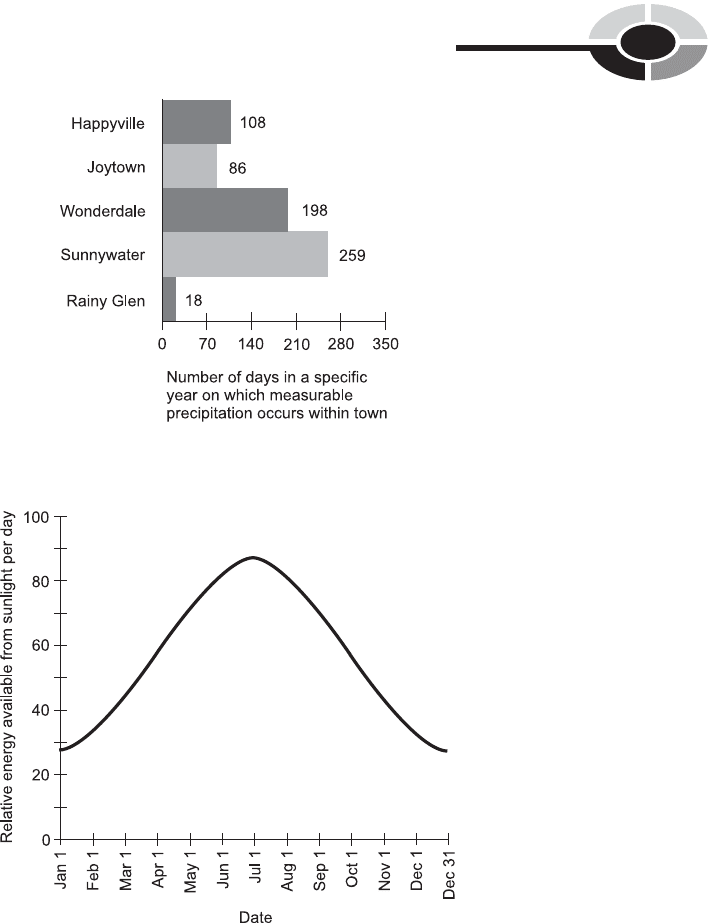
FREQUENCY DISTRIBUTION
In both of the above examples (the first showing the results of 6000 die tosses
and the second showing the days with precipitation in five hypothetical
towns), the scenarios are portrayed with frequency as the dependent variable.
This is true of the tables as well as the graphs. Whenever frequency is
Fig. 7-4. Measurable precipitation during a hypothetical year, in five different
imaginary towns.
Fig. 7-5. Relative energy available from sunlight, per day, during the course of a calendar
year at a hypothetical location.
CHAPTER 7 A Statistics Sampler 151

portrayed as the dependent variable in a distribution, that distribution is
called a frequency distribution.
Suppose we complicate the situation involving dice. Instead of one person
tossing one die 6000 times, we have five people tossing five different dice, and
each person tosses the same die 6000 times. The dice are colored red, orange,
yellow, green, and blue, and are manufactured by five different companies,
called Corp. A, Corp. B, Corp. C, Corp. D, and Corp. E, respectively. Four
of the dice are ‘‘weighted’’ and one is not. There are thus 30,000 die tosses to
tabulate or graph in total. When we conduct this experiment, we can tabulate
the data in at least two ways.
Ungrouped frequency distribution
The simplest way to tabulate the die toss results as a frequency distribution is
to combine all the tosses and show the total frequency for each die face 1
through 6. A hypothetical example of this result, called an ungrouped
frequency distribution, is shown in Table 7-3. We don’t care about the weight-
ing characteristics of each individual die, but only about potential biasing
of the entire set. It appears that, for this particular set of dice, there is
some bias in favor of faces 4 and 6, some bias against faces 1 and 3, and little
or no bias either for or against faces 2 and 5.
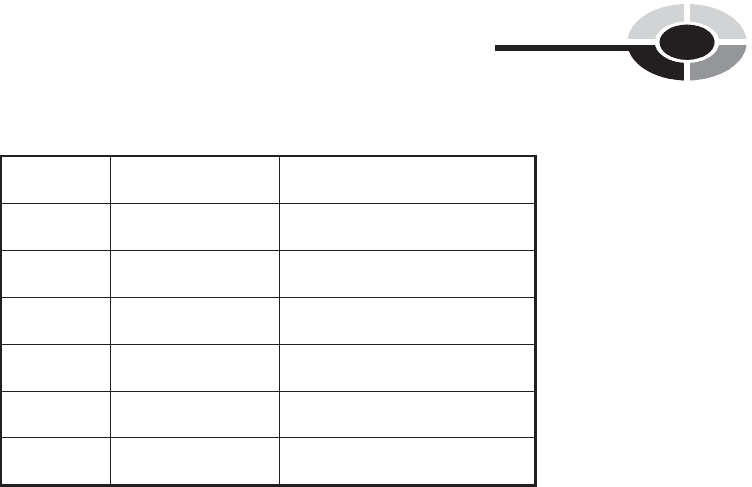
Table 7-3 An ungrouped frequency distribution showing
the results of a single, hypothetical experiment in which five
different dice, some ‘‘weighted’’ and some not, are each
tossed 6000 times.
Face of die Toss results
for all die
1 4857
2 4999
3 4626
4 5362
5 4947
6 5209
PART 2 Finding Unknowns
152

Grouped frequency distribution
If we want to be more detailed, we can tabulate the frequency for each die
face 1 through 6 separately for each die. A hypothetical product of this effort,
called a grouped frequency distribution, is shown in Table 7-4. The results are
grouped according to manufacturer and die color. From this distribution, it is
apparent that some of the dice are heavily ‘‘weighted.’’ Only the green die,
manufactured by Corp. D, seems to lack any bias. If you are astute, you
will notice (or at least strongly suspect) that the green die here is the same
die, with results gathered from the same experiment, as is portrayed in
Table 7-1 and Fig. 7-3.
PROBLEM 7-1
Suppose you add up all the numbers in each column of Table 7-4. What
should you expect, and why? What should you expect if the experiment is
repeated many times?
SOLUTION 7-1
Each column should add up to 6000. This is the number of times each die
(red, orange, yellow, green, or blue) is tossed in the experiment. If the
sum of the numbers in any of the columns is not equal to 6000, then the
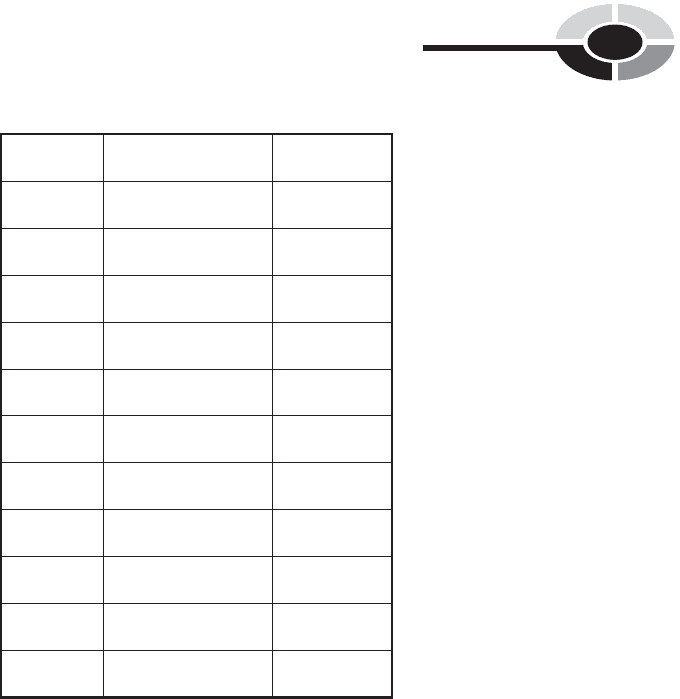
Table 7-4 A grouped frequency distribution showing the results of a
single, hypothetical experiment in which five different dice, some
‘‘weighted’’ and some not, and manufactured by five different
companies, are each tossed 6000 times.
Face of die Toss results by manufacturer
Red
Corp. A
Orange
Corp. B
Yellow
Corp. C
Green
Corp. D
Blue
Corp. E
1 625 1195 1689 968 380
2 903 1096 1705 1027 268
3 1300 890 1010 1018 408
4 1752 787 540 996 1287
5 577 1076 688 1007 1599
6 843 956 368 984 2058
CHAPTER 7 A Statistics Sampler 153

experiment was done in a faulty way, or else there is an error in the com-
pilation of the table. If the experiment is repeated many times, the sums of
the numbers in each column should always be 6000.
PROBLEM 7-2
Suppose you add up all the numbers in each row of Table 7-4. What should
you expect, and why? What should you expect if the experiment is repeated
many times?
SOLUTION 7-2
The sums of the numbers in the rows will vary, depending on the bias of the
set of dice considered as a whole. If, taken all together, the dice show any
bias, and if the experiment is repeated many times, the sums of the numbers
should be consistently lower for some rows than for other rows.
PROBLEM 7-3
Each small rectangle in a table, representing the intersection of one row
with one column, is called a cell of the table. What do the individual numbers
in the cells of Table 7-4 represent?
SOLUTION 7-3
The individual numbers are absolute frequencies. They represent the actual
number of times a particular face of a particular die came up during the
course of the experiment.
More Definitions
Here are some more definitions you should learn in order to get comfortable
reading or talking about statistics.
CUMULATIVE ABSOLUTE FREQUENCY
When data are tabulated, the absolute frequencies are often shown in one or
more columns. Look at Table 7-5, for example. This shows the results of the
tosses of the blue die in the experiment we looked at a while ago. The first
column shows the number on the die face. The second column shows the
absolute frequency for each face, or the number of times each face turned
up during the experiment. The third column shows the cumulative absolute
frequency, which is the sum of all the absolute frequency values in table
cells at or above the given position.
PART 2 Finding Unknowns
154
The cumulative absolute frequency numbers in a table always ascend
(increase) as you go down the column. The highest cumulative absolute
frequency value should be equal to the sum of all the individual absolute
frequency numbers. In this instance, it is 6000, the number of times the blue
die was tossed.
CUMULATIVE RELATIVE FREQUENCY
Relative frequency values can be added up down the columns of a table, in
exactly the same way as the absolute frequency values are added up. When
this is done, the resulting values, usually expressed as percentages, show
the cumulative relative frequency.
Examine Table 7-6. This is a more detailed analysis of what happened with
the blue die in the above-mentioned experiment. The first, second, and fourth
columns in Table 7-6 are identical with the first, second, and third columns in
Table 7-5. The third column in Table 7-6 shows the percentage represented
by each absolute frequency number. These percentages are obtained by
dividing the number in the second column by 6000, the total number of
tosses. The fifth column shows the cumulative relative frequency, which is
the sum of all the relative frequency values in table cells at or above the given
position.
The cumulative relative frequency percentages in a table, like the
cumulative absolute frequency numbers, always ascend as you go down
Table 7-5 Results of an experiment in which a ‘‘weighted’’ die is tossed 6000 times,
showing absolute frequencies and cumulative absolute frequencies.
Face of die Absolute frequency Cumulative absolute frequency
1 380 380
2 268 648
3 408 1056
4 1287 2343
5 1599 3942
6 2058 6000
CHAPTER 7 A Statistics Sampler 155

the column. The total cumulative relative frequency should be equal to
100%. In this sense, the cumulative relative frequency column in a table can
serve as a checksum, helping to ensure that the entries have been tabulated
correctly.
MEAN
The mean for a discrete variable in a distribution is the mathematical average
of all the values. If the variable is considered over the entire population,
the average is called the population mean. If the variable is considered
over a particular sample of a population, the average is called the sample
mean. There can be only one population mean for a population, but
there can be many different sample means. The mean is often denoted by
the lowercase Greek letter mu, in italics (). Sometimes it is also denoted
by an italicized lowercase English letter, usually x, with a bar (vinculum)
over it.
Table 7-7 shows the results of a 10-question test, given to a class of 100
students. As you can see, every possible score is accounted for. There are
some people who answered all 10 questions correctly; there are some who
did not get a single answer right. In order to determine the mean score for
the whole class on this test – that is, the population mean, called
p
–we
must add up the scores of each and every student, and then divide by 100.
Table 7-6 Results of an experiment in which a ‘‘weighted’’ die is tossed 6000
times, showing absolute frequencies, relative frequencies, cumulative absolute
frequencies, and cumulative relative frequencies.
Face of die Absolute
frequency
Relative
frequency
Cumulative
absolute frequency
Cumulative
relative frequency
1 380 6.33% 380 6.33%
2 268 4.47% 648 10.80%
3 408 6.80% 1056 17.60%
4 1287 21.45% 2343 39.05%
5 1599 26.65% 3942 65.70%
6 2058 34.30% 6000 100.00%
PART 2 Finding Unknowns
156
First, let’s sum the products of the numbers in the first and second columns.
This will give us 100 times the population mean:
ð10 5Þþð9 6Þþð8 19Þþð7 17Þþð6 18Þþð5 11Þ
þð4 6Þþð3 4Þþð2 4Þþð1 7Þþð0 3Þ
¼ 50 þ 54 þ 152 þ 119 þ 108 þ 55 þ 24 þ 12 þ 8 þ 7 þ 0
¼ 589
Dividing this by 100, the total number of test scores (one for each student
who turns in a paper), we obtain
p
¼ 589/100 ¼ 5.89.
The teacher in this class has assigned letter grades to each score. Students
who scored 9 or 10 correct received grades of A; students who got scores of 7
or 8 received grades of B; those who got scores of 5 or 6 got grades of C;
those who got scores of 3 or 4 got grades of D; those who got less than 3
correct answers received grades of F. The assignment of grades, informally
known as the ‘‘curve,’’ is a matter of teacher temperament and doubtless
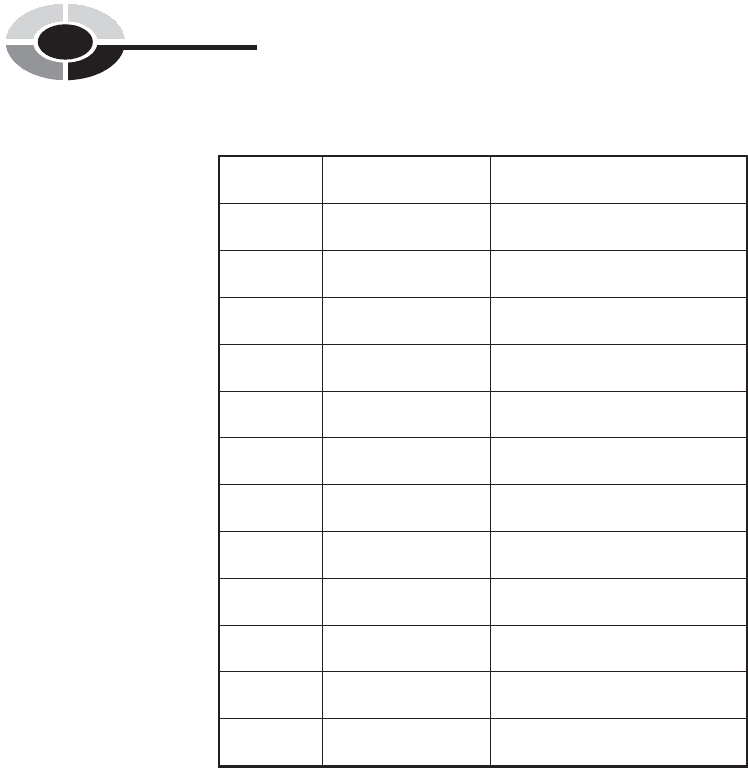
Table 7-7 Scores on a 10-question test taken by 100 students.
Test score Absolute frequency Letter grade
10 5 A
96 A
819 B
717 B
618 C
511 C
46 D
34 D
24 F
17 F
03 F
CHAPTER 7 A Statistics Sampler 157

would seem arbitrary to the students who took this test. (Some people might
consider the ‘‘curve’’ in this case to be overly lenient, while a few might think
it is too severe.)
PROBLEM 7-4
What are the sample means for each grade in the test whose results are
tabulated in Table 7-7? Use rounding to determine the answers to two
decimal places.
SOLUTION 7-4
Let’s call the sample means
sa
for the grade of A,
sb
for the grade of B, and
so on down to
sf
for the grade of F.
To calculate
sa
, note that 5 students received scores of 10, while 6
students got scores of 9, both scores good enough for an A. This is a total of
5 þ 6, or 11, students getting the grade of A. Therefore:
sa
¼½ð5 10Þþð6 9Þ=11
¼ð50 þ 54Þ=11
¼ 104=11
¼ 9:45
To find
sb
, observe that 19 students scored 8, and 17 students scored 7.
Thus, 19 þ 17, or 36, students received grades of B. Calculating:
sb
¼½ð19 8Þþð17 7Þ=36
¼ð152 þ 119Þ=36
¼ 271=36
¼ 7:53
To determine
sc
, check the table to see that 18 students scored 6, while 11
students scored 5. Therefore, 18 þ 11, or 29, students did well enough for
a C. Grinding out the numbers yields this result:
sc
¼½ð18 6Þþð11 5Þ=29
¼ð108 þ 55Þ=29
¼ 163=29
¼ 5:62
PART 2 Finding Unknowns
158

To calculate
sd
, note that 6 students scored 4, while 4 students scored 3.
This means that 6 þ 4, or 10, students got grades of D:
sd
¼½ð6 4Þþð4 3Þ=10
¼ð24 þ 12Þ=10
¼ 36=10
¼ 3:60
Finally, we determine
sf
. Observe that 4 students got scores of 2,
7 students got scores of 1, and 3 students got scores of 0. Thus, 4 þ 7 þ 3, or
14, students failed the test:
sf
¼½ð4 2Þþð7 1Þþð3 0Þ=14
¼ð8 þ 7 þ 0Þ=14
¼ 15=14
¼ 1:07
MEDIAN
If the number of elements in a distribution is even, then the median is the
value such that half the elements have values greater than or equal to it,
and half the elements have values less than or equal to it. If the number of
elements is odd, then the median is the value such that the number of
elements having values greater than or equal to it is the same as the number
of elements having values less than or equal to it. The word ‘‘median’’ is
synonymous with ‘‘middle.’’
Table 7-8 shows the results of the 10-question test described above, but
instead of showing letter grades in the third column, the cumulative absolute
frequency is shown instead. The tally is begun with the top-scoring papers
and proceeds in order downward. (It could just as well be done the other way,
starting with the lowest-scoring papers and proceeding upward.) When the
scores of all 100 individual papers are tallied this way, so they are in order,
the scores of the 50th and 51st papers – the two in the middle – are found to
be 6 correct. Thus, the median score is 6, because half the students scored 6 or
above, and the other half scored 6 or below.
It’s possible that in another group of 100 students taking this same test, the
50th paper would have a score of 6 while the 51st paper would have a score
of 5. When two values ‘‘compete,’’ the median is equal to their average.
In this case it would be midway between 5 and 6, or 5.5.
CHAPTER 7 A Statistics Sampler 159
MODE
The mode for a discrete variable is the value that occurs the most often. In the
test whose results are shown in Table 7-7, the most ‘‘popular’’ or often-
occurring score is 8 correct answers. There were 19 papers with this score.
No other score had that many results. Therefore, the mode in this case is 8.
Suppose that another group of students took this test, and there were two
scores that occurred equally often? For example, suppose 16 students got 8
answers right, and 16 students also got 6 answers right? In this case there are
two modes: 6 and 8. This distribution would be called a bimodal distribution.
It’s even possible that three scores would be equally popular, resulting in a
trimodal distribution.
Now imagine there are only 99 students in a class, and there are exactly
9 students who get each of the 11 possible scores (from 0 to 10 correct answers).
Table 7-8 The median can be determined by tabulating the cumulative
absolute frequencies.
Test score Absolute frequency Cumulative absolute frequency
10 5 5
96 11
819 30
717 47
6 (partial) 3 50
6 (partial) 15 65
511 76
46 82
34 86
24 90
17 97
0 3 100
PART 2 Finding Unknowns
160