Gebali F. Analysis Of Computer And Communication Networks
Подождите немного. Документ загружается.


14.8 Generalized-Cube Network (GCN) 521
14.8.2 Analysis of GCN Network
An N × N GCN network is built using 2 ×2 crossbar switching elements. We use
the analysis for the N × N crossbar network to study each 2×2 SE, then extend the
analysis to the whole network [20, 21].
Consider a 2 × 2 SE at stage i and define a
i
(in) as the probability that a packet
appears at one of its two inputs and a
i
(out) as the probability that a packet appears
at one of the two outputs. Both these probabilities are equal to the input and output
traffic, respectively.
For any SE at the input stage (i = 0), we can adapt the crossbar throughput given
by (14.5) when N = 2:
a
0
(in) = a (14.20)
a
0
(out) = 1 −
1 −
a
2
2
(14.21)
Now we know the throughput at the output of all SEs at stage 0.
For the SEs at the other stages, we have the recursive expression
a
i
(in) = a
i−1
(out) (14.22)
a
i
(out) = 1 −
1 −
a
i
(in)
2
2
(14.23)
for 0 < i < n.
According to (14.3), we can write the traffic at the input of the SE at the first
stage i = 0as
N
a
(in) = a (14.24)
and the output traffic at the tagged output of the network is
N
a
(out) = a
n−1
(out) (14.25)
The throughput of the GCN network is given by
Th = N
a
(out) = a
n−1
(out) (14.26)
A simple expression for the throughput is not possible because of the nonlinear
nature of (14.23).
The packet acceptance probability of the GCN network is given by
p
a
=
Th
N
a
(in)
(14.27)
522 14 Interconnection Networks
The delay of the network is defined as the average number of attempts to access
the desired output. The probability that the packet succeeds after k tries is given by
the geometric distribution
p(k) = p
a
(
1 − p
a
)
k
(14.28)
The average delay time is
n
a
=
∞
k=0
kp(k)
=
∞
k=0
kp
a
(
1 − p
a
)
k
=
1 − p
a
p
a
(14.29)
0
0.2
0.4
0.6
0.8
1
Throughput
0 0.5 1
0
0.2
0.4
0.6
0.8
1
Input traffic
Acceptance probability
0 0.5 1
Input traffic
0 0.5 1
0
0.5
1
1.5
2
Input traffic
Delay
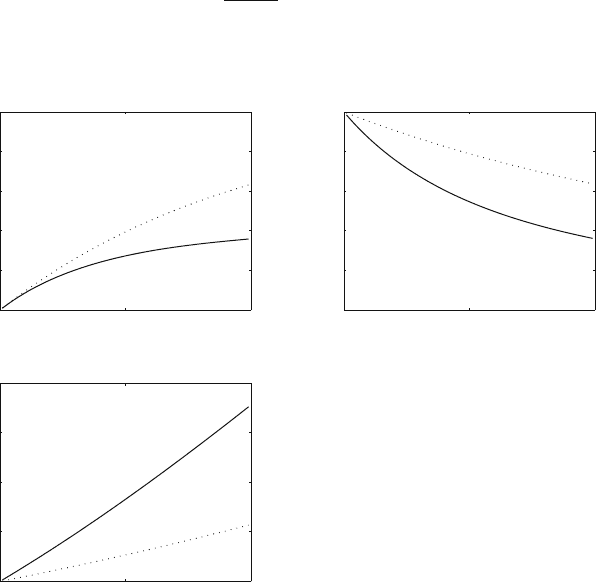
Fig. 14.9 Variation of the throughput, the packet acceptance probability, and the delay with the
input traffic when N = 64 for the GCN network (solid line) and the similar-sized crossbar network
(dotted line).
14.9 The Banyan Network 523
Example 14.2 Plot the throughput (Th), the access probability (p
a
), and the average
delay (n
a
) for the GCN network versus the input traffic when the size of the network
is N = 64, and compare this with the similar-sized crossbar network.
We evaluate the expressions for throughput, packet acceptance probability, and
delay when N = 64, and a is varied for both the GCN network and the cross-
bar network. Figure 14.9 shows the variation of throughput, the packet acceptance
probability, and the delay with the input traffic when N = 64 for the GCN network
(solid line) and the crossbar network (dotted line). We see that the crossbar net-
work shows superior performance for the same number of input and output ports as
expected.
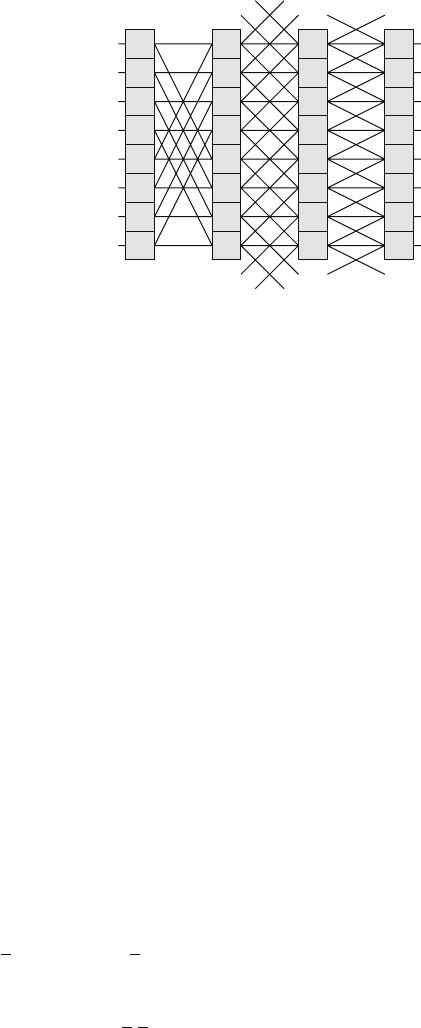
14.9 The Banyan Network
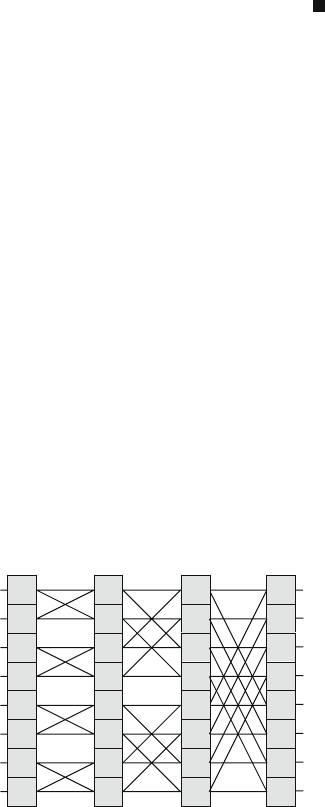
Figure 14.10 shows an 8 × 8 banyan network. For an N × N network, the number
of stages is n +1, where n = lg N, and the number of SEs in each stage is N. Each
SE is a 2 ×2 crossbar switch and the number of links between the stages is 2N.
An N × N banyan network is built using 1-to-2 selectors in the input stage
(i = 0), 2 × 2 crossbar SEs in the n − 1 internal stages (0 < i < n), and 2-to-1
concentrators in the output stage (i = n). However, the banyan network is a block-
ing network and provides only one path from any input to any output. As such, it
possesses no tolerance for faults.
Switching element SE(i, j) at stage i and row position j is connected to
SE(i +1, k) such that k is given by
k =
⎧
⎨
⎩
j straight connection
C
i
(
j
)
cube connection
(14.30)
where 0 ≤ i < n. Thus, at stage 1, we see that SE(1, 2) is connected to switches
SE(2, 2), the straight connection, and switch SE(2, 0), the C
1
(
2
)
connection.
Fig. 14.10 An 8 × 8banyan
network
0
12
3Stage:
0
1
2
4
3
5
6
7
0
1
2
4
3
5
6
7
0
1
2
4
3
5
6
7
0
1
2
4
3
5
6
7
Inputs
Outputs
524 14 Interconnection Networks
The banyan network provides one unique path from any input to any output
based on the input row address and the destination address. Figure 14.7 shows the
two types of connections that could be established for the two inputs of an SE at
stage i:
Straight connection: The packet enters and exits at the same row location.
Cube connection: The packet enters at row location R and exits at row location
C
i
(
R
)
.
14.9.1 Routing Algorithm for Banyan Network
The routing algorithm for the banyan network is identical to that of the GCN net-
work.
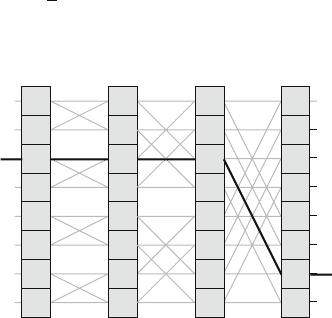
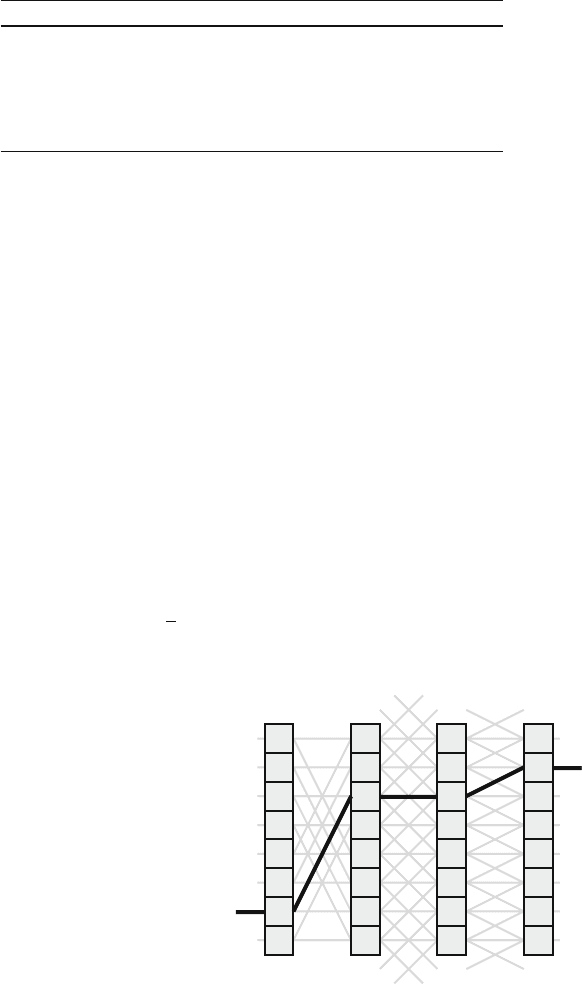
Figure 14.11 shows the path chosen to route a packet from input at row 2 to
output at row 6 based on binary bit pattern of routing vector r.
14.9.2 Analysis of Banyan Network
An N × N banyan network is built using 1-to-2 selectors in the input stage (i = 0),
2×2 crossbar SEs in the n −1 internal stages (0 < i < n), and 2-to-1 concentrators
in the output stage (i = n). Therefore, we can use the results we obtained for the
crossbar network after some modifications.
Because we have 1-to-2 selectors at stage 0, the packet arrival probabilities at the
input and the outputs of each selector are given by
a
0
(in) = a (14.31)
a
0
(out) =
a
2
(14.32)
Fig. 14.11 Path chosen in the
banyan network to route a
packet from input at row 2 to
output at row 6 based on
binary bit pattern of routing
vector r
0
12
3Stage:
0
1
2
4
3
5
6
7
0
1
2
4
3
5
6
7
0
1
2
4
3
5
6
7
0
1
2
4
3
5
6
7
Inputs
Outputs

14.9 The Banyan Network 525
For the SEs at the internal stages (0 < i < n), we use the expression for the
throughput in (14.5) with N = 2
a
i
(in) = a
i−1
(out) (14.33)
a
i
(out) = 1 −
1 −
a
i
(in)
2
2
(14.34)
where 0 < i < n.
At the output stage (i = n), we have 2-to-1 concentrators. Depending on the
design, an output concentrator could accept one packet only per time step. In other
designs, the output concentrator could accept two packets coming on the two input
links at the same time step.
For the output concentrator that accepts only one packet per time step, the packet
arrival and departure probabilities at the output are given by
a
n
(in) = a
n−1
(out) (14.35)
a
n
(out) = x
1
+ x
2
(14.36)
where x
j
is the probability that j packets arrived
x
j
=
2
j
a
j
n
(in)
[
1 −a
n
(in)
]
2−j
(14.37)
From the definition of x
j
, we can write a
n
(out) as
a
n
(out) = 2 a
n
(in) −a
2
n
(in) (14.38)
For the output concentrator that accepts all packets arriving at its two inputs, the
packet arrival and departure probabilities are given by
a
n
(in) = a
n−1
(out) (14.39)
a
n
(out) = x
1
+2x
2
(14.40)
From the definition of x
j
, we can write a
n
(out) as
a
n
(out) = 2 a
n
(in) (14.41)
According to (14.3), we can write the traffic at the input of the banyan network as
N
a
(in) = a (14.42)

526 14 Interconnection Networks
and the output traffic at the tagged output of the network is
N
a
(out) = a
n
(out) (14.43)
where a
n
(out) is given by (14.38) or (14.41) depending on the details of the design.
The throughput of the banyan network is given by
Th = N
a
(out) = a
n
(out) (14.44)
The packet acceptance probability for the banyan network is given by
p
a
=
Th
N
a
(in)
(14.45)
The delay of the banyan network is defined as the average number of attempts
to access the desired output. The probability that the packet succeeds after k tries is
given by the geometric distribution
p(k) = p
a
(
1 − p
a
)
k
(14.46)
The average delay time is
n
a
=
∞
k=0
kp(k)
=
∞
k=0
kp
a
(
1 − p
a
)
k
=
1 − p
a
p
a
(14.47)
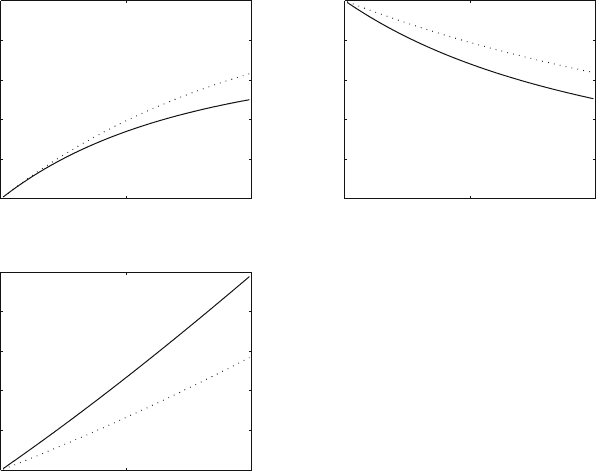
Example 14.3 Plot the throughput (Th), the access probability (p
a
), and the average
delay (n
a
) for the banyan network versus the input traffic when the size of the net-
work is N = 64 and compare this with the similar-sized crossbar network. Assume
an output concentrator that accepts only one packet.
We evaluate the expressions for throughput, packet acceptance probability, and
delay when N = 64 and a is varied for both the banyan network and the cross-
bar network. Figure 14.12 shows the variation of throughput, the packet acceptance
probability, and the delay with the input traffic when N = 64 for the banyan net-
work (solid line) and the crossbar network (dotted line). We see that the crossbar
network shows superior performance for the same number of input and output ports
as expected.
14.10 Augmented Data Manipulator Network (ADMN) 527
0
0.2
0.4
0.6
0.8
1
0
0.2
0.4
0.6
0.8
1
Throughput
0 0.5 1
0
0.2
0.4
0.6
0.8
1
Input traffic
Acceptance probability
0 0.5 1
Input traffic
0 0.5 1
Input traffic
Delay
Fig. 14.12 Variation of the throughput, the packet acceptance probability, and the delay with the
input traffic when N = 64 for the banyan network (solid line) and the similar-sized crossbar
network (dotted line). The output concentrator accepts only one packet
14.10 Augmented Data Manipulator Network (ADMN)
Figure 14.13 shows an 8 × 8 ADMN network. For an N × N network, the number
of stages is n + 1 where n = lg N, and the number of SEs in each stage is N. Each
SE is a 3 ×3 crossbar switch and the number of links between the stages is 3N.
An N × N ADMN network is built using 1-to-3 selectors in the input stage
(i = 0), 3 × 3 crossbar SEs in the n − 1 internal stages (0 < i < n), and 3-to-1
concentrators in the output stage (i = n) [17]. The ADMN network is a nonblocking
network and provides two paths from any input to any output. As such, it is 1-fault
tolerant.
As the packet travels through the stages of the network, each SE is capable of
shifting the path of the packet among the rows. The shifting distance decreases as
packets traverse the network.
Switching element SE(i, j) is connected to SE(i + 1, k) such that k is given by
k =
⎧
⎪
⎨
⎪
⎩
j −2
n−i−1
mod N −2I : up connection
js: straight connection
j +2
n−i−1
mod N +2I : down connection
(14.48)
528 14 Interconnection Networks
Fig. 14.13 An augmented
data manipulator network
(ADMN) for N = 8and
n = lg 8 = 3
0 1 2 3
a
b
d
c
f
e
a
b
d
c
f
e
Stage:
Inputs
Outputs
0
1
2
4
3
5
6
7
0
1
2
4
3
5
6
7
0
1
2
4
3
5
6
7
0
1
2
4
3
5
6
7
where 0 ≤ i < n. Notice that the plus–minus links connecting stage 0 to stage 1
perform a shift of ±2
n−1
. These links coincide since we could write
j −2
n−1
mod N =
j +2
n−1
mod N
The ADMN depends on the PM2I function, which implies that it relies on arith-
metic operations on the addresses of the SEs. The number format for routing in-
formation could be decimal notation,
(
n + 1
)
-bit 2’s complement notation, or the
n-bit radix-2 redundant signed-digit (RSD) number notation. In the RSD system,
any n-bit number x can be represented as
x =
n−1
i=0
x
i
×2
i
(14.49)
where x
i
∈{−1, 0, +1}. The range of an n-bit RSD number is
−2
n
+1, −2
n
+2, ···, −1, 0, 1, ···, 2
n
−2, 2
n
−1 (14.50)
or
− N +1, −N +2, ···, −1, 0, 1, ···, N −2, N −1 (14.51)
where n = lg N.
One bit location in that number system is represented not in binary format
(0, 1) but in ternary format (
1, 0, 1), where 1 denotes the value −1. For example, a
number r = 3 could be represented as
r =
0
1 1
(14.52)
14.10 Augmented Data Manipulator Network (ADMN) 529
14.10.1 Routing Algorithms for ADMN Network
We discuss here three routing algorithms for the ADMN network. The algorithms
are distributed among the SEs. The first routing algorithm uses the decimal value
of the routing vector, which is calculated once at the input stage but has to be up-
dated at all the internal stages. The second routing algorithm uses the (n + 1)-bit
2’s complement of the routing vector, which has to be calculated once at the input
stage. The other stages merely scan the bits of the routing vector to make configure
their SEs. The third routing algorithm uses the (n)-bit RSD bit pattern of the routing
vector which is calculated once at the input stage. The other stages merely scan the
bits of the routing vector to make configure their SEs.
14.10.2 First ADMN Routing Algorithm
This algorithm updates the routing vector value at each stage and uses current value
to make its routing decisions. To establish a path from a source address at an input
port location S to a destination address at an output port location D, we initialize
the routing vector r as
r
0
= D − S (14.53)
where r
0
is the routing vector at the input of the SE at stage 0. A packet that has
been routed as far as stage i will have a routing vector r
i
. Upon exiting stage i,the
routing vector r
i
is updated according to the equation
r
i+1
= r
i
+μ
i
δ
i
0 ≤ i < n (14.54)
where
δ
i
= 2
n−i−1
(14.55)
μ
i
=
⎧
⎪
⎪
⎪
⎪
⎨
⎪
⎪
⎪
⎪
⎩
−1 r
i
≥ δ
i
0 −δ
i
< r
i
<δ
i
+1 r
i
≤−δ
i
(14.56)
Our objective in Equation (14.54) is to reduce r
i
to zero. When r
i
= 0, we know
that the packet has reached the desired destination row D.
With the values of δ
i
and μ
i
determined, the packet will move to row location
R
i+1
at stage i +1 where R
i+1
is given by
R
i+1
=
(
R
i
−μ
i
δ
i
)
mod N, 0 ≤ i < n (14.57)
530 14 Interconnection Networks
Table 14.2 SE settings for path in ADMN network from input 6 to output 1 based on the decimal
value of the routing vector r
Stage i = 0 i = 1 i = 2 i = 3
δ
i
= 2
n−i−1
421NA
μ
i
+10+1NA
Input routing vector (r
i
) −5 −1 −10
Output routing vector (r
i+1
) −1 −100
Entry row location of packet (R
i
)6 2 21
Exit row location of packet (R
i+1
)2 2 1 1
As an example, assume a packet arrives at input port 6 and is destined to output
port 1. In that case, we have
S = 6 (14.58)
D = 1 (14.59)
r
0
= 1 −6 =−5 (14.60)
The routing decisions at each stage are explained in Table 14.2
Figure 14.14 shows the path chosen to route a packet from input at row 6 to
output at row 1 based on decimal value of routing vector r.
Finding the Alternative Route
To find an alternative route for the incoming packet, we calculate the routing vector,
as in the previous section, then we find the new routing vector obtained from the
operation
r
0
= (r
0
± N)mod N (14.61)
Fig. 14.14 Path chosen in the
ADMN network to route a
packet from input at row 6 to
output at row 1 based on
decimal value of routing
vector r
0 1 2 3
Stage:
Inputs
Outputs
0
1
2
4
3
5
6
7
0
1
2
4
3
5
6
7
0
1
2
4
3
5
6
7
0
1
2
4
3
5
6
7
a
b
d
c
f
e
a
b
d
c
f
e