Gary Nichols. Sedimentology and Stratigraphy(Second Edition)
Подождите немного. Документ загружается.


development of more sophisticated data acquisition
and processing techniques in recent years has been
the availability of more powerful computers able to
store, handle and rapidly process data volumes on
these scales.
22.2.3 Visualisation of seismic
reflection data
2-D profiles are presented as black and white paper
copy, typically rolls of paper a metre or more wide and
many metres long. These will show a horizontal scale
in metres and kilometres, marked with the shot points
of the survey. The vertical scale will be in milliseconds
of two-way time (TWT ms) unless a depth conversion
has been carried out prior to printing. The patterns of
reflectors can be visually assessed and interpreted in
terms of structures and stratigraphy as described
below. If a series of lines has been shot to form a
grid pattern, cross-cutting lines are matched up and
a correlation between all of the lines in the grid is
carried out.
The scope for visualisation of data from a 3-D sur-
vey is much greater and has expanded as computing
technology has advanced. 2-D profiles can be
extracted from the data and presented on-screen in
any orientation, vertically, obliquely or horizontally.
It is also possible to create three-dimensional images
that can be perspective images on the screen or using
3-D projection technology to generate a virtual three-
dimensional effect. These latter visualisation tech-
niques allow the interpreter to ‘move’ through the vol-
ume of data as if they were moving through the
volume of rock and view the geology from different
perspectives, angles and at different scales.
22.2.4 Interpretation of seismic
reflection data
At a first glance there is a lot in common between a
seismic reflection profile and a cross-section compiled
from surface outcrop data. Layers looking like beds of
rock may be seen on the profile, unconformities, folds
and faults may be picked out and contrasts in the
detailed pattern of the reflectors suggest that different
rocks may be identified on a seismic reflection profile.
Although all these features can indeed be related
to stratigraphic and structural features seen in
rocks, comparison and interpretation must be carried
out with caution because there are important differ-
ences too.
First, there is a question of scale. In dealing with
outcrop, a geologist is accustomed to looking at beds
centimetres to metres thick and features tens to hun-
dreds of metres across are considered large scale. The
vertical resolution on a seismic reflection profile is
related to the wavelength of the sound waves and
the best resolution that can be achieved is about
15 m, so the units defined by reflectors are packages
of beds, not individual beds. Sound waves reflected
from deeper in the succession have lower energy so
there is also a decrease in resolution with depth and
detail can be much more clearly seen in shallower
strata than in rocks buried a few thousand metres
below ground.
Second, a contact between two rock units will not
show up on a seismic profile if there is no acoustic
impedance contrast between them. The boundary
between a thick sandstone and a conglomerate body
might be easily recognised in outcrop, but if they have
the same acoustic properties the contact between the
two would not be imaged as a reflector. The clearest
reflectors are generated by the contacts between beds
of contrasting properties, such as a mudstone and a
well-cemented limestone, a basalt lava and a sand-
stone or a bed of halite overlain by anhydrite.
Third, processing techniques that attempt to con-
vert the geometries imaged on the profile into the true
subsurface relationships become less effective with
distance
two-way time
Fig. 22.2 Example of a seismic reflection profile: the
horizontal scale is distance (in this case several kilometres
across), but the vertical scale is in two-way travel time, that
is, the time it takes for sound waves to reach a subsurface
reflector and return to the surface. If the acoustic properties
of the rock are known (these vary with the bulk density) this
can be converted to depth.
338 Subsurface Stratigraphy and Sedimentology
increasing depth. The relative horizontal positions of
reflectors are distorted such that the true location is
not correctly shown, and the angular relationships
are also not accurate. The interpretation of both stra-
tal and structural geometries on seismic reflection
profiles must therefore be carried out with care and
an awareness of these potential distortions.
22.2.5 Stratigraphic relationships on
seismic profiles
By tracing reflectors across profiles it is possible to
recognise stratal relationships (Fig. 22.3) that are on
the scale of hundreds of metres to kilometres. When
traced and marked these form a framework for the
interpretation of the whole succession of rocks imaged
on the profile.
Continuous reflectors
A well-defined reflector marks a boundary between
two layers of different acoustic impedance and for this
to be continuous over kilometres it must mark a
change in lithological characteristics of the same
extent. Changes in lithology in a sedimentary succes-
sion result from changes in depositional environment
and a widespread change in depositional environ-
ment can result from events such as a change in sea
level or sediment supply. For example, a sea-level rise
may cause sandy, shallow-water deposits to be
replaced by muddy, deeper-water sediments over a
wide area. A similar widespread change may occur
when a carbonate shelf environment receives an influx
of mud and the lithology deposited changes from lime-
stone to mudstone. In deeper water the progradation of
a sandy submarine fan lobe over muddier turbidites
may also mark a change in depositional style over a
wide area. Continuous reflectors therefore may be
seen as markers that indicate a significant, wide-
spread change in deposition in the basin. For this
reason, prominent reflectors are often considered to
represent time-lines, isochronous surfaces, within a
basin-fill succession, although care should be exer-
cised in making this assumption where there are
complex stratigraphic relationships or where reflec-
tors merge. Changes in depositional environment
usually occur over a period of time because events
such as transgressions that result in retrogradation of
facies (23.1.6) do not occur instantaneously.
Clinoforms
Inclined surfaces bounding stratal packages on seis-
mic reflection profiles are referred to as clinoforms
(Mitchum et al. 1977) and they form a pattern that
indicates a progradational geometry of packages of
sediment building out into deeper water. Depositional
slopes of a few degrees occur at delta fronts (especially
sandy or gravelly deltas: 12.4.4), on the edges of
clastic shelves and in carbonate environments, a
fore-reef slope may be 258 or more. The angle of the
clinoform seen on a seismic reflection profile may not
always represent the true depositional geometry, and
the angle may be enhanced by compaction in some
instances. Sandstone has a much lower initial poros-
ity than mudstone and therefore compacts to a lesser
degree on burial, so units that grade from sandstone
to mudstone would tend to taper distally upon
compaction, resulting in inclined surfaces on a large
scale.
Unconformities
An unconformity surface will not be represented by a
reflector unless there is a consistent change in lithol-
ogy across it to create an acoustic impedance con-
trast. In many cases, an unconformity may be
identified on a seismic reflection profile by the pres-
ence of reflector terminations, the points at which
relatively continuous reflectors end (Mitchum et al.
1977). Some terminations are not related to uncon-
formities (see below) but result from the shapes of the
stratal packages. The breaks in the sedimentary
record represented by unconformities are also often
considered to be time-lines within the stratigraphy,
but an unconformity may actually represent a series
of events over a period of time. There may be a long
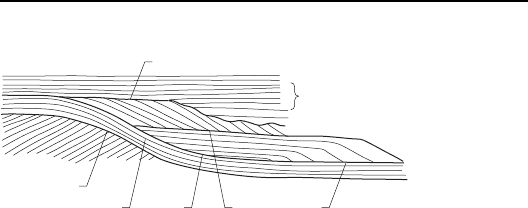
toplap
continuous
reflectors
erosional truncations
clinoforms
onlap
downlap
offlap
unconformity
Fig. 22.3 Reflector patterns and reflector relationships on
seismic reflection profiles.
Seismic Reflection Data 339

time period between the erosion and subsequent
deposition above the erosion surface and deposition
may not occur across the whole unconformity at one
time (see ‘onlap’ below).
Erosional truncation
If the surface of truncation is at a high angle to the
orientation of the layers it intersects, erosional trun-
cations are relatively easy to recognise (Fig. 22.3).
They are assumed to result from the removal of
packages of beds by subaerial or submarine erosion
and are most distinct where the underlying layers
have been uplifted and tilted prior to erosion. A trun-
cation surface caused by the incision of a river valley
into shelf strata following a sea-level fall may also be
recognised, but only if the incision is several tens of
metres and therefore enough to be resolved on seismic
profiles. Low-angle erosional truncations may be
difficult to identify.
Onlap
This relationship forms where there is a clear topo-
graphy at the edge of or within the basin. Reflectors
indicate that stratal packages are banked up against
this topography, with the younger layers successively
covering more of the underlying unit and sometimes
covering it completely. Geometries of this type may
form by the drowning of topography. Onlap relation-
ships are an example of an unconformity representing
multiple events through time: erosion may still be
continuing at the upper part of the underlying unit,
while deposition occurs further down dip on the sur-
face, and deposition above this unconformity is
clearly later at the top than at the bottom.
Downlap
This term is used to describe inclined surfaces that
terminate downwards against a horizontal surface.
This geometrical relationship is rarely seen in the
smaller scale of outcrop because steeply inclined bed-
ding surfaces are uncommon, although fore-reef
slopes (15.3.2) and Gilbert-type deltas (12.4.4) are
notable exceptions. Downlap surfaces seen on some
seismic reflection profiles may be due to a merging of
reflectors at the base of a clinoform slope where
thicker sandstone beds pass distally into thinner
mudrock units.
Toplap
Inclined reflectors that have upper surfaces that ter-
minate against a horizontal surface create a pattern
that is described as toplap (Fig. 22.3). This relation-
ship occurs where there is a succession of packages of
sediment that prograde basinwards, without any
aggradation.
Offlap
This relationship refers to a pattern of reflectors,
rather than a reflector termination. Offlap is a pattern
of stratal packages that build upwards and outwards
into the basin (Fig. 22.3).
22.2.6 Structural features on seismic
reflection profiles
A faul t surface is not often seen on a seismic line as
a dis tinct r eflector. Even if there is an acoustic imp e-
dance contrast across the fault, steeply dipping
structures are poorly imaged by conventional seis-
mic surveys because the reflected sound waves
return to the surface at a high angle and are not
picked up by th e recording array. Faults are nor-
mally recognised by the displacement of continuous
reflectors. If distinctive individual reflectors can be
recognised on both sides of the fault, the direction
and amount of displacement can be determined.
Folds can be identified on seismic profiles althoug h
steep limbs are p oorly imaged for the same reasons
as discussed for steep fault surfaces. The angles of
bedding or faults imaged on seismic reflection pro-
files are not always the true geometries and should
be interpreted with caution.
22.2.7 Seismic facies
The character of patterns of reflectors on seismic
reflection profiles can be used to make a preliminary
interpretation of rock type and depositional facies
(Mitchum et al. 1977; Friedman et al. 1992). For
example, continuous reflectors suggest an environ-
ment that is relatively stable with periodic changes,
such as a shelf affected by sea-level changes or a deep
basin with periodic progradation of submarine fan
lobes. In continental environments lateral facies
patterns tend to be complex as rivers change course
340 Subsurface Stratigraphy and Sedimentology

and widespread surfaces are less common so a discon-
tinuous reflector pattern results. Some lithologies are
characterised by an absence of parallel reflectors. For
example, salt and other evaporites tend to have a
‘chaotic’ pattern (random reflectors) or ‘transparent’
pattern (lacking internal reflectors). A basement of
metamorphic or igneous rocks generally lacks regular
reflectors. The geometry of units bounded by reflec-
tors can also give an indication of the depositional
setting. Estuarine or fluvial deposits may be underlain
by an erosional truncation and confined to a valley
fill. Large reefs may be picked out by their morphology
and chaotic to transparent internal reflectors.
The character of some units on a profile may give
some indication of the lithology and facies but inter-
pretation of the layers in terms of a stratigraphy of
rock units can be carried out with any confidence
only if the succession imaged has been drilled. The
seismic facies can then be related to the rock units
encountered in the borehole.
22.2.8 Interpretation of
three-dimensional data
Cubes of 3-D seismic reflection data and the comput-
ing power to manipulate and analyse these data have
made it possible to take interpretations much further
than is possible using 2-D profiles alone. For example,
horizontal slicing techniques have made it possible to
recognise and determine the shape of erosional fea-
tures such as fluvial and estuarine palaeovalleys, and
positive features such as reefs. Similarly, the depth of
the basement can be shown as a map if the contact
between the basement and the basin fill has been
identified across the area. Variations in the thickness
of a particular unit can also be shown as a map from
information about the position of the top and bottom
of that unit within the data cube.
In addition to providing information about geomet-
rical relationships, 3-D data can be used to provide
information about spatial variations of the rock or
fluid properties. One example of this is that a single
reflector can be traced through the cube and its inten-
sity mapped: variations in the intensity can be related to
lithological changes, such as a sandstone bed being
more muddy in one part of the area and hence showing
less of a contrast with an overlying mudrock unit. An
assessment of the fluid present can also be made because
the acoustic properties of a bed depend on both the
lithology and the fluid present in pore spaces: areas
where gas fills the pore spaces can be distinguished
from oil- or water-bearing rocks using this approach.
The possibilities offered by the manipulation of 3-D
seismic data cubes are considerable, but the interpre-
tations ultimately require corroboration by lithologi-
cal data from boreholes (see below). However, these
techniques make it possible to consider stratal units in
three-dimensions in a way that is rarely, if ever, pos-
sible from outcrop data alone. This has greatly
improved the understanding of large-scale stratigra-
phy and structure of sedimentary basins.
22.3 BOREHOLE STRATIGRAPHY
AND SEDIMENTOLOGY
The interpretation of seismic reflection profiles pro-
vides a model for the stratigraphic and structural
relationships that may exist in the subsurface. Data
from these sources can provide some indicators of the
lithologies in the subsurface, but a full geological
picture can be obtained only by the addition of infor-
mation on lithology and facies. This can be provided
by drilling boreholes through the succession and
either taking samples of the rocks and/or using geo-
physical tools to take detailed measurements of the
rock properties. When a borehole is drilled there are a
number of ways of collecting information from the
subsurface, and these are briefly described below.
22.3.1 Borehole cuttings
In the course of drilling a deep borehole, a fluid is
pumped down to the drill bit to lubricate it, remove
the rock that has been cut (cuttings) and to counter-
act formation fluid pressures in the subsurface. Due to
the weight of rocks above, fluids (water, oil and gas)
trapped in porous and permeable strata will be under
pressure, and without something to counteract that
pressure they would rush to the surface up the bore-
hole. The drilling fluid is therefore usually a ‘mud’,
made up of a mixture of water or oil and powdered
material, which gives the fluid a higher density: pow-
dered barite (BaSO
4
) is often used because this
mineral has a density of 4.48. The density of the
drilling mud is varied to balance the pressure in the
formations in the subsurface.
The drilling mud is recirculated by being pumped
down the inside of the drill string (pipe) and
Borehole Stratigraphy and Sedimentology 341
returning up the outside: because it is a dense, viscous
fluid, it will bring the cuttings with it as it reaches the
surface. The cuttings are filtered from the mud with a
sieve and washed to provide a record of the strata that
have been drilled. These cuttings are typically
1–5 mm in diameter and are sieved out of the drilling
mud at the surface. Recording the lithology of these
drill chips (mud-logging) provides information about
the rock types of the strata that have been penetrated
by the borehole, but details such as sedimentary
structures are not preserved. Microfossils such as
foraminifera, nanofossils and palynomorphs (20.5.3)
can be recovered from cuttings and used in biostrati-
graphic analysis. There is usually a degree of mixing
of material from different layers as the fluid returns up
the borehole, so it is the depth at which a lithology or
fossil first appears that is most significant.
22.3.2 Core
A drill bit can be designed such that it cuts an annu-
lus of rock away leaving a cylinder in the centre, a
core, that can be brought up to the surface. Where
coring is being carried out the drilling is halted and
the section of core is brought up to the surface in a
sleeve inside the hollow drill string. As each section of
core is brought to the surface it is placed in a box,
which is labelled to show the depth interval it was
recovered from. Recovery is often incomplete, with
only part of the succession drilled preserved, and the
core may be broken up during drilling. The core is then
usually cut vertically to provide a smooth-surfaced
slab of rock that is typically 90 mm to 150 mm across,
depending on the width of the borehole being drilled.
Cores cut in this way provide a considerable amount of
detail of the lithologies present, the small-scale sedi-
mentary structures, body and trace fossils.
In exploration for oil and gas and in the develop-
ment of fields for hydrocarbon production, cores are
cut through ‘target horizons’, that is, parts of the
succession that have been identified from the inter-
pretation of seismic interpretation as likely source
rocks, or, more importantly, reservoir bodies. Core is
usually only cut and recovered through these parts of
the stratigraphy: the rest of the succession has to be
interpreted on the basis of geophysical wireline logs
(22.4). However, continuous cores may be cut
through successions that cannot be interpreted
satisfactorily using geophysical information alone, as
can occur when the properties of the rock units do not
allow differentiation between different lithologies
using wireline logging tools.
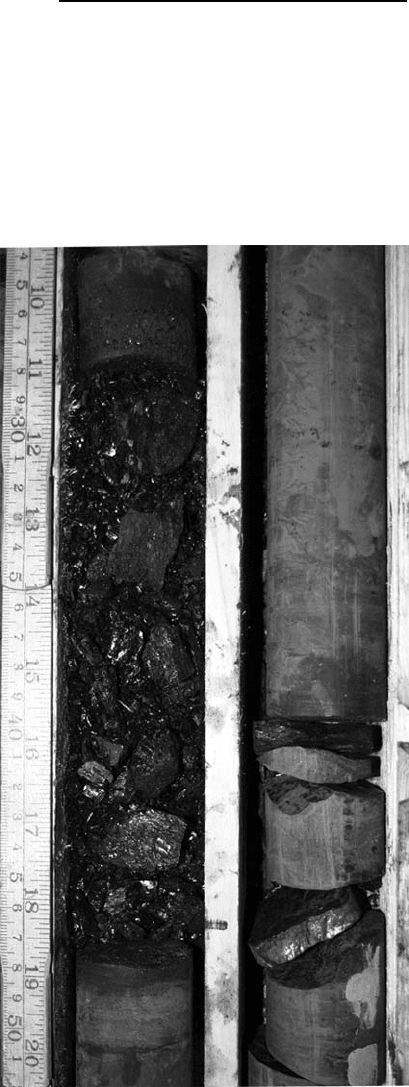
In contrast to oil and gas exploration, coal and
mineral exploration normally involves taking a com-
plete core through the section drilled. The width of the
core that is cut is smaller, often just 40 mm, and the
core is not split vertically (Fig. 22.4). The small size
Fig. 22.4 Cores cut by a drill bit and brought to the surface
provide information about subsurface strata.
342 Subsurface Stratigraphy and Sedimentology

and the curved surface of the core may make it more
difficult to recognise sedimentary structures than in
the conventional, larger, split core used in oil and gas
exploration, but the continuous core provides good
vertical coverage of the drilled succession.
22.2.3 Core logging
The procedure for recording the details of the sedi-
mentary rocks in a core is very similar to making a
graphic sedimentary log of a succession exposed in
the field. Core logging sheets are similar in format to
field logging sheets (Fig. 5.3), and the same types of
information are recorded (lithology, bed thickness,
bed boundaries, sedimentary structures, biogenic
structures, and so on). The scale is usually 1:20 or
1:50. In some ways recording information about
strata from core is easier than field description. If the
core recovery is good then there will be an almost
complete record of the succession, including the finer
grained lithologies. Weathering of mudrocks in the
field usually means that they are less well preserved
than the coarser beds, but in core this tends to be less
of a problem, although weaker, finer grained beds will
often break up more during the drilling. The main
limitations are those imposed by the width of the
core. It is not possible to see the lateral geometry of
the beds and recognise features such as channels
easily, and only parts of larger scale sedimentary
structures are preserved. On the other hand, the
details of ripple-scale features may be more easily
seen on the smooth, cut surface of a core. Palaeocur-
rent data can be recorded from sedimentary struc-
tures only if the orientation of the core has been
recorded during the drilling process, and this is not
always possible. The other, not insignificant, differ-
ence between core and outcrop is that the geologist
can carry out the recording of data in the relative
comfort of a core store, although it is unlikely to be
such an interesting environment to work in as a field
location in an exotic place.
Not all cores pass through the strata at right angles
to the bedding. If the strata are tilted then a vertical
drill core will cut through the beds at an angle, so all
bed boundaries and sedimentary structures observed
in the core will be inclined. During the development
phase of oil and gas extraction, drilling is often direc-
ted along pathways (directional drilling) that can be
at any angle, including horizontal. Interpretation of
inclined and near-horizontal cores therefore requires
information about the angle of the well.
22.4 GEOPHYSICAL LOGGING
There is a wide range of instruments, geophysical
logging tools, that are lowered down a borehole to
record the physical and chemical properties of the
rocks. These instruments are mounted on a device
called a sonde that is lowered down the drill hole
(on a wireline) once the drill string has been
removed. Data from these instruments are recorded
at the surface as the sonde passes up through the
formations (Fig. 22.5). An alternative technique is to
fix a sonde mounted with logging instruments behind
the drill bit and record data as drilling proceeds.
The tools can be broadly divided into those that are
concerned with the petrophysics of the formations,
that is, the physical properties of the rocks and the
fluids that they contain, and geological tools that
provide sedimentological information. The interpreta-
tion of all the data is usually referred to as formation
evaluation – the determination of the nature and
properties of formations in the subsurface. A brief
introduction to some of the tools is provided below
(see also Fig. 22.6), while further details are provided
wireline
sonde carrying
geophysical
instruments
strata
Fig. 22.5 Geophysical instruments are normally mounted
on a sonde that passes through formations on the end of a
wireline.
Geophysical Logging 343
in specialist texts such as Rider (2002). Many of these
tools are now used in combinations and provide an
integrated output that indicates parameters such as
sand:mud ratio, porosity, permeability and hydrocar-
bon saturation.
22.4.1 Petrophysical logging tools
Caliper log
The width of the borehole is initially determined by
the size of the drill bit used, but it can vary depending
on the nature of the lithology and the permeability of
the formation (Fig. 22.7). The borehole wall may cave
in where there are less indurated lithologies such as
mudrocks, and this can be seen as an anomalously
wide interval of the hole. The caliper log can also
detect parts of the borehole where the diameter is
reduced by the accumulation of a mud cake on the
inside: mud cakes are made up of the solid suspension
in the drilling mud and form where there is a porous
and permeable bed that allows the drilling fluid to
penetrate, leaving the mud filtered out on the bore-
hole wall.
Gamma-ray log
This records the natural gamma radioactivity in the
rocks that comes from the decay of isotopes of potas-
sium, uranium and thorium. The main use of this tool
is to distinguish between mudrocks, which generally
have a high potassium content and hence high nat-
ural radioactivity, and sandstone and limestone, both
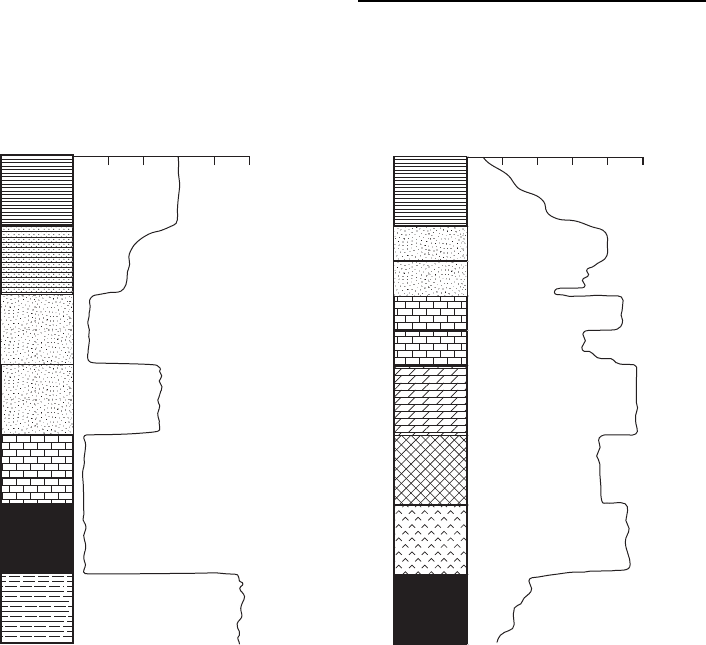
shale
sand
limestone
coal
feldspathic or
micaceous sand
bituminous
shale
mixture of
sand and shale
Natural gamma radioactivity (API units)
0 20 100806040
Gamma-ray logLithology
high K
content
high U
content
high K
content
Interval transit time (msft
1
)
140 120 406080100
Sonic logLithology
very variable,
depends on
compaction
=57
depends on
porosity
variable
=52
=44
=67
=50
depends on
porosity
shale
halite
anhydrite
compact
sandstone
porous
sandstone
compact
limestone
porous
limestone
dolomite
coal
(a) (b)
Fig. 22.6 (a) Determination of lithology using information provided by a gamma-ray logging tool. (b) Determination of
lithology and porosity using information provided by a sonic logging tool. (From Rider 2002.)
344 Subsurface Stratigraphy and Sedimentology
of which normally have a lower natural radioactivity.
The gamma-ray log is often used to determine the
‘sand: shale ratio’ in a clastic succession (note that
for petrophysical purposes, all mudrocks are called
‘shales’). However, it should be noted that mica, feld-
spar, glauconite and some heavy minerals are also
radioactive, and sandstones rich in any of these can-
not always be distinguished from mudstones using
this tool. Organic-rich rocks can also be detected
with this tool because uranium is often naturally
associated with organic matter. Mudrocks with high
organic contents are sometimes referred to as ‘hot
shales’ because of their high natural radioactivity.
The spectral gamma-ray log records the radio-
activity due to potassium, thorium and uranium
separately, allowing the signal due to clay minerals
to be separated from radioactivity associated with
organic matter.
Resistivity logs
Resistivity logging tools are a range of instruments
that are used to measure the electrical conductivity of
the rocks and their pore fluids by passing an electrical
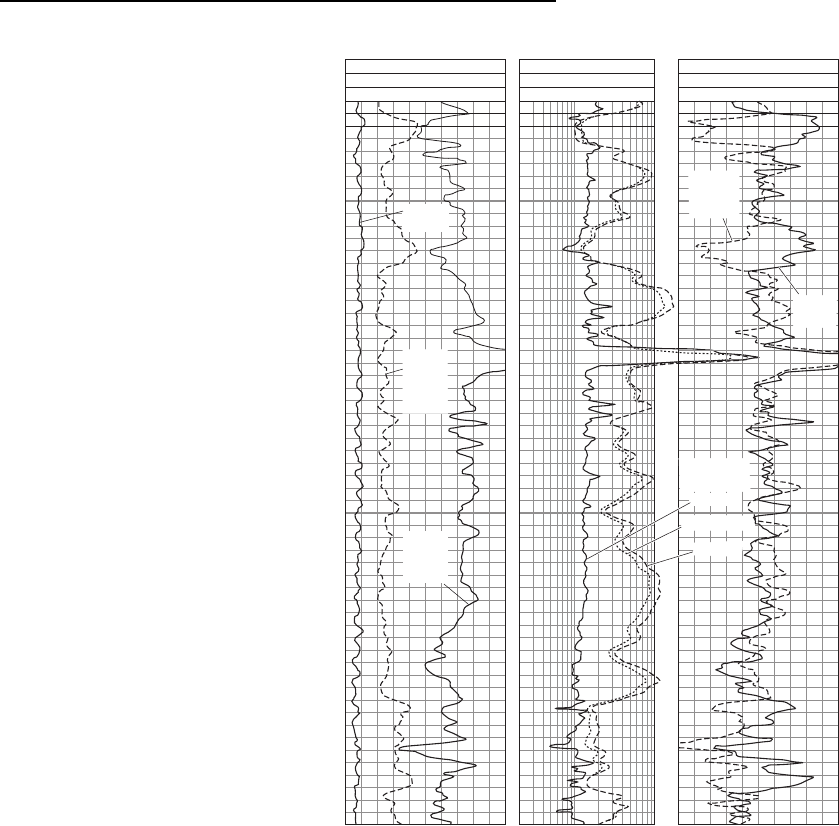
Fig. 22.7 Wireline logging traces
produced by geophysical logging tools.
800
850
90SONIC140
200GAMMA RAY0
18CALIPER8
20MICRO0.2
20DEEP
20SHALLOW0.2
2.45DENSITY1.95
15NEUTRON POROSITY45
Depth (m)
caliper
(inches)
gamma
ray
(API
units)
sonic
transit
time
(msft
1
)
density
(g cm
3
)
MICRO
SHALLOW
DEEP
resistivity
(ohm m
2
m
1
)
porosity
(porosity
units)
0.2
Geophysical Logging 345

current from one part of the sonde, through the rocks
of the borehole wall measuring the current at another
part of the sonde. Most minerals are poor conductors,
with the exception of clay minerals that have charged
ions in their structures (2.4.3). The resistivity
measurements provide information about the compo-
sition of the pore fluids because hydrocarbons and
fresh water are poor electrical conductors but saline
groundwater is a good conductor of electricity. Resis-
tivity logging tools are usually configured so that they
are able to measure the resistivity at different dis-
tances into the formation away from the borehole
wall. A microresistivity tool records the properties
at the borehole wall, a ‘shallow’ log measures a short
distance into the formation and a ‘deep’ log records
the current that has passed through the formation
well away from the borehole (these are sometimes
called laterologs). Comparison of readings at differ-
ent distances from the borehole wall can provide an
indication of how far the drilling mud has penetrated
into the formation and this gives a measure of the
formation permeability. Induction logs are resistivity
tools that indirectly generate and measure the elec-
trical properties by the process of induction of a
current.
Sonic log
The velocity of sound waves in the formation is deter-
mined by using a tool that comprises a pulsing sound
source and receiver microphone that records how
long it has taken for the sound to pass through the
rock near the borehole. The sonic velocity is depen-
dent upon two factors. First, lithologies composed
of high-density material transmit sound faster than
low-density rocks: for example, coal is a low-density
material, basalt is high-density, and sandstones and
limestones have intermediate densities. Second, if the
rock is porous, the bulk density of the formation will
be reduced, and hence the sonic velocity, so if the
lithology is known, the porosity can be calculated,
or vice versa. The velocities determined by this tool
can be used for depth conversion of seismic reflection
profiles.
Density logs
These tools operate by emitting gamma radiation and
detecting the proportion of the radiation that returns
to detectors on the tool. The amount of radiation
returned is proportional to the electron density of
the material bombarded and this is in turn propor-
tional to the overall density of the formation. If the
lithology is known, the porosity can be calculated
as density decreases with increased porosity. The
application of this tool is therefore very similar to
that of the sonic logging tool.
Neutron logs
In this instance the tool has a source that emits
neutrons and a detector that measures the energy of
returning neutrons. Neutrons lose energy by colliding
with a particle of similar mass, a hydrogen nucleus, so
this logging tool effectively measures the hydrogen
concentration of the formation. Hydrogen is mostly
present in the pore spaces in the rock filled by forma-
tion fluids, oil or water (which have approximately
the same hydrogen ion concentration) so the neutron
log provides a measure of the porosity of the forma-
tion. However, clay minerals contain hydrogen ions
as part of the mineral structure, so this tool does not
provide a reliable indicator of the porosity in
mudrocks or muddy sandstones or limestones.
Electromagnetic propagation log
The dielectric properties of the formation fluids are
measured with this tool. It consists of microwave
transmitters that propagate a pulse of electromag-
netic energy through the formation and measures
the attenuation of the wave with receivers. The mea-
surements are related to the dielectric constant of the
formation, which is in turn determined by the
amount of water present. The tool therefore can be
used to distinguish between oil and water in porous
formations.
Nuclear magnetic resonance logs
Conventional porosity determination techniques do
not provide information about the size of the pore
spaces or how easily the fluid can be removed from
those pores. Fluids that are bound to the surface of
grains by capillary action cannot easily be removed
and are therefore not producible fluids, and if pore
spaces are small more fluid will be bound into the
formation. The nuclear magnetic resonance (NMR)
tool works by producing a strong magnetic field that
polarises hydrogen nuclei in water and hydrocarbons.
346 Subsurface Stratigraphy and Sedimentology

When the field is switched off the hydrogen nuclei
relax to their previous state, but the rate at which
they do so, the relaxation time, increases if they inter-
act with grain surfaces. Measurement of the electro-
magnetic ‘echo’ produced during the relaxation
period can thus be used as a measure of how much
of the fluid is ‘free’ and how much of it is close to, and
bound on to, grain surfaces. The tool operates by
producing a pulsed magnetic field and measuring
the echo many times a second.
22.4.2 Geological logging tools
Dipmeter log
The sonde for this tool has four or six separate devices
for measuring the resistivity at the borehole wall.
They are arranged around the sonde so that if there
is a difference in the resistivity on different sides of the
borehole, this will be detected. If the layering in the
formations is inclined due to a tectonic tilt or cross-
stratification it is possible to detect the degree and
direction of the tilt by comparing the readings of the
different, horizontal resistivity devices. Hence this tool
has the potential to measure the sedimentary or tec-
tonic dip of layering.
Microimaging tools
These tools, often called borehole scanners, are also
resistivity devices and use a large number of small
receiving devices to provide an image of the resistivity
of the whole borehole wall. If there are fine-scale
contrasts in electrical properties, for instance where
there are fine alternations of clay and sand, it is
possible to image sedimentary structures as well as
fractures in the rock. The images generated super-
ficially resemble a photograph of the borehole wall,
but is in fact a ‘map’ of variations in the resistivity.
Ultrasonic imaging logs
High-resolution measure ments of the acoustic
properties of the formations in the borehole walls
are made by a rotatin g transmitter that emits an
ultrasonic pulse and then records the reflected
pulse with a receiver. The main use of this tool is
to detect how uneven the borehole wall is, and this
can be related to both lithology and the presence o f
fractures.
22.4.3 Sedimentological interpretation
of wireline logs
It is common for the interpretation of subsurface for-
mations to be based very largely on wireline log data,
with only a limited amount of core information being
available. Modern systems often provide a large
amount of ‘automatic’ interpretation of the data, but
there is nevertheless a requirement for sedimentologi-
cal interpretation based on an understanding of sedi-
mentary processes and facies analysis.
Certain lithologies have very distinctive log
responses that allow them to be readily distinguished
in a stratigraphic succession. Coal, for example, has a
low density that makes it easily recognisable in a
succession of higher density sandstones and mud-
stones (Fig. 22.6). A bed of halite may also be picked
out from a succession of other evaporite deposits and
limestones because it is also relatively low density.
Igneous rocks such as basalt lavas have markedly
higher densities than other strata. Organic-rich
mudrocks have high natural gamma radioactivity
that allows them to be distinguished from other beds,
especially if a spectral gamma-ray tool is used to pick
out the high uranium content. However, many com-
mon lithologies cannot easily be separated from each
other using these tools, including quartz sandstone
and limestone, which have similar densities, natural
radioactivity and electrical properties. Information
from cuttings and core is therefore often an essential
component of any lithological analysis.
The gamma-ray log is the most useful tool for sub-
surface facies analysis as it can be used to pick out
trends in lithologies (Fig. 22.8). An increase in
gamma value upwards suggests that the formation
is becoming more clay-rich upwards, and this may
be interpreted as a fining-up trend, such as a channel
fill in a fluvial, tidal or submarine fan environment.
A coarsening-up pattern, as seen in prograding clastic
shorelines, shoaling carbonate successions and sub-
marine fan lobes may be recorded as a decrease in
natural gamma radiation upwards. A drawback of
using these trends is that they are not unique to
particular depositional settings and other information
will be required to identify individual environments.
Borehole imaging tools (scanners) provide centimetre-
scale detail of the beds in the borehole and can allow
sedimentary structures such as cross-bedding, hori-
zontal laminae, wave and ripple lamination to be
recognised. Detailed facies analysis can therefore be
Geophysical Logging 347