Furusawa A., van Loock P. Quantum Teleportation and Entanglement: A Hybrid Approach to Optical Quantum Information Processing
Подождите немного. Документ загружается.

250 6 Quantum Teleportation of Gates
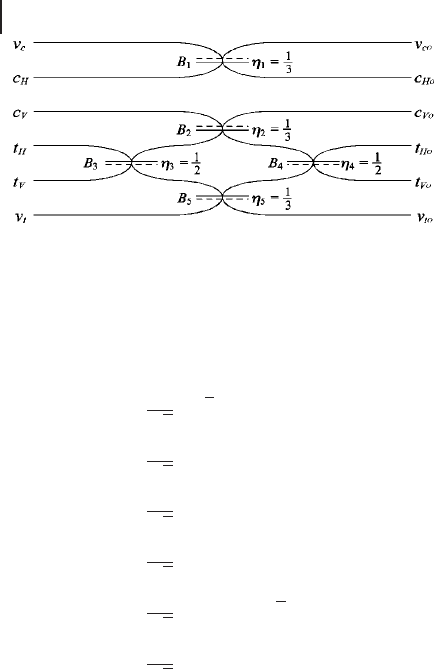
Figure 6.5 A schematic of conditional CNOT
gate proposed by Ralph et al. [274]. B
i
is a
beam splitter whose reflectivity is η
i
.Thecon-
trol qubit is represented by modes C
H
and
C
V
with the dual-rail fashion, and the target
qubit is represented by modes t
H
and t
V
.The
modes v
c
and v
t
are ancillary vacuum inputs.
follows [274],
Oa
C
H
out
D
1
p
3
p
2 Oa
v
c
in
COa
C
H
in
,
Oa
C
V
out
D
1
p
3
Oa
C
V
in
COa
t
H
in
COa
t
V
in
,
Oa
t
H
out
D
1
p
3
Oa
C
V
in
COa
t
H
in
COa
v
t
in
,
Oa
t
V
out
D
1
p
3
Oa
C
V
in
COa
t
V
in
Oa
v
t
in
,
Oa
v
c
out
D
1
p
3
Oa
v
c
in
C
p
2 Oa
C
H
in
,
Oa
v
t
out
D
1
p
3
Oa
t
H
in
Oa
t
V
in
Oa
v
t
in
, (6.2)
where the control qubit is represented by modes C
H
and C
V
with the dual-rail
fashion, and the target qubit is represented by modes t
H
and t
V
.Themodesv
c
and
v
t
are ancillary vacuum inputs.
The general input state to the gate (the control and target qubits) can be described
in the Schrödinger picture as
jψi
in
D
(
αjHHiCβjHViCγjVHiCδjVVi
)
j00i
D
α Oa
†
C
H
in
Oa
†
t
H
in
C β Oa
†
C
H
in
Oa
†
t
V
in
C γ Oa
†
C
V
in
Oa
†
t
H
in
Cδ Oa
†
C
V
in
Oa
†
t
V
in
j0000ij00i , (6.3)
wheretheorderingintheketsisjn
C
H
in
n
C
V
in
n
t
H
in
n
t
V
in
ijn
v
c
in
n
v
t
in
i with On
C
H
in
D
Oa
†
C
H
in
Oa
C
H
in
,andsoon,andweusej1010iDjHHi,andsoon,whereappropriate.

6.1 Teleporting Qubit Gates 251
Thus, we can derive the output state of the beam splitter network by using
Eqs. (6.2) and (6.3),
jψi
out
D
α Oa
†
C
H
out
Oa
†
t
H
out
C β Oa
†
C
H
out
Oa
†
t
V
out
C γ Oa
†
C
V
out
Oa
†
t
H
out
Cδ Oa
†
C
V
out
Oa
†
t
V
out
j0000ij00i
D
1
3
n
[
αjHHiCβjHViCγ jVViCδjVHi
]
j00i
C
p
2(α C β)j0100ij10iC
p
2(α β)j0000ij11i
C (α C β)j1100ij00iC(α β)j1000ij01i
C
p
2αj0010ij10iC
p
2βj0001ij10i
p
2(γ C δ)j0200ij00i(γ δ)j0100ij01i
C
p
2γ j0020ij00iC(γ δ)j0010ij01i
C (γ C δ)j0011ij00iC(γ δ)j0001ij01i
C
p
2δj0002ij00i
o
. (6.4)
From this result, we obtain (after renormalization)
jψi
post-select
D αjHHiCβjHViCγjVViCδjVHi , (6.5)
by measuring jn
v
c
out
n
v
t
out
iDj00i, exactly one photon in total for fn
C
H
out
, n
C
V
out
g,
and the same for fn
t
H
out
, n
t
V
out
g. These patterns can be postselected in the experi-
ment and they occur with a success probability of 1/9. The state of Eq. (6.5) is the
CNOT output for the input of Eq. (6.3); the target qubit only flips when the control
qubit is V.
O’Brien et al. realized this postselected gate as shown in Figure 6.4c. The two
input polarization qubits are converted to spatial dual-rail qubits using the trick
shown in Figure 6.4b. Then, the dual-rail qubits enter a beam splitter network, as
depicted in Figure 6.4a (Figure 6.5), which is implemented with half wave plates
(HWPs) and polarization beam splitters (PBSs). Especially, a 1/2-beam splitter is
realized through a polarization rotation by 45
ı
(HWP rotation by 22.5
ı
)anda1/3-
beam splitter is realized by means of a polarization rotation by 125
ı
(HWP rotation
by 62.5
ı
), where
p
1/3 ' cos 125
ı
.
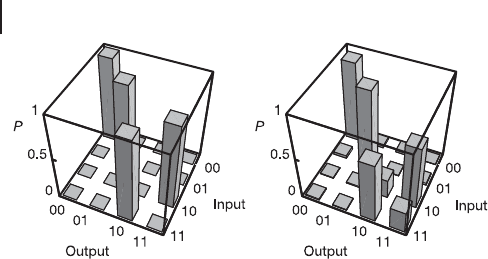
Figure 6.6 shows the experimental results for the CNOT gate operation as it was
demonstrated by O’Brien et al. [273]. The results agree well with the ideal opera-
tion of the gate. Note that postselection was a crucial part of this experiment. In
particular, the protocol for this gate implementation (achieving a gate efficiency of
1/9) relies upon a final step that inclu des destroying the two-qubit output state of
the gate. More precisely, it is absolutely necessary to detect (and hence destroy) the
photon number states of all six modes in Eq. (6.4) in order to accomplish the gate
operation; including postselection in the gate output ports themselves.
In this sense, the current CNOT gate is a destructive gate, conceptually different
from, for example, those gates obtainable in the KLM scheme. There, the output
252 6 Quantum Teleportation of Gates
(a) (b)
Figure 6.6 Experimental results for the CNOT gate operation demonstrated by O’Brien
et al. [273]. (a) Ideal logical basis operation of a CNOT gate. (b) Measured operation of the gate.
ports need not be detected and the two-qubit output state of the gate can be further
exploited in subsequent quantum circuits, potentially leading to a fully scalable
quantum computation.
However, the KLM two-qubit entangling gate is much harder to implement ex-
perimentally; and, again from a conceptual point of view, the KLM gates represent-
ing non-destructive gates are fundamentally limited in their efficiencies depending
on the resources employed. Here, the bounds on the nondestructive gates are nat-
urally lower than those on the destructive gates. For instance, the nondeterministic
implementation of a non-destructive CNOT gate according to KLM achieves an ef-
ficiency of 1/16, and this value is near 2/27, which is conjectured to be the theoreti-
cal optimum when no feedforward operations are permitted (like in the destructive
gate protocol described above).
6.2
Teleporting Qumo d e Gates
6.2.1
Experiment: Gaussian Qumode Gates
6.2.1.1 Universal Squeezer
In this section, we will describe a universal squeezer as an example for off-line
Gaussian quantum information processing on qumodes, focusing on the experi-
ment demonstrated by Yoshikawa et al. [275] based upon the theoretical proposal
by Filip et al. [276].
The implementation of a direct nonlinear quantum operation is often hampered
by decoherence due to inevitable practical imperfections in physical systems. Be-
cause of the necessity of invoking such unitary transformations in a fault-tolerant
quantum information processor, the future of developing such units was not too
bright. However, new optimism arose from the introduction of the so-called off-line
schemes where a n onlinear transformation is executed on a quantum state through
simple linear interference with some off-line prepared ancillas followed by detec-
6.2 Teleporting Qumode Gates 253
tion and feedforward [84, 170, 242, 249, 268]. The significance of that approach is
that the nonlinear transformation need not be performed directly onto the fragile
quantum state, but is accomplished by tailoring the off-line resource states that can
be prepared at anytime.
The first simple example of such an off-line scheme is teleportation which
demonstrates the implementation of the most trivial unitary quantum opera-
tion [17, 163, 277], namely, the identity operation: The off-line resource is a bipar-
tite entangled state which is detected jointly with the fragile quantum information
in a Bell measurement and the classical outcomes are fed forward to achieve the
identity (or teleportation) operation. Remarkably, it was found that by manipul at-
ing the off-line entangled state in the teleporter, it is possible to implement any
unitary transformation through teleportation. This was first realized for qubits [84]
and subsequently used in the linear optical quantum computer [242], and later
extended to continuous variables (CVs) which benefit from the practical CV Bell
measurement [268].
Such a teleportation-based off-line scheme can, for example, be used for the im-
plementation of a squeezing operation. It was however proposed in [276] that a
EOM
EOM
-
-
99:1
50:50
PBS
PBS
HWP
LO
displacement
classical
channel
pump OPO
squeezed vacuum
input
50:50
LO
output
squeezing
operation
input
squeezed
vacuum
ancilla
squeezed
output
Disp
beam
splitter
entangled
measurement
feedforward
(a)
(b)
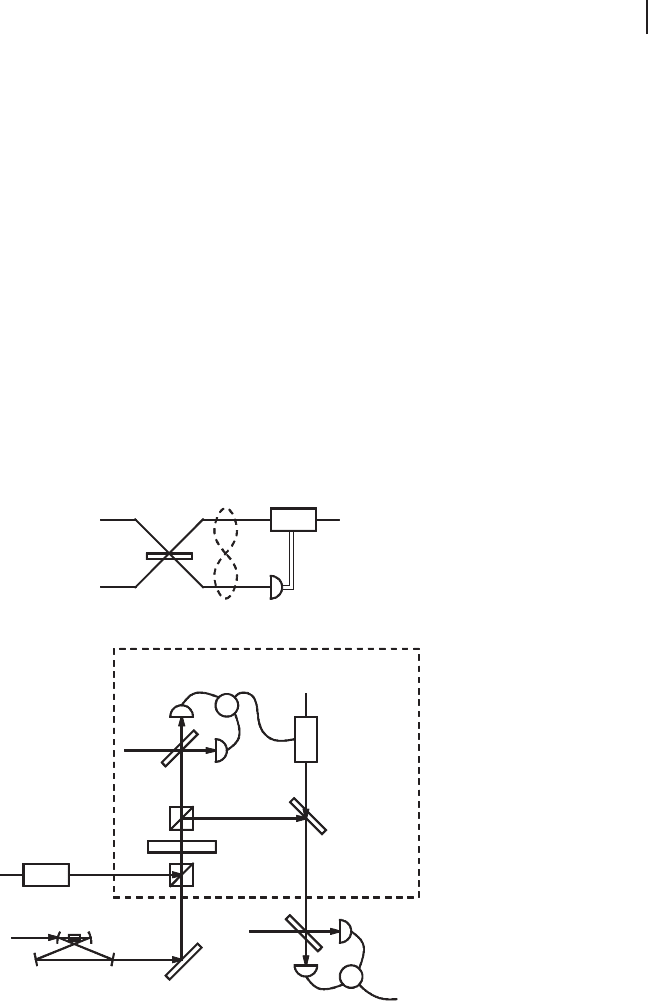
Figure 6.7 (a) Schematic of high-fidelity
squeezing [275]. (b) Experimental setup for
high-fidelity squeezing [275]. A variable beam
splitter is realized by a half-wave plate (HWP)
and two polarizing beam splitters (PBS).
EOM: electro-optic modulator, LO: local os-
cillator, OPO: optical parametric oscillator.

254 6 Quantum Teleportation of Gates
much simpler off-line scheme relying only on a single vacuum squeezed ancilla
suffices to implement the squeezing operation (see Figure 6.7a). In essence, this
simple setup allows for the experimentally feasible and noise-resistant squeezing
transformation of optical quantum states, and it can be seen as the CV analog to
the one-qubit teleportation approach in [278].
The single-mode squeezer is ideally described by a single-mode LUBO trans-
formation (see Chapter 2) which maps the input Wigner function W(x, p )on-
to W
0
(x, p) D W(xe
r
, p e
r
)wherex and p represent the amplitude and phase
quadrature of the field and r is the squeezing factor. Although this simple trans-
formation is standard in any text book on quantum optics, its experimental re-
alization for arbitrary inputs (that is quantum information) remained extremely
challenging. Previously demonstrated squeezing transformations either were suf-
fering from large decoherence (as is the case for fiber or cavity implementations),
thus corrupting the fragile quantum information of a quantum state, or were using
an input dependent nondeterministic approach [279]. In contrast to previous im-
plementations, the squeezing transformation explained here is deterministic and
it processes quantum information with very high fidelity.
The scheme is illustrated in Figure 6.7 and goes as follows. The input state under
interrogation is combined with a squeezed vacuum at a beam splitter. A quadrature
to be anti-squeezed is measured using homodyne detection, and after appropriate
rescaling of the outcomes the remaining field is displaced accordingly. Mathemat-
ically, the transformation can be easily derived in the Heisenberg picture. First, we
consider the input–output relations for the beam splitter:
Ox
0
i
D
p
T Ox
i
C
p
1 T Ox
a
, (6.6)
Op
0
i
D
p
T Op
i
C
p
1 T Op
a
, (6.7)
Ox
0
a
D
p
T Ox
a
p
1 T Ox
i
, (6.8)
Op
0
a
D
p
T Op
a
p
1 T Op
i
, (6.9)
where Ox and Op represent the quadratures to be squeezed and anti-squeezed, the
indices “i” and “a” refer to the input and ancillary mode, respectively, and T is the
transmittance of the beam splitter. The quadratures of the ancilla are written as
( Ox
a
, Op
a
) D ( Ox
(0)
a
e
r
a
, Op
(0)
a
e
r
a
)wherer
a
is the squeezing parameter and Ox
(0)
a
and Op
(0)
a
represent vacuum fluctuations. In the reflected part, the quadrature Op
0
a
is measured
using homodyne detection. The measurement outcomes are subsequently rescaled
by a factor denoted by g and finally used to displace the remaining part of the
system which is equivalent to the transformation Ox
0
i
!Ox
00
i
DOx
0
i
and Op
0
i
!Op
00
i
D
Op
0
i
C g Op
0
a
. By choosing g D
p
(1 T)/T, we arrive at the following input–output
relations
Ox
00
i
D
p
T Ox
i
C
p
1 T Ox
(0)
a
e
r
a
, (6.10)
Op
00
i
D
1
p
T
Op
i
. (6.11)

6.2 Teleporting Qumode Gates 255
In the limit of the infinitely squeezed ancilla corresponding to r
a
!1,the
transformation coincides with perfect unitary squeezing operation with the actual
squeezing parameter r Dln
p
T which is directly controlled by the transmit-
tance of the beam splitter. Furthermore, the quadrature being squeezed can also
be easily controlled through adjustment of the relative phase between the signal
and the squeezed ancilla and correspondingly the measured quadrature in the
feedforward loop [276]. Therefore, full control of the squeezing process is accessed
through simple operations on linear passive devices. Let us note that by changing
some of the settings of the setup (such as the local oscillator phase, the feedfor-
ward gain and the ancilla state), the setup can function as a non-unitary noiseless
amplifier [280], a non-unitary quantum nondemolition measurement device [281]
or as a squeezed state purifier [282].
In a realistic situation, the ancilla state is not infinitely squeezed and some extra
quantum noise will inevitably be added to the squeezed quadrature as indicated
by the second term in Eq. (6.10). Note that the noise suppression performance
never goes further than that of the ancilla. In contrast, the imperfections of the
ancilla state do not degrade the quality of the transformation of th e anti-squeezed
quadrature as well as the mean values: The excess noise of the ancilla is not coupled
intothemodenordoesitdisturbthemeanvaluetransformation.
The operation described above is universal and thus squeezes all input states.
In the following experimental investigation, however, the squeezing of particular
states is considered, namely, coherent states. To ensure that the coherent states
are truly pure, they are defined as a sideband at a radio-frequency relative to the
carrier of a laser beam. This beam as well as other auxiliary beams are delivered by
a Ti:sapphire laser operating at 860 nm. The experiment is divided in three parts;
preparation, processing and verification which will now be discussed.
Preparation: In the preparation stage, the input coherent state and the squeezed
ancilla state are generated. The coherent state is prepared by traversing a part of
the laser beam through an electro-optic modulator operating at 1 MHz and set to
modulate the amplitude and phase simultaneously. As a result, a true coherent
state is generated at a 1 MHz sideband and the bandwidth is assumed to be 30 kHz.
The power of the optical carrier is about 3 µW, whereas the power of the sideband is
about 15 dB above the corresponding shot noise level. The ancillary squeezed state
is produced in an optical parametric oscillator (OPO). It is a 500 mm long bow-
tie shaped cavity consisting of two plane mirrors and two mirrors with a 50 mm
radius of curvature. The nonlinear crystal is a 10 mm periodically-poled KTiOPO
4
(PPKTP) crystal (see [283] for details). The OPO is pumped with light at 430 nm,
stemming from a second harmonic generator with the same configuration as the
OPO cavity but with a KNbO
3
crystal. The second harmonic generator is pumped
with the light from the Ti:sapphire laser. To monitor and lock the squeezing phase,
we inject a weak coherent beam to the OPO. The output from the OPO and the
coherent state are then directed to the processing part. They have 97 and 143 kHz
modulation sidebands for phase locking.
Processing: At this stage the actual squeezing transformation is implemented.
First, the two states from the preparation stage merge at a variable beam splitter

256 6 Quantum Teleportation of Gates
composed of a half wave plate (HWP) sandwiched between two polarizing beam
splitters (PBS). The beam splitting ratio is thus easily controlled via a wave plate
rotation. One output of the beam splitter is directed to a homodyne detector which
measures the p quadrature. The visibility between the output and a local oscilla-
tor is 96% and the quantum efficiency of the detectors is more than 99%. The
measurement outcomes are amplified electrically in a low-noise amplifier and sub-
sequently used to drive a phase modulator which displaces an auxiliary beam in
phase space. Finally, the displacement of the signal is achieved by combining it
with the displaced auxiliary field using a highly asymmetric beam splitter ( 99/1).
Verification: In the final stage of the experiment, the protocol is verified by mea-
suring the input states as well as the squeezed output states. The states are fully
characterized by balanced homodyne detection. The visibility between the squeezed
output beam and a local oscillator is 96% and the total propagation efficiency is
96%. The electronic noise is always 19 dB smaller than the optical noise. After de-
tection, the photocurrents are used to reconstruct the quantum states: The 1 MHz
component of the measured output signal is extracted by means of a lock-in detec-
tion scheme. The signal is mixed with a 1 MHz sine-wave signal from a function
generator, low pass filtered (30 kHz) and finally digitized and fed into a computer
with the sampling rate of 300 kHz.
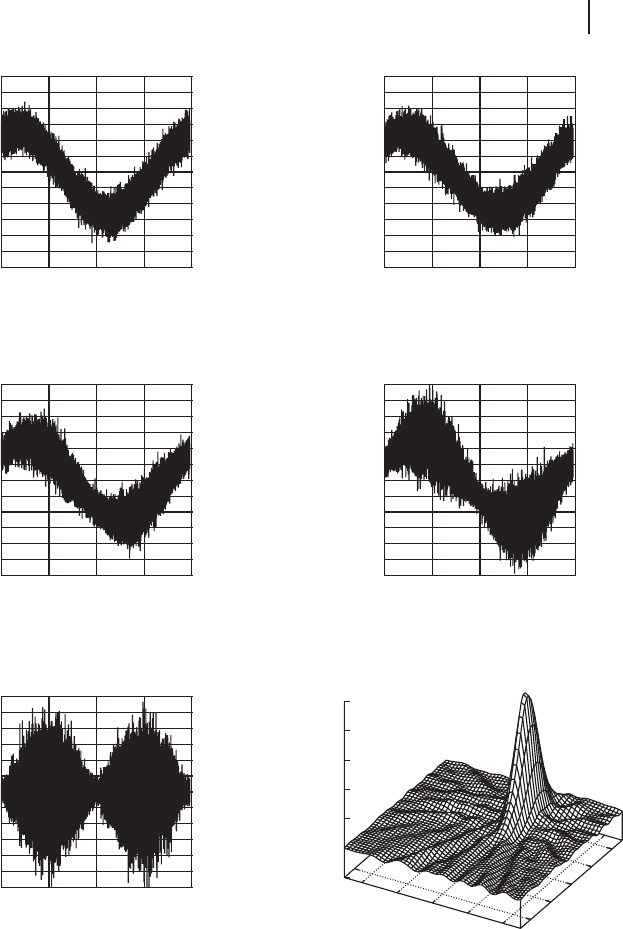
Figure 6.8 shows the raw data of the time resolved measurements of the input
states and the output states. The time series for the input coherent states (Fig-
ure 6.8a) and the vacuum squeezed states (Figure 6.8e) are measured by adjust-
ing the beam splitter t ransmittance to unity and zero, respectively (and blocking
the displacement beam). Then, the squeezing transformation is activated and the
time series for three different transmittances, namely, 0.75, 0.50, and 0.25, are
measured, the results of which are shown in Figure 6.8b–d respectively. It is ev-
ident from the plots that the input coherent states become more and more de-
formed as the transmittance decreases (and thus the squeezing degree increases).
In Figure 6.8f, the reconstructed Wigner function of the transformed states with
T D 0.25 is presented.
As indicated by the reconstructed Wigner function, the involved states are Gaus-
sian. With this a priori information, the states are completely characterized by the
first two moments. Due to the symmetry of the states (squeezed in x and anti-
squeezed in p), it suffices to evaluate the mean values and variances of x and p.
Results of such evaluations are shown in Figures 6.9 and 6.10.
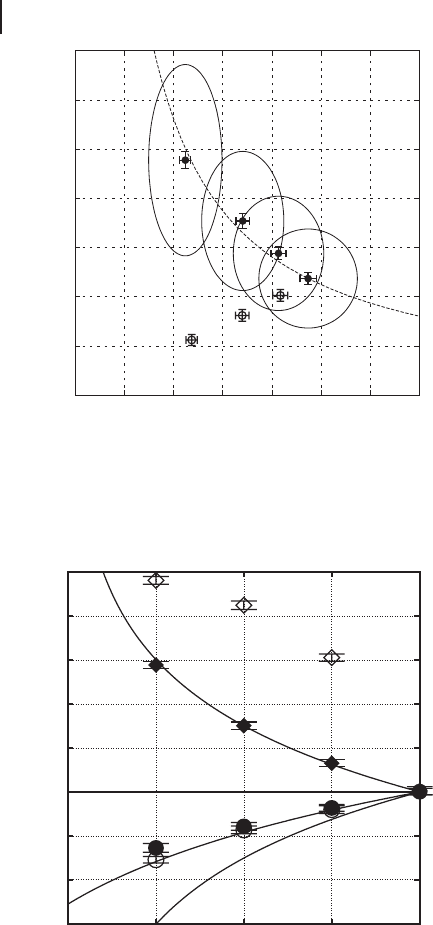
In Figure 6.9, the phase space diagrams of the input coherent states as well as
the output states are shown by ellipses which correspond to the cross sections of
their respective Wigner functions. When a coherent state is unitarily squeezed, the
amplitude is transformed along a hyperbolic curve, as shown by the dotted line. The
four ellipses correspond to (from the right) the input coherent states, the squeezed
outputs with T D 0.75, T D 0.50, T D 0.25, respectively, and their centers, marked
by dots, represent the measured averages. The circles represent the data obtained
without the feedforward. The lengths of the major and minor axes of the ellipses
are the measured standard deviations of x and p.Obviously,themeanvaluesare
transformed almost ideally.
6.2 Teleporting Qumode Gates 257
-6
-5
-4
-3
-2
-1
0
1
2
3
4
5
6
0 0.5 1 1.5 2
quadrature data
phase ( ×
π
rad )
input coherent state
-6
-5
-4
-3
-2
-1
0
1
2
3
4
5
6
0 0.5 1 1.5 2
quadrature data
phase ( ×
π
rad )
squeezed with T=0.75
-6
-5
-4
-3
-2
-1
0
1
2
3
4
5
6
0 0.5 1 1.5 2
quadrature data
phase ( ×
π
rad )
squeezed with T=0.50
-6
-5
-4
-3
-2
-1
0
1
2
3
4
5
6
0 0.5 1 1.5 2
quadrature data
phase ( ×
π
rad )
squeezed with T=0.25
-6
-5
-4
-3
-2
-1
0
1
2
3
4
5
6
0 0.5 1 1.5 2
quadrature data
phase ( ×
π
rad )
ancilla squeezed vacuum
Wigner function for T=0.25
-4
-2
0
2
4
x
-4
-2
0
2
4
p
-0.1
0
0.1
0.2
0.3
0.4
0.5
(a)
(d)(c)
(f)
(e)
(b)
Figure 6.8 Results of the homodyne measurements [275]. (a)–(e) are the raw quadrature data
as a function of the phase of the local oscillator and (f ) is the reconstructed Wigner function
(using inverse radon transformation [113]) for one realization of the experiment.
In Figure 6.10, the noise powers of the squeezed and anti-squeezed quadratures
are plotted as a function of the transmittance. The three curves represent theo-
retical predictions for the noise power of the anti-squeezed quadrature (curve i),
258 6 Quantum Teleportation of Gates
0
0.5
1
1.5
2
2.5
3
3.5
0 0.5 1 1.5 2 2.5 3 3.5
p
x
Figure 6.9 Phase space representation of the
experimental results [275]. The phase space
is normalized so that the standard deviation
of the vacuum fluctuation is 1/2 („D1/2).
Note that the measured results are directly
plotted without accounting for detection and
propagation losses.
-6
-4
-2
0
2
4
6
8
10
0 0.25 0.5 0.75 1
noise power (dB)
T
(i)
(ii)
(iii)
Figure 6.10 The noise powers of the squeez-
er outputs relative to the shot noise lim-
it [275]. We measure 0.7, 1.6 and 2.5 dB for
the squeezed quadrature and 1.3, 3.0 and
5.8 dB for the anti-squeezed quadrature. The
two quadrature variances of the input coher-
ent states are equal to those of vacuum within
˙0.1 dB.

6.2 Teleporting Qumode Gates 259
the squeezed quadrature with the ancilla 5.1 dB squeezed (curve ii) and infinitely
squeezed (curve iii). Note again that the anti-squeezed noise does n ot depend on
the ancilla. Experimental data taken with and without the feedforward in place are
also shown in Figure 6.10: The noise powers of x(p ) with feedforward are indicated
by dots (filled diamonds), and without feedforward by circles (open diamonds). We
see that the anti-squeezed noise of the ancilla is canceled and the transformation
in p becomes almost ideal after the feedforward. The noise powers of the squeezed
quadrature, however, deviate from the ideal operation due to the finite squeezing
in the ancilla states. Furthermore we observe a small degradation of the noise sup-
pression due to some imperfections of the feedforward, such as phase fluctuation.
Now, the fidelities [68] of these transformations are calculated. For the case of
Gaussian states, the fidelity between the ideal squeezed state, jψ
id
i,andtheactual
obtained mixed state, O
out
, is given by (in the unit of „D1/2)
F Dhψ
id
jO
out
jψ
id
i
D
1
2
q
V
x
out
C V
x
id
V
p
out
C V
p
id
exp
"
(
hx
out
ihx
id
i
)
2
2
V
x
out
C V
x
id
(
hp
out
ihp
id
i
)
2
2
V
p
out
C V
p
id
#
, (6.12)
where the subscripts “id” and “out” denote the ideal squeezing and the experimen-
tal output, respectively, and V denotes the variance. Actually, due to small propaga-
tion and detection losses in the experiment, the fidelity ultimately depends on the
input state. We therefore quantify the individual single shot fidelities for the inputs
considered in the experiment, though the average fidelity will be found by inte-
grating the fidelity in Eq. (6.12) over all possible input states. From the measured
means and variances, the fidelities between the ideally squeezed states of the in-
ferred inputs (accounting for losses) and the directly measured squeezed states are
computed, and 94%˙1% for T D 0.75 (1.2 dB squeezing), 89%˙1% for T D 0.50
(3.0 dB squeezing), and 78% ˙2% for T D 0.25 (6.0 dB squeezing) are found. Note
that the fidelity between the measured input states and the inferred o nes is found
to be 97% ˙ 1%. For comparison, the theoretically calculated fidelities with vacu-
um ancilla states (which correspond to the classical limits) are 93, 82, 63%, for the
transformations corresponding to 1.2, 3.0, 6.0 dB squeezing, respectively.
6.2.1.2 Quantum Non-demolition (QND) Sum Gate
In this section, we explain the demonstration of quantum non-demolition (QND)
sum gate by Yoshikawa et al. [284] by using two universal squeezers explained in
the previous section. Here, the proposal was made by Filip et al. [276] in the same
paper as the universal squeezer.
The analogue of a two-qubit C-NOT gate when continuous quantum variables
are considered is the so-called sum gate. It represents the canonical version of a
two-mode entangling gate for universal quantum computation in the regime of
continuous variables [90] (see Section 1.8). When applied to two optical, bosonic