Furusawa A., van Loock P. Quantum Teleportation and Entanglement: A Hybrid Approach to Optical Quantum Information Processing
Подождите немного. Документ загружается.

280 7 Cluster-Based Quantum Information Processing
(a)
(b) (c) (d)
R
R
H
H
z
z
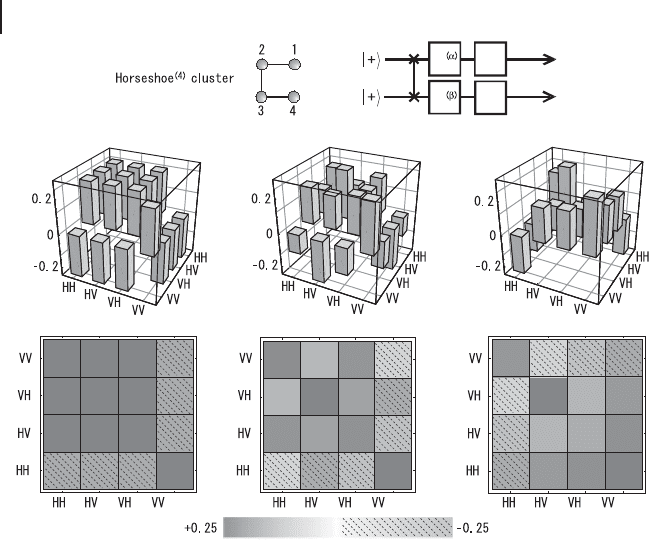
Figure 7.11 (a) Experimental results of one-
way quantum computation with a four-mode
linear cluster (horseshoe) with and without
feedforward [292]. Two-qubit-gate operation
of Figure 7.7 (α
2
D α
3
D 0) for the input
state of jCi
2
˝jCi
3
was performed with
and without feedforward. Only the case of
S
2
D S
3
D 1 is shown in this figure. (b) The
ideal case, (c) with feedforward and (d) with-
out feedforward. jHiDj$i, jVi D jli.
ent of the experiment is postselection. The readout in Figure 7.10a is part of the
cluster computation protocol. Thus, the output state must be destroyed and is not
directly available for further exploitation. Nevertheless, the principal mechanism of
cluster computation with qubits was clearly demonstrated in this experiment.
7.2
Qumodes
A canonical version of a Gaussian (approximate) CV cluster state is shown in Fig-
ure 3.16. The cluster computation proceeds from left to right through measure-
ments on the individual qumodes of the cluster state. Similar to the qubit case,
quantum information propagates along the horizontal wires with single-qumode
gates depending on the measurement bases. Two-qumode couplings are achieved
because the cluster is two-dimensional such that the information effectively prop-
agates along the whole lattice. Let us again consider an elementary teleportation
circuit, this time on two qumodes.

7.2 Qumodes 281
7.2.1
Elementary Qumode Teleportations
Consider just one horizontal link between two adjacent qumodes in the cluster.
The corresponding elementary qumode teleportation is shown in F igure 7.12.
Similar to the elementary qubit circuit, the gates in front of the computational
x-homodyne detector in the circuit of Figure 7.12 can be absorbed into the measure-
ment apparatus such that instead of measuring the observable Ox, the projection is
onto the rotated p-basis fD
†
jpig measuring the observable D
†
OpD.
The output state of the elementary CV circuit is
X(s)FDjψi (7.13)
for an arbitrary input state jψi. This time, up to a WH correction operation de-
pending on the measurement result s for the measurement on the upper qumode
and up to a Fourier transform, the resulting state is D jψi. This way we can apply
any gate D D e
i f ( Ox)
to an arbitrary input state teleported into the upper rail, that is,
into one or, in the multi-mode case, several qumodes of the far left column in Fig-
ure 3.16. Further application of such elementary steps by measuring out the other
qumodes in the CV cluster state beginning from the left in Figure 3.16 may lead
to, in principle, universal quantum computation on multi-qumode states in the ap-
proximate, asymptotic sense [171]. This can be understood by concatenating the
elementary teleportation steps such that for two steps (see Figure 7.13), we obtain
the state
X(s
2
)FD
0
2
(s
1
)X(s
1
)FD
1
jψi . (7.14)
Now, again it depends on the commuting properties of the D gate (if it is Clifford or
not, see Section 1.8) whether and how the WH corrections can be applied. In case
0≈p
s
Z
C
D
FF
†
ψ
DF
s
X
)(
x
0≈p
s
Z
C
ψ
DF
s
X
)(
p
D
†
ψ
ψ
(a)
(b)
Figure 7.12 Elementary teleportation of a CV
cluster computation. (b) the desired gate op-
eration D D e
i f (Ox )
and the inverse Fourier
transform F
†
can be absorbed into the mea-
surement apparatus such that a projection of
the upper qumode onto the basis fD
†
jp ig
with result s leaves the lower qumode in the
desired output state up to a Fourier trans-
form and a WH correction X(s). (a) shows the
equivalent circuit in which the measurement
is decomposed into unitary gates and a com-
putational basis measurement. Compare this
with the analogous qubit circuit in Figure 7.1.

282 7 Cluster-Based Quantum Information Processing
ψ
0≈p
Z
C
0≈p
Z
C
Z
C
1
D
1
D
FF
†
2
D
2
D
F
1
s
1
s
2
s
2
s
ψ
1
11
2
2
)()(')(
DF
s
X
s
DF
s
X
)(
'
12
s
D
F
†
Figure 7.13 Two cascading elementary qumode teleportations.
D is a non-Gaussian unitary, one has to choose the second measurement basis such
that
D
0
2
(s
1
)X(s
1
) D X(s
1
)D
2
(7.15)
with the desired gate operation D
2
in front of the state vector. Therefore, for gen-
eral qumode gates, feedforward is required where the later measurement bases
must be adjusted according to the earlier measurement outcomes. However, when
the gates are Gaussian, they would simply commute through the WH correction
operators; in which case only the required WH correction would change and not
the subsequent measurement bases (see Chapter 1). In this case, no feedforward is
needed and all measurements can be performed at any time and in any order (see
next section). The particular observables to be measured at each step, D
†
OpD,can
be chosen to be, for example, linear for D quadratic and quadratic for D cubic, see
the universal qumode gates introduced i n Section 1.8.
The Fourier transform is performed through the cluster at any step in order to
switch between Ox and Op gates. To complete the universal set in Eq. (1.127), the
two-qumode gate C
Z
is obtainable through the vertical wires in Figure 3.16 so
the cluster must be at least two-dimensional. The total evol ution of the input is
completely controlled by the measurements with the cluster state prepared offline
prior to the computation.
It is important to understand that in the realistic case of finitely squeezed cluster
states, there will be errors accumulating during the cluster computation. In fact,
it appears that there is no simple way (for instance, via a clever way of encoding
quantum information that propagates through the cluster) to suppress these er-
rors [293]. As a consequence, quantum error correction and fault tolerance have to
be taken into account from the start, and this will require complicated nonlinear,
non-Gaussian approaches (see Chapters 2 and 5).
7.2.2
Gaussian Computation
Any multi-mode LUBO as described by Eq. (2.104) can be performed on an arbi-
trary multi-mode state through homodyne detections alone. An additional nonlin-
ear measurement such as photon counting is needed in order to be able to realize
gates of cubic or higher order. In this case, the basis choice of a measurement in
one step would typically depend on the outcomes of the measurements in the pre-
7.2 Qumodes 283
p
x
in
ψ
x
p
x
p
out
ψ
x
p
x
p
p
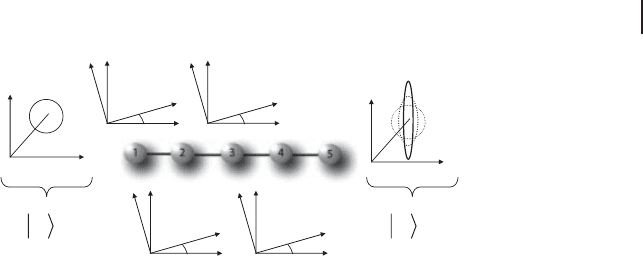
Figure 7.14 Universal single-mode LUBO.
After attaching an arbitrary single-qumode
input state to a linear four-mode cluster state
(qumodes 2–5) appearing in qumode 1, four
elementary steps involving four quadrature
homodyne detections on qumodes 1–4 with
suitably chosen local-oscillator quadrature an-
gles are sufficient to obtain approximately any
LUBO-transformed output state in qumode
5, provided the squeezing in the linear cluster
state is sufficiently large. The C
Z
-attachment
of the input state and the two homodyne
detections on qumodes 1 and 2 can be re-
placed by a CV Bell measurement on the input
mode and the far left mode, qumode 2, of the
cluster [294]. The input state is depicted as a
Gaussian coherent state only for illustration.
Most significantly, the CV Bell measurement
can also be used to teleport non-Gaussian
input states into the four-mode cluster for
universal, linear processing.
vious steps. In contrast, in the all-homodyne-based scenario for LUBOs, no such
feedforward is required and all measurements may be conducted in parallel – this
is the CV qumode version of Clifford parallelism.
It has been proven that a linear four-mode cluster state is sufficient to achieve
an arbitrary single-mode LUBO (see Figure 7.14); an arbitrary N-mode LUBO is
possible u sing a finite, two-dimensional CV cluster state of N
2
qumodes [294].
In this case, no more asymptotic evolutions with infinitesimal, elementary steps
must be considered, but rather combinations of beam splitter and single-mode
squeezing gates of appropriate strength. Such cluster-based LUBOs circumvent the
complication of online squeezing of, especially, fragile non-Gaussian states since
all squeezing gates are performed offline on the Gaussian cluster state. Provided
enough squeezing is available to create the cluster states [169, 295–297], this ap-
proach may also be used to realize the necessary squeezing corrections for nonlin-
ear gate implementations as discussed in the preceding section. The single-mode
LUBO scheme was recently implemented experimentally [298, 299] (see the follow-
ing sections on experimental schemes).
7.2.3
Experiment: Gaussian Qumode Cluster Computation
7.2.3.1 Quadratic Phase Gate
In this section, we will explain a quadratic phase gate demonstrated by Miwa
et al. [299] in detail. It was realized by using a QND sum gate explained in Sec-
tion 6.2.1.2, which is an example of off-line quantum information processing.

284 7 Cluster-Based Quantum Information Processing
Measurement-based one-way quantum computation [1] using an off-line pre-
pared, multi-party entangled cluster state is a conceptually interesting alternative
to the standard unitary circuit model of quantum computation [5]. In the cluster-
model, universality is achieved through different choices of measurement bases,
while the cluster state remains fixed. Unitary gates are effectively applied at each
measurement step corresponding to elementary teleportations [278, 300] for prop-
agating and manipulating a quantum state through the cluster. The cluster model
also turned out to provide new, potentially more efficient approaches to the ex-
perimental realization of quantum logical gates, especially in the quantum optical
setting [150, 151].
A translation of the circuit model for quantum computation over continuous
variables (CV) [86 ] to universal cluster computation with CV was given in [171]. The
canonical, universal gate set for CV is f
O
U
3
(λ), Cg,whereC Df
O
Z(s),
O
U
2
(),
O
F, C
Z
g
with the momentum shift operator
O
Z(s) D exp(2is Ox), the phase gates
O
U
l
(
l
) D
exp(i
l
Ox
l
), the Fourier transform operator
O
F, and the controlled-Z gate C
Z
D
exp(2i Ox ˝Ox) [170]. Through concatenation, the full set enables one to simulate
any Hamiltonian in terms of arbitrary polynomials of the position Ox and the mo-
mentum Op to any precision [86].
3)
The same set without the cubic gate
O
U
3
,thatis,thesetC,isstilluniversalfor
realizing any quadratic Hamiltonian, that is, the whole group of Gaussian unitary
transformations, the analogue to the Clifford group for discrete variables (DV).
In the case of DV, for example, single-qubit Clifford transformations are fully
covered by the Hadamard gate
O
H and the “π/4”-phase gate
O
U
π/4
acting upon the
qubit Pauli operators as
O
U
†
π/4
Z
O
U
π/4
D Z and
O
U
†
π/4
X
O
U
π/4
DiXZ DY ;full
universality for single-qubit transformations would then require, in addition, the
well-known “π/8”-phase gate [5], the analogue to the cubic phase gate
O
U
3
for CV
(see Section 1.8). Focusing on CV, the quadratic gate from the universal set C for
all Gaussian transformations maps the Weyl–Heisenberg displacement operators
O
Z(s)and
O
X (s) D exp(2is Op)into
O
U
†
2
()
O
Z(s)
O
U
2
() D
O
Z(s)
O
U
†
2
()
O
X (s)
O
U
2
() D e
is
2
O
X (s)
O
Z( s) , (7.16)
in analogy to the qubit “π/4”-phase gate
O
U
π/4
. The effect of the phase gate may be
more conveniently expressed in terms of the generators of the Weyl–Heisenberg
group,
O
U
†
2
() Ox
O
U
2
() DOx,
O
U
†
2
() Op
O
U
2
() DOp C Ox.
From Section 2.3 we know that there is an exact, finite decomposition of any
quadratic unitary into single-mode squeezers and beam splitters [89, 121]. In this
quantum optical language, the quadratic phase gate being explained in this section
O
U
2
together with the Fourier transform
O
F provides single-mode squeezing, and the
two-mode gate C
Z
involves beam splitting modulo single-mode squeezing.
In the cluster-based one-way model, the quadratic gate can be fully controlled
through the local oscillator phase of the homodyne detector [171]. Here, we will
3) Compared to Section 1.8, we are using a slightly modified notation in this section, consistent
with [299]

7.2 Qumodes 285
explain the experimental demonstration of this controllability by Miwa et al. [299],
with a fixed, off-line two-mode cluster state. In the demonstration, a large set of
squeezing transformations was achieved by means of this one-way phase gate;
sequential application of the gate would lead to universal single-mode Gaussian
transformations (where changes of the first moments in phase space require,
in addition, p-displacements
O
Z(s), trivial ly realizable through a cluster state for
CV [171]).
The output states of the elementary cluster computations exhibit sub-shot-noise
quadrature variance; thus, nonclassical states are created deterministically through
cluster computation with the degree of nonclassicality fully controlled by the mea-
surement apparatus. Therefore, the demonstration differs from previous imple-
mentations of universal offline squeezing [275, 276] explained in Section 6.2.1.1 in
which different squeezing transformations require different beam splitter transfor-
mations to achieve universality.
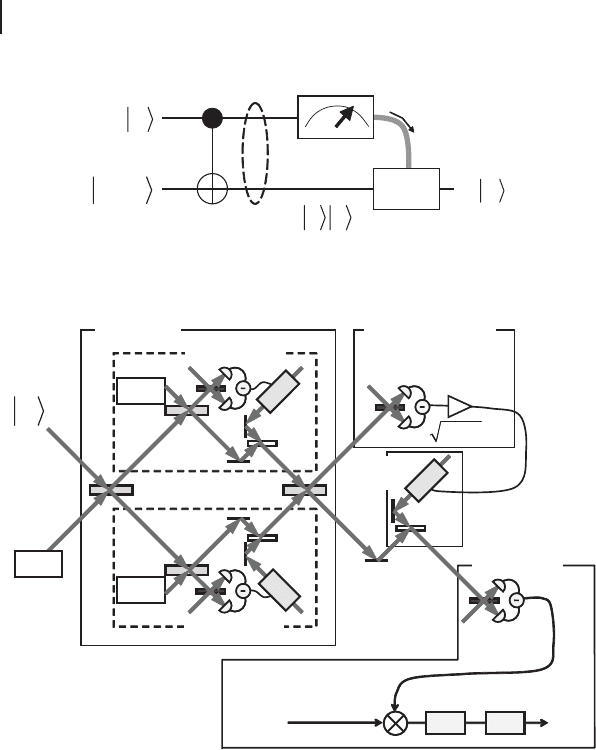
The elementary teleportation step for the case of CV [171] is described as fol-
lows. First, in the ideal scheme (Figure 7.15a), an arbitrary input state is cou-
pled to a single-mode, infinitely squeezed state (a position eigenstate jx D 0i),
O
U
QND
jψi
in
jx D 0i
A
.Thisresultsine
2i Ox
in
Op
A
R
dx ψ(x)jxi
in
R
dpjpi
A
/
p
π D
R
dx ψ(x)jxi
in
jxi
A
, where the subscripts “in” and “A” denote the input and ancilla
modes, respectively. Up to local Fourier rotations, the resulting state corresponds
to a perfect two-mode cluster state already carrying the quantum information to be
processed through the cluster (i.e., the quantum state jψi
in
).
Next, we measure the observable
O
U
†
( Ox) Op
O
U( Ox)ofmode1where
O
U( Ox)
exp[i f ( Ox)] is diagonal in the position basis and Op is the conjugate momentum
to Ox ([ Ox, Op ] D i/2). The quantum state after the measurement with outcome p
0
is
p
π
in
hp
0
j
O
U( Ox
in
)
Z
ψ(x)jxi
in
jxi
A
dx D
p
π
Z
in
hp
0
jxi
in
U(x)ψ(x)jxi
A
dx
D
O
Z(p
0
)
O
U( Ox
A
)jψi
A
.
(7.17)
After correcting the displacement
O
Z(p
0
), we obtain the desired state
O
U( Ox)jψi in
the ancilla mode. Through this scheme, in principle, we can apply an arbitrary uni-
tary operator
O
U( Ox)tojψi
in
; for nonlinear gates such as the cubic gate
O
U
3
,however,
this would require measuring a nonlinear observable. Here, we consider detection
of the whole range of rotated quadratures (all linear combinations of Ox and Op),
effectively applying the quadratic phase gate
O
U
2
() D exp
i Ox
2
to jψi
in
,uptoa
phase-space displacement depending on the measurement result p
0
.
In the optical realization, Ox and Op are quadrature operators for the mode oper-
ator Oa DOx C i Op. The quadratic gate
O
U
2
() corresponds to a sequence of rotation,
squeezing, and rotation [89] with (see Section 1.8)
Ox
out
DOx
in
Op
out
DOp
in
C Ox
in
. (7.18)
Thus, the required measurement corresponds to measuring [171]
Op C Ox D
p
1 C tan
2
θ
(
Op cos θ COx sin θ
)
, (7.19)
286 7 Cluster-Based Quantum Information Processing
0x =
ψ
()
dx x x x
ψ
∫
input
ancillary
squeezed
vacuum
QND gate
measurement
result
0
p
entangled
†
ˆˆ
ˆ
UpU
ˆ
U
ψ
output
measurement of
()
0
ˆ
Zp
LO
LO
99%R
38%R
38%R
LO
IN
QND gate
72%R
Squeezer B
28%R
OPO
B
OPO
C
99%R
99%R
LO
OUT
ψ
verification
OPO
A
E
OM
EOM
0
p
2
1
κ
+
Squeezer C
()
0
ˆ
Zp
EOM
LPF
A/D
reference
signal
1.34MHz
to PC
30kHz
mixer
measurement of
22
ˆˆ
ˆ
ix ix
epe
κκ
−
(a)
(b)
Figure 7.15 Schematic of a one-way quantum gate (a) and the experimental setup (b) [299].
OPO: optical parametric oscillator, LO: optical local oscillator, and EOM: electro-optic modula-
tor.
with D tan θ . Using homodyne detection and setting the phase of the local os-
cillator (LO) to θ , we can measure ( Op cos θ COx sin θ ). Appropriate electric am-
plification of the homodyne results with gain (1 C tan
2
θ )
1/2
leads to the desired
measurement of
O
U
†
Op
O
U.Miwaet al. showed this for several values of :0,˙1.0,
˙1.5, ˙2.0, with coherent-state inputs [299]. The corresponding LO phases are 0
ı
,
˙45
ı
, ˙56.3
ı
,and˙63.4
ı
, respectively.
In this optical demonstration, three squeezed-vacuum ancillae are used. One
ancilla is coupled to the input via a QND gate (denoted by subscript A). The QND
gate itself requires two additional squeezed vacuum states (denoted by subscripts
B, C) as explained in Section 6.2.1.2. The full input-output relations of the scheme
7.2 Qumodes 287
including finite-squeezing resources are
Ox
out
DOx
in
COx
(0)
A
e
r
A
p
5 1
2
4
p
5
Ox
(0)
B
e
r
B
,
Op
out
DOp
in
C Ox
in
C
1
4
p
5
Ox
(0)
B
e
r
B
C
p
5 C 1
2
4
p
5
Op
(0)
C
e
r
C
. (7.20)
Even with the excess noise from the finite squeezing of the ancillae, we are able to
observe sub-shot-noise quadrature squeezing for sufficiently large .
Experimental setup. – A schematic of the experimental setup is illustrated in Fig-
ure 7.15b. The original source of light is a continuous wave (CW) Ti:sapphire laser
whose output is 860 nm in wavelength and 1.5 W in power. Quantum states at the
1.34 MHz sideband are used in our demonstration.
The experimental setup consists of the following parts: preparation of the input
and ancilla states, the QND coupling gate, measurement, feedforward, and, finally,
the verification measurement.
The input state, a coherent state at the 1.34 MHz sideband, is generated by mod-
ulating a weak laser beam of about 10 µW using electro-optic modulators (EOMs).
Three types of coherent states jαi are prepared: α D x
in
, α D ip
in
,andα D 0
corresponding to phase modulation, amplitude modulation, and no modulation of
the laser beam, respectively.
In order to prepare the ancilla states, there are three sub-threshold optical para-
metric oscill ators (OPOs), each generating a single-mode squeezed state, whose
squeezing level is 4.3, 4.9, and 5.2 dB. An OPO is a bow-tie shaped cavity of
500 mm in length containing a PPKTP crystal [283]. The second harmonic (430 nm
in wavelength) of Ti:sapphire output is divided into three beams in order to pump
the OPOs.
The QND gate basically consists of a Mach–Zehnder interferometer with a
single-mode squeezing gate in each arm [284]. Each single-mode squeezing
gate contains a squeezed vacuum ancilla, homodyne detection, and feedfor-
ward[275,276].ThevariablebeamsplittersintheQNDgatearecomposedof
two polarizing beam splitters and a half-wave plate as explained in Section 6.2.1.1.
One can eliminate the QND gate and just measure the input states by setting the
transmittances of the variable beam splitters to unity. At each beam splitter, the
relative phase of the two input beams is locked by means of active feedback to a
piezoelectric transducer. For this purpose, two modulation sidebands of 154 and
107 kHz are used as phase references. For the homodyne detection, the LO phase
is adjusted in accordance to the desired value; the feedforward displacement is
carried out with the right gain depending on .
To verify the output state, another homodyne detection is employed. As is well
known from optical homodyne tomography, we can reconstruct the quantum state
from the marginal distributions for various phases [301]. The LO phase is slowly
scanned and a series of homodyne measurements are performed. The 1.34 MHz
component of the homodyne signal is extracted by means of lock-in detection: it
is mixed with a reference signal and then sent through a 30 kHz low pass filter.

288 7 Cluster-Based Quantum Information Processing
Finally, it is analog-to-digital converted where the sampling rate is 300 000 samples
per second.
The powers of the LOs are about 3 mW. The detector’s quantum efficiencies are
greater than 99%, the interference visibilities to the LOs are on average 98%, and
the dark noise of each homodyne detector is about 17 dB below the optical shot
noise level produced by the LO. Propagation losses of our whole setup are about
7%.
Experimental results. – As mentioned earlier, Miwa et al. carried out the experi-
ment with three types of input coherent states jαi: α D x
in
(x
in
D 1.4), α D ip
in
(p
in
D 1.3), and α D 0. For each input state, the gate for seven different values:
0, ˙1.0, ˙1.5, and ˙2.0 were demonstrated.
Figure 7.16 shows the raw data of marginal distributions and the Wigner func-
tions reconstructed via the maximum-likelihood method [302]. We show the results
for the input state with the amplitude in x as an example. Each scan contains about
80 000 data points which are uniformly distributed in phase from 0 to 2π,and
every 20 points are plotted in the figure (about 4000 data points). For D 0(Fig-
ure 7.16b), the input state is regenerated at the output except for some excess noise.
For nonzero (Figure 7.16c,d), we can see that the distribution of the p variable is
shifted proportional to x with a proportionality factor .Asaresult,theoutput
states are squeezed and rotated.
In Figure 7.17, the elliptic output Wigner functions for D 0, ˙1.0, ˙2.0 are
shown where the position, size, and shape of each ellipse correspond to the aver-
aged amplitudes and variances. Figure 7.17a,b are for the case of α D x
in
:(a)ex-
perimental results and (b) theoretical, ideal operation. They agree well in positions
and inclinations of ellipses, although the ellipses in Figure 7.17a are thermalized
because of the finite squeezing of the ancilla states. Experimentally estimated
is obtained via
act
DhOp
out
i/hOx
in
i, and the values obtained are
act
D 0.00, 0.95,
1.04, 1.94, and 2.02 for theoretical values
th
D 0, ˙1.0, and ˙2.0, respectively.
The differences in inclinations between experimental and ideal Wigner functions
are less than 3
ı
. The experimental results for the other input states are shown in
Figure 7.17c,d. The change of the amplitude in the input states only affects the po-
sitions of the ellipses; the shapes and inclinations of the ellipses remain the same.
We can see in Fig 7.17d that the input amplitude in the p quadrature (p
in
)issimply
reproduced at the output and is otherwise n ot affected for any . All of these results
are in good agreement with the theoretical input–output relations.
In Figure 7.18a, the fidelities of the experimental output states compared to
the ideal pure output states (i.e., without excess noise) are plotted. The fideli-
ty quantifies the overlap between two quantum states and it can be calculated
as
in
hψj
O
U
†
O
out
O
Ujψi
in
. In the case of infinitely squeezed ancillae, unit fidelity is
achieved. In the experiment, excess noises due to finitely squeezed ancillae lead to
non-unit fidelities. Without quantum resources (i.e., using vacuum states for an-
cillary inputs), the experimental fidelity is 0.62 ˙0.01 for D 0, which agrees with
the theoretical result 0.63 derived from Eq. (7.20). With squeezed-vacuum ancillae,
the experimental fidelity is 0.81 ˙ 0.01 for D 0,whichismuchbetterthanthe
case without nonclassical resources. For nonzero , the fidelities decrease as jj
7.2 Qumodes 289
-6
-4
-2
0
2
4
6
(a)
(b)
(c)
(d)
π
2
π
quadrature amplitude
phase
φ
[rad]
-4 -2 0 2 4
x
-4
-2
0
2
4
p
-6
-4
-2
0
2
4
6
0
π
2
π
quadrature amplitude
phase
φ
[rad]
-4 -2 0 2 4
x
-4
-2
0
2
4
p
-6
-4
-2
0
2
4
6
0
π
2
π
quadrature amplitude
phase
φ
[rad]
-4 -2 0 2 4
x
x
-4
-2
0
2
4
p
-6
-4
-2
0
2
4
6
0
π
2
π
quadrature amplitude
phase
φ
[rad]
-4 -2 0 2 4
-4
-2
0
2
4
p
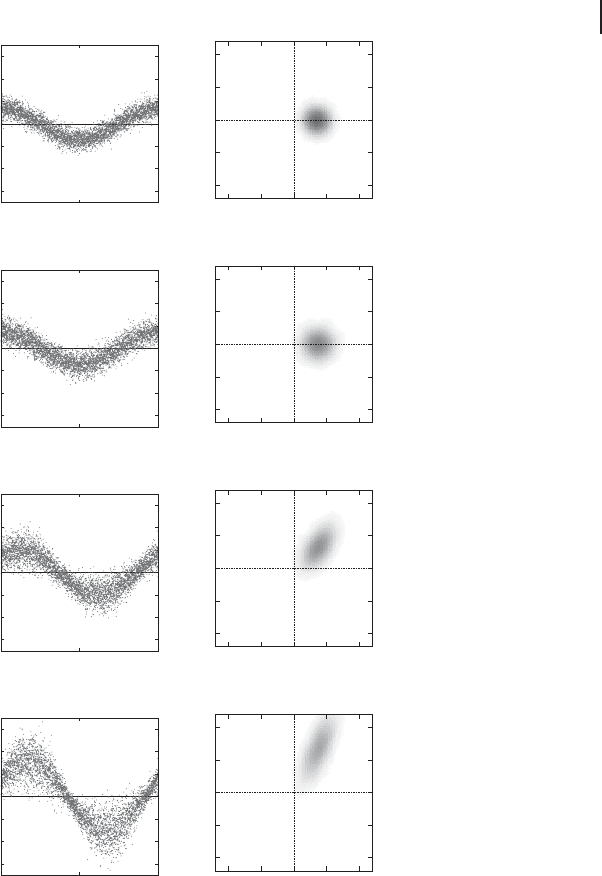
Figure 7.16 Input and output states with
several [299]. Left figures show raw da-
ta of marginal distributions and right ones
show the Wigner functions reconstructed via
maximum-likelihood method [302]. (a) In-
put coherent state; (b) output for D 0; (c)
output for D 1.0; (d) output for D 2.0.
increases because the squeezing of the ideal output state grows compared to that
used in the ancillary states. Experimental results are very close to the theoretical