Fahlman B.D. Materials Chemistry
Подождите немного. Документ загружается.

the range 1–30 nm, based on its composition (see below). Quantum dots currently
find applications as sensors, lasers, LEDs, nanophotonic devices,
[74]
and fluorescent
biomarkers. In fact, new high-density disks (e.g., Blu-ray high-definition DVD
format) may only be read via blue lasers, which are fabricated from quantum dots.
Long-term applications for these structures will likely include optical computing
and high-efficiency solar cells.
As you may recall from Chapter 4, when an electron is promoted from the valence
to conduction bands, an electron–hole pair known as an exciton is created in the bulk
lattice. The physical separation between the electron and hole is referred to as the
exciton Bohr radius (r
B
) that varies depending on the semiconductor composition.
In a bulk semiconductor crystal, r
B
is significantly smaller than the overall size of the
crystal; hence, the exciton is free to migrate throughout the lattice. However, in a
quantum dot, r
B
is of the same order of magnitude as the diameter (D) of the
nanocrystal, giving rise to quantum confinement of the exciton. Empirically, this
translates to the strongest exciton confinement when D 2r
B
.
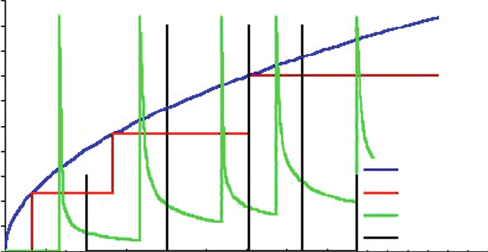
Analogous to the “par ticle-in-a-box” model from introductory physical chemis-
try, exciton quantum confinement results in discrete energy levels rather than the
continuous bands of a bulk semiconductor crystal (Figure 6.14). Since the gap
between adjacent ener gy levels is infinitesimally small for a bulk semiconductor,
the bandgap is considered as a fixed value. In contrast, since the dimensions of a
quantum dot are extremely small, the addition/subtraction of a single atom will
significantly change the nanocrystal dimensions and bandgap. Table 6.5 lists the r
B
values for common semiconductor crystals whose bandgap may be easily fine-tuned
by simply changing the diameter of the quantum dot, as long as the dimensions are
smaller than r
B
.
In the early 1980s, Efros described the size-dependent electronic properties of
quantum dots, first delineating that the bandgap, E
n
, will increase from the bulk
1E+21
9E+20
8E+20
7E+20
6E+20
5E+20
4E+20
3E+20
2E+20
1E+20
0
0 1020304050
Energy (meV)
Density of states
60 70 80 90 100 110
120
Quantum Well (2D)
Quantum Wire (1D)
Quantum Dot (0D)
Bulk (3D)
Figure 6.14. Density of states (DOS) for electrons in bulk semiconductors (3-D, blue), quantum wells
(2-D, red), quantum wires (1-D, green), and quantum dots (0-D, black).
478 6 Nanomaterials

value based on a 1/R
2
confinement energy term (Eq. 2). According to quantum
confinement theory, electrons in the conduction band and holes in the valence band
are spatially confined by the potential barrier of the surface. Due to confinement of
both electrons and holes, the lowest energy optical transition from the valence to
conduction band will increase in energy, effectively increasing the bandgap.
E
n
¼ E
g
þ
h
2
p
2
2mR
2
;ð2Þ
where E
g
is the bandgap of the bulk semiconductor; h, Planck’s constant; R, the
radius of the quantum dot; and m is the reduced mass of the exciton given by m
e
m
h
/
(m
e
+ m
h
). Here m
e
and m
h
are masses of the electron and hole, respectively.
This model was expanded by Brus and coworkers to include Coulombic interac-
tion of excitons and the correlation energy (Eq. 3).
E
n
¼ E
g
þ
h
2
p
2
2mR
2
1:786e
2
eR
þ 0:284E
R
;ð3Þ
where E
R
is the Rydberg (spatial correlation) energy of bulk semiconductor:
E
R
¼
me
4
2e
2
e
o
2
h
2
¼ 13:56
m
e
2
m
e
;
where e
0
is the permittivity of free space; e, the dielectric constant of the bulk
semiconductor; and m
e
is the mass of the electron.
Hence, the absorption energy of quantum dots will shift to higher frequenc y with
decreasing radius of the dots, with a dependence of 1/R
2
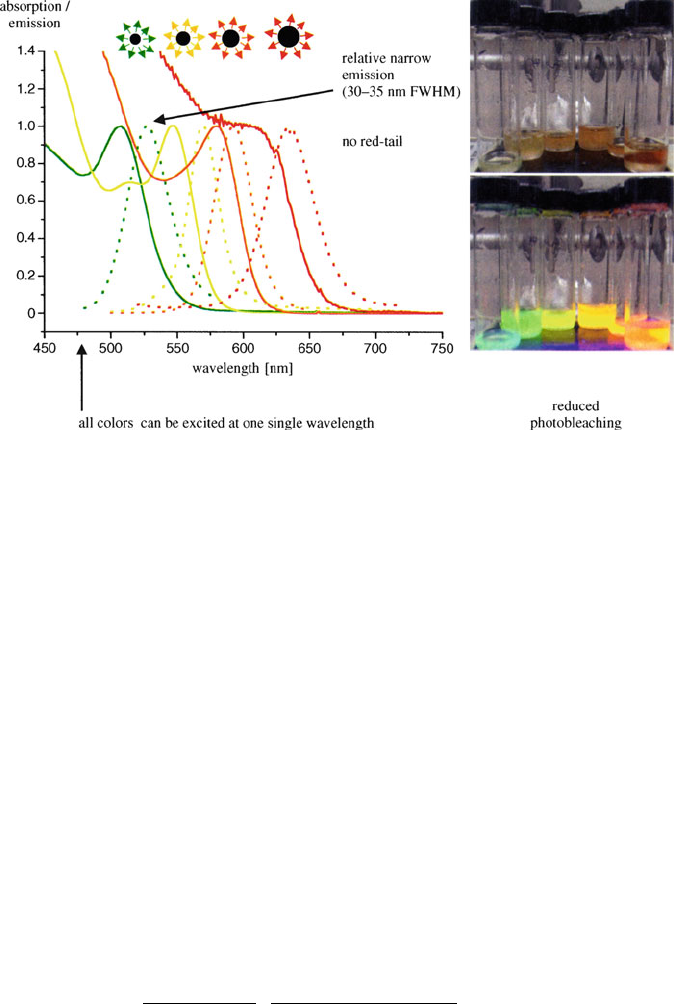
. For exampl e, CdSe QDs
with a diameter of 1.2–1.5 nm have a bandgap of 3.0 eV; in contrast, 3.0–3.5 nm
CdSe QDs have a bandgap of 2.3 eV, which is closer to its bulk value (1.8 eV). This
is readily determined from the observed colors of quantum dots with varying radii,
shifting from blue to red with increasing size (Fig ure 6.15).
[75]
For anyone who has admired the bright red colors of stained glass windows, it
may be surprising to note that this too is a nanoparticle phenomenon. In fact, the reds
and yellows observed in antiquated stained glass as far back as the early seventeenth
Table 6.5. Calculated Exciton Bohr Radii for Various Semiconductors
Material r
B
(A
˚
)
Si 55
CdS 28
CdSe 61
CdTe 100
ZnO 18
ZnS 50
PbS 204
PbSe 460
InAs 340
InSb 540
6.3. Nanoscale Building Blocks and Applications 479
century are caused by the presence of gold and silver nanoparticles, respectively.
However, the use of gold nanoparticles may date back even further, as reports of
“soluble” gold extractions date back to the fifth century B.C. in Egypt and China.
[76]
However, for metallic nanoclusters/nanoparticles with diameters ca. > 2 nm, the
observed color has a different origin than semiconductor quantum dots, since there is
no bandgap between valence and conduction bands, and the energy states form a
continuum analogous to bulk metal.
For these metallic nanostructures, another phenomenon known as surface plas-
mon resonance (often denoted as localized surface plasmon resonance, LSPR) is
active for these structures, involving specific scattering interactions between the
impinging light and the nanostructures. In particular, the oscillating electric field of
the incoming light causes the coherent oscillation of the conduction electrons,
resulting in a concomitant oscillation of the electron cloud surrounding the metal
nuclei (Figure 6.16).
[77]
The leading theory that describes the scattering behavior of small spherical
particles with light dates back to the work of Mie in the early 1900s (Eq. 4):
[78]
EðlÞ¼
24pN
A
r
3
e
m
3=2
l ln(10)
e
i
ðlÞ
ðe
r
ðlÞþ2e
m
Þ
2
þ e
i
2
ðlÞ
"#
ð4Þ
where E(l) is the extinction (sum of absorption and scattering); N
A
, the density of
the nanostructures; r, the radius of the nanostructure; e
m
, the dielectric constant
Figure 6.15. The size-dependency on the optical properties of CdSe nanocrystals. With decreasing size,
the fluorescence peak is shifted to shorter wavelengths. Also shown is the reduced photobleaching
exhibited by CdSe nanocrystals – (top-bottom photos): suspension of nanocrystals in solution, before
and after irradiation with UV light, respectively. Reproduced with permission from Pellegrino, T.; Kudera,
S.; Liedl, T.; Javier, A. M.; Manna, L.; Parak, W. J. Small, 2005, 1, 48. Copyright 2005 Wiley-VCH.
480 6 Nanomaterials
of the metallic nanostructure; l, the wavelength of absorbing radiation; and e
i
, e
r
are
the imaginary and real (respectively) portions of the l-dependent dielectric function
of the nanostructure.
This theory is still relevant today, alongside Raleigh scattering theory, to describe
the colors of our sky as well as the appearance of suspensions such as milk and latex
paints. It should be noted that for non-spherical nanostructures, the denominator of
the bracketed term above is replaced with:
e
r
ðlÞþwe
m
ðÞ
2
;
where w may range from a value of 2 (perfect sphere) to 17 (e.g., for a 5:1 aspect
ratio nanostructure) and beyond.
[79]
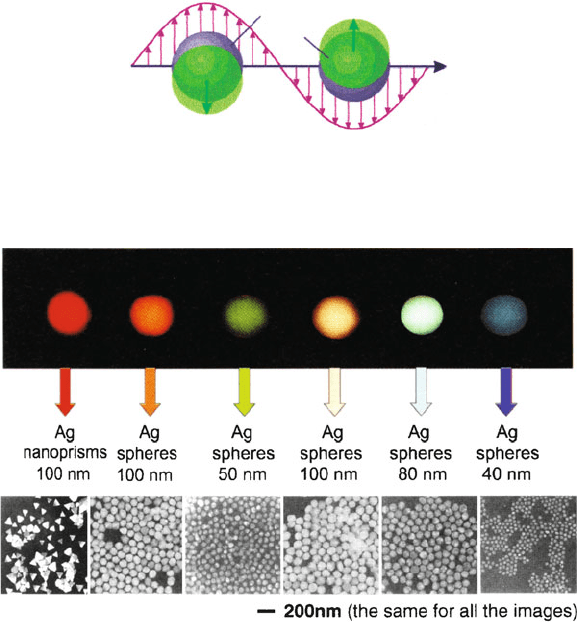
Based on Eq. 4, the factors that govern the oscillation frequency (and the observed
color) are: electron density (size/shape of the nanostructures, Figures 6.17 and 6.18),
the effective nuclear charge of the nuclei, and the size/shape of the charge distribu-
tion (polarization effects, strongly affected by the dielectric constant of the metal).
As you might expect, further effects toward the resonance frequency/intensity are
E-field
Metal
sphere
e
−
cloud
Figure 6.16. Schematic of LSPR for a nanosphere, showing the induced oscillation of the electron cloud
relative to the nuclei. Reproduced with permission from Kelly, K. L.; Coronado, E.; Zhao, L. L.; Schatz,
G. C. J. Phys. Chem. B 2003, 107, 668. Copyright 2003 American Chemical Society.
Figure 6.17. The influence of size and shape on the light-scattering, and resultant colors, of silver
nanoparticles. Reproduced with permission from Mirkin, C. A. Small 2005, 1, 14. Copyright 2005 Wiley-VCH.
6.3. Nanoscale Building Blocks and Applications 481
482 6 Nanomaterials
observed from the nanostru ctural composition
[80]
and its surrounding solvent.
As such, noble metal nanoparticles have been used as tunable platforms
for biological sensing (Figure 6.19). It should be noted that LSPR contributes
most strongly to the observed colors of the coinage metals (Cu, Au, Ag). Many
other metals such as Pb, In, Hg, Sn, etc. also exhibit this phenomenon, but appear
colorless since either the plasmon resonance frequency lies in the UV region, or the
nanoparticles are readily oxidized under ambient conditions.
For the smallest of metal lic nanoclusters with dimensions ca. <2 nm, the surface
plasmon absorption disappears. Since so few atoms comprise discrete nanoclusters
of this size, the spacings between adjacent energy levels (referred to as the Kubo
gap, d, Eq. 5) become comparable to the thermal energy, kT
[81]
– especially at lower
temperatures and smaller nanocluster diameters. This results in a shift in conductive
properties of the nanocluster, from metallic to insulating, with decreasing size
(Figure 6.20).
[82]
For instance, photoelectron measurements of Hg
n
clusters have
shown that a significant HOMO-LUMO gap of ca. 3.5 eV is present for Hg
3
clusters,
relative to only ca. 0.2 eV for Hg
250
; it is estimated that gap closure occurs for Hg
clusters with n 400 atoms.
[83]
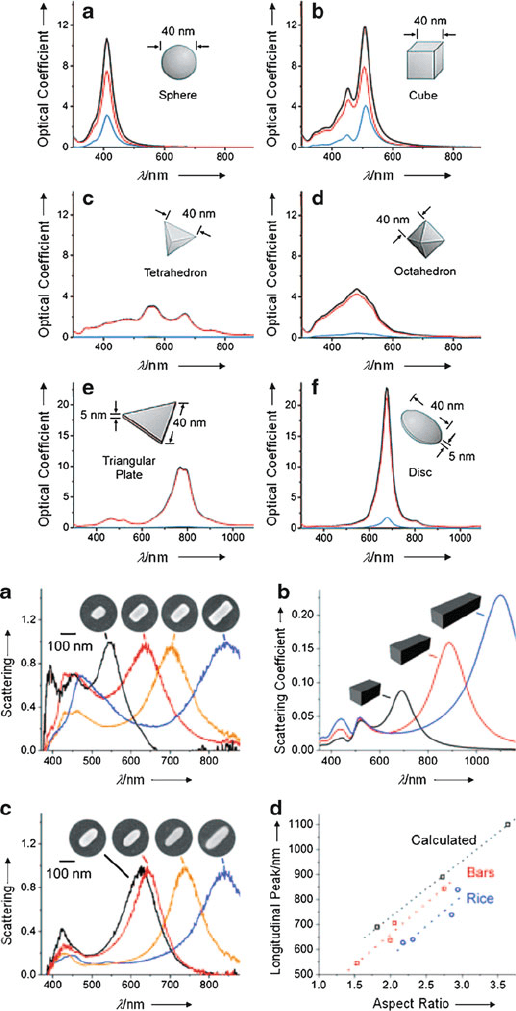
Figure 6.18. Top: calculated UV-visible extinction (black), absorption (red), and scattering spectra (blue)
of Ag nanocrystals, illustrating the effect of shape on spectral characteristics: (a) sphere, (b) cube,
(c) tetrahedron, (d) octahedron, (e) triangular plate, and (f) circular plate. Reproduced with permission
from J. Phys. Chem. B 2006, 110, 15666. Copyright 2006 American Chemical Society. Bottom: (a) SEM
images of individual Ag nanobars and the corresponding normalized LSPR spectra. The longitudinal
plasmon peak red-shifts with increasing aspect ratio for the nanobars; (b) calculated LSPR (scattering)
spectra for Ag nanobars 100, 150, and 200 nm in length, keeping width ¼ 55 nm and height ¼ 50 nm;
(c) SEM images of individual nanorice with the corresponding normalized LSPR spectra; (d) Plot of
longitudinal plasmon peak location versus aspect ratio. The peaks of both nanobars and nanorice red-shift
with increasing length, but on average the peaks of nanobars are 80 nm red-shifted from nanorice.
Reproduced with permission from Nano Lett. 2007, 7, 1032. Copyright 2007 American Chemical Society.
ä
1200
800
400
0
Intensity
Wavelen
g
th (nm)
450 500 550 600
12
ab
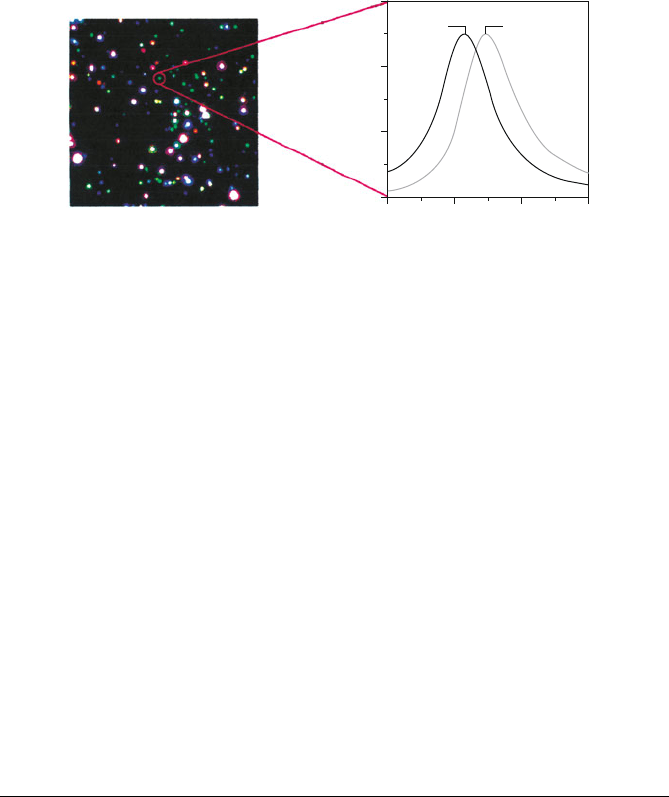
Figure 6.19. Biological sensing using Ag nanoparticles. Shown is (a) a dark-field optical image of
surface-functionalized (biotinylated) Ag nanoparticles, and (b) the shift in wavelength before (1) and
after (2) exposure to 10 nM streptavidin. Reproduced with permission from Haes, A. J.; Stuart, D. A.;
Nie, S.; Duyne, R. P. V. J. Fluoresc. 2004, 14, 355. Copyright 2004 Springer Science and Business Media.
6.3. Nanoscale Building Blocks and Applications 483
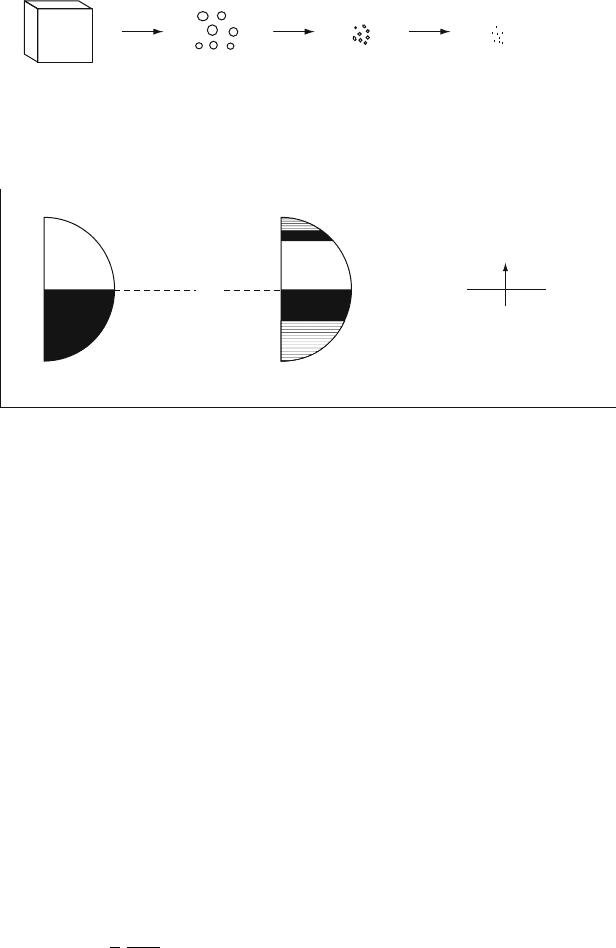
In band theory, the breadth of a band is directly related to the strength of interactions
among nearest neighbors. For atoms/molecules (Figure 6.20, far right) this interaction is
weak, which corresponds to a narrow band. However, as additional atoms are added to
the solid, stronger interactions will ensue, resulting in a greater density of states near the
Fermi level – additional states near the band edges develop last. Hence, the insulating
properties of very small nanoclusters are due to the small number of neighboring atoms,
which are held together primarily by nonmetallic interactions (e.g., van der Waal
forces).
[84]
As nanocluster size increases, the atomic s/p and d orbitals from a larger
number of constituent atoms will broaden into bands, forming an energy continuum.
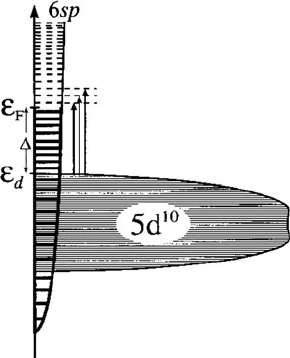
Quantum confinement effects also cause a change in the optical properties of
metallic nanoclusters. For instance, since the spacing between interband energy
levels increases with decreasing nanocluster size, the 5d
10
! 6(sp)
1
band absorp-
tion for gold (Figure 6.21) will become increas ingly blue-shifted with decreasing
dimensions (i.e., the observed color will be red-shifted).
[85]
dðe
F
Þ/
3
2
e
F
N
A
z
;ð5Þ
where d is the Kubo gap, energy spacing between adjacent E levels; N
A
, the number
of atoms in the nanocluster; z, their valence; and e
F
, the energy of the Fermi level
(e.g., 8 eV for Au).
Metal
Metal cluster /nanoparticle Atoms & Molecules
Size- Induced Metal-Insulator Transition
Insulator
Diameter : D >>10
4
Å
Nuclearity : N >>10
10
Kubo Gap : d <<10
−6
K
D ~ 10
4
−10
2
Å
N ~ 10
10
−10
4
d ~10
−6
−1K
D ~ 10
2
−10Å
N ~ 10
4
−10
d ~1−10
3
K
D < 10Å
N < 10
d > 10
3
K
Bulk Metal
Energy
Density-of-States
E
F
Figure 6.20. Schematic of the density of states exhibited by bulk metal relative to increasingly smaller
nanoclusters. The approximate diameter, nuclearity, and Kubo gap for each size regime are indicated.
As the nanocluster size decreases, the energy continuum of the bulk metal is transformed into discrete
energy levels, especially at band edges. Reproduced with permission from Rao, C. N. R.; Kulkarni, G. U.;
Thomas, P. J.; Edwards, P. P. Chem. Soc. Rev. 2000, 29, 27. Copyright 2000 Royal Society of Chemistry.
484 6 Nanomaterials
As you might expect, magnetism is also affected by decreasing particle size.
In particular , bulk ferromagn e tic mater ia ls such as a-Fe, Fe
3
O
4
, a-Fe
2
O
3
,and
Ni will become paramagnetic and display a zero magnetization once their dia-
meters reach critical sizes of 5, 16, 20, and 15 nm, respectively.
[86]
Whereas bulk
ferri-/ferromagnetic materials undergo a transition to the paramagnetic state
above their Curie temperature, such superparamagnetic nanomaterials undergo
this transition at a temperature below its Curie temperature. Though super-
paramagnetism poses a current limitation to increasing t he bit ar eal dens ity of
magnetic hard drives, heat-assisted magnetic recording (HAMR) devices are being
developed t o continue further progress in this field.
[87]
Some other applications
that may exploit the tunable magnetism of nanostructures include tunably-viscous
liquids (ferrofluids
[88]
) and biomedicine (e.g., drug-delivery, diagnostics, magne-
tofection, et c.).
The first 0-D nanoarchitecture: the fullerenes
Without question, our modern “nanotechnology revolution” was catalyzed by the
mid-1980s discovery of carbon nanoclusters known as fullerenes (e.g., C
60
,C
70
,C
84
,
etc.).
[89]
The 1996 Nobel Prize in Chemistry was awarded to Richard Smalley,
Robert Curl, and Sir Harold Kroto for this discovery, which focused the worldwide
spotlight on unique nanoscale materials and their possible applications. To date, the
Figure 6.21. Schematic illustration of the band structure (orbital energy vs density of states) of fcc-Au,
indicating the approximately correct bulk bandwidths and displacements, and density of states (solid
curve). The discrete levels are indicated by solid (broken) lines below (above) the Fermi level eF, with a
(mean) level spacing appropriate to a clusters of 50 Au atoms. The vertical arrows designate optical
transitions in the 1.7–2.5 eV range, originating at the top of the 5d band (ed) and terminating at each of the
first few unoccupied levels. Adapted from the calculations and interpretation of ref 43. Schaaff, T. G.;
Safigullin, M. N.; Khoury, J. T.; Vezmar, I.; Whetten, R. L.; Cullen, W. G.; First, P. N.; Gutierrez-Wing,
C.; Ascensio, J.; Jose-Yacaman, M. J. J. Phys. Chem. B 1997, 101, 7885.
6.3. Nanoscale Building Blocks and Applications 485
most common applications for fullerenes include MRI contrast agents (exploiting
its container properties), drug-delivery agents (through surface functionalization),
fulleride-based superconductors, and light-activated antimicrobial agents
[90]
(Figure 6.22). It should be noted that the term fullerene does not simply mean
the C
60
carbon allotrope termed Buckminsterfullerene (or “Buckyballs”),
[91]
but
rather the entire class of closed-cage carbon clusters that are comprised of exactly
12 pentagons, and a varying number of hexago ns (e.g., 20 hexagons for C
60
).
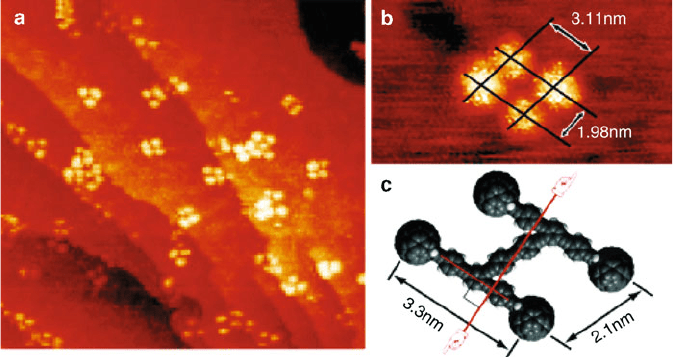
A recent application for fullerenes that would rank high in the “cool” category is
the development of surface-rolling molecules that are aptly termed nanocars/nano-
trucks.
[95]
Rather than stabilized nanoparticles, these nanovehicles are organic
molecules that contain fullerenes as wheels (Figure 6.23). The placement of the
nanocars onto a gold surface is as easy as spin-casting from a toluene suspension.
Due to strong adhesion forces between fullerenes and metal surfaces, the nanocars
spontaneously deposit with all four “nanowheels” on the substrate. The axles
consist of triple-bonded alkyne groups that allow rotation of the fullerene
wheels, transporting the nanocar across a gold surface in response to changes in
temperature.
[96]
Though only pivoting and translational motion are currently
O
OO
O
AcO O
O
OAc
OCOPh
OH
OH
O
OO
O
Ph
Ph
NH
O
N
H
x
10
ab
c
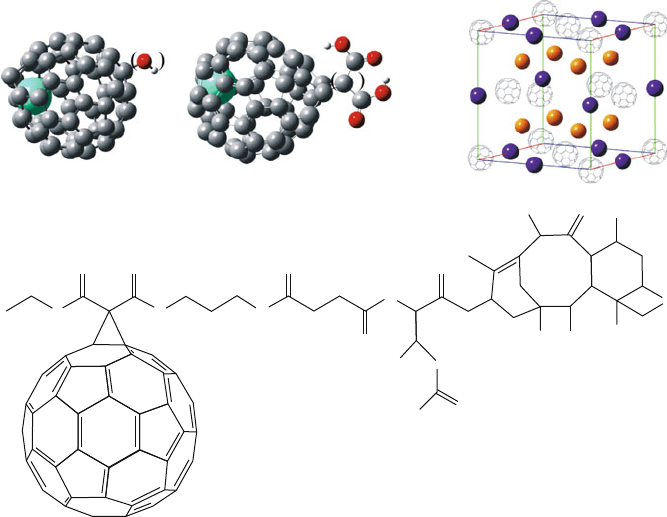
Figure 6.22. Examples of fullerene applications. Shown are (a) Gd
3+
@C
60
—[OH]
x
(x 27) and Gd
3+
@C
60
—[C(COOH)
2
]
10
used as MRI contrast agents,
[92]
(b) the ionic unit cell for the superconductive
alkali metal fulleride Cs
x
Rb
y
C
60
,
[93]
and (c) the conjugate structure of C
60
covalently bound to the lung
cancer drug Paclitaxel.
[94]
486 6 Nanomaterials
possible, this work sets an important step toward the realization of nanomachines for
an endless number of possible applications.
As with other major discoveries such as Teflon and nylon, the synthesis of C
60
was serendipitous (Figure 6.24).
[97]
In fact, the experiments that led to the discov-
ery of fullerenes were aimed at simulating the environment of a carbon-rich red
giant star. As such, the discovery of C
60
has been dubbed “the celestial sphere that
fell to earth.”
[98]
The experimental system featured the laser vaporization of a
graphite target into a heli um carrier gas w herein the atoms nucleated into c lusters.
The gas was then cooled using supersonic expansion, and injected into a time-of-
flight mass spectrometer for analysis (Figure 6.25 a). Reactive gases such as
hydrogen or nitrogen could also be added to the carrier gas, for the synthesis of
other reaction products. It should be noted that this technique is now used to
generate nanoclusters of a wide variety of metals, s emic onduct ors (e.g., Si), and
insulators (e.g., Al
2
O
3
) depending on the nature of the target and co-reactant gases
employed.
[99]
The first large-scale synthesis of fullerenes was discovered in 1989 by Huffm an
and Kratschmer; this provided a macroscopic quantity of C
60
in order to confirm the
proposed icosohedral structure. Their technique consisted of the arc-evaporation of
graphite electrodes via resistive heating within an atmosphere of ca. 100 atm. helium
(Figure 6.25b).
[101]
Other more rece nt techniques such as high- temperature combus-
tion of benzene and a benchtop graphite arc process (Fig ure 6.26) were developed in
order to reduce the cost and complexity associa ted with fullerene synthesis. Not only
will such improvements allow for more widespread fabrication of fullerenes for
research/applications (i.e., synthesis no longer limited to groups with supersonic
Figure 6.23. Images and dimensions of a nanocar on a Au(111) surface. The bright features are the
fullerene wheels. Reproduced with permission from Nano Lett. 2005, 5, 2330. Copyright 2005 American
Chemical Society.
6.3. Nanoscale Building Blocks and Applications 487