CIMA - C3 Fundamentals Of Business Mathematics
Подождите немного. Документ загружается.

200 7: Distributions ⏐ Part C Probability
If you are given the variance of a distribution, remember to first calculate the standard deviation by taking its
square root.
Question
Normal distribution
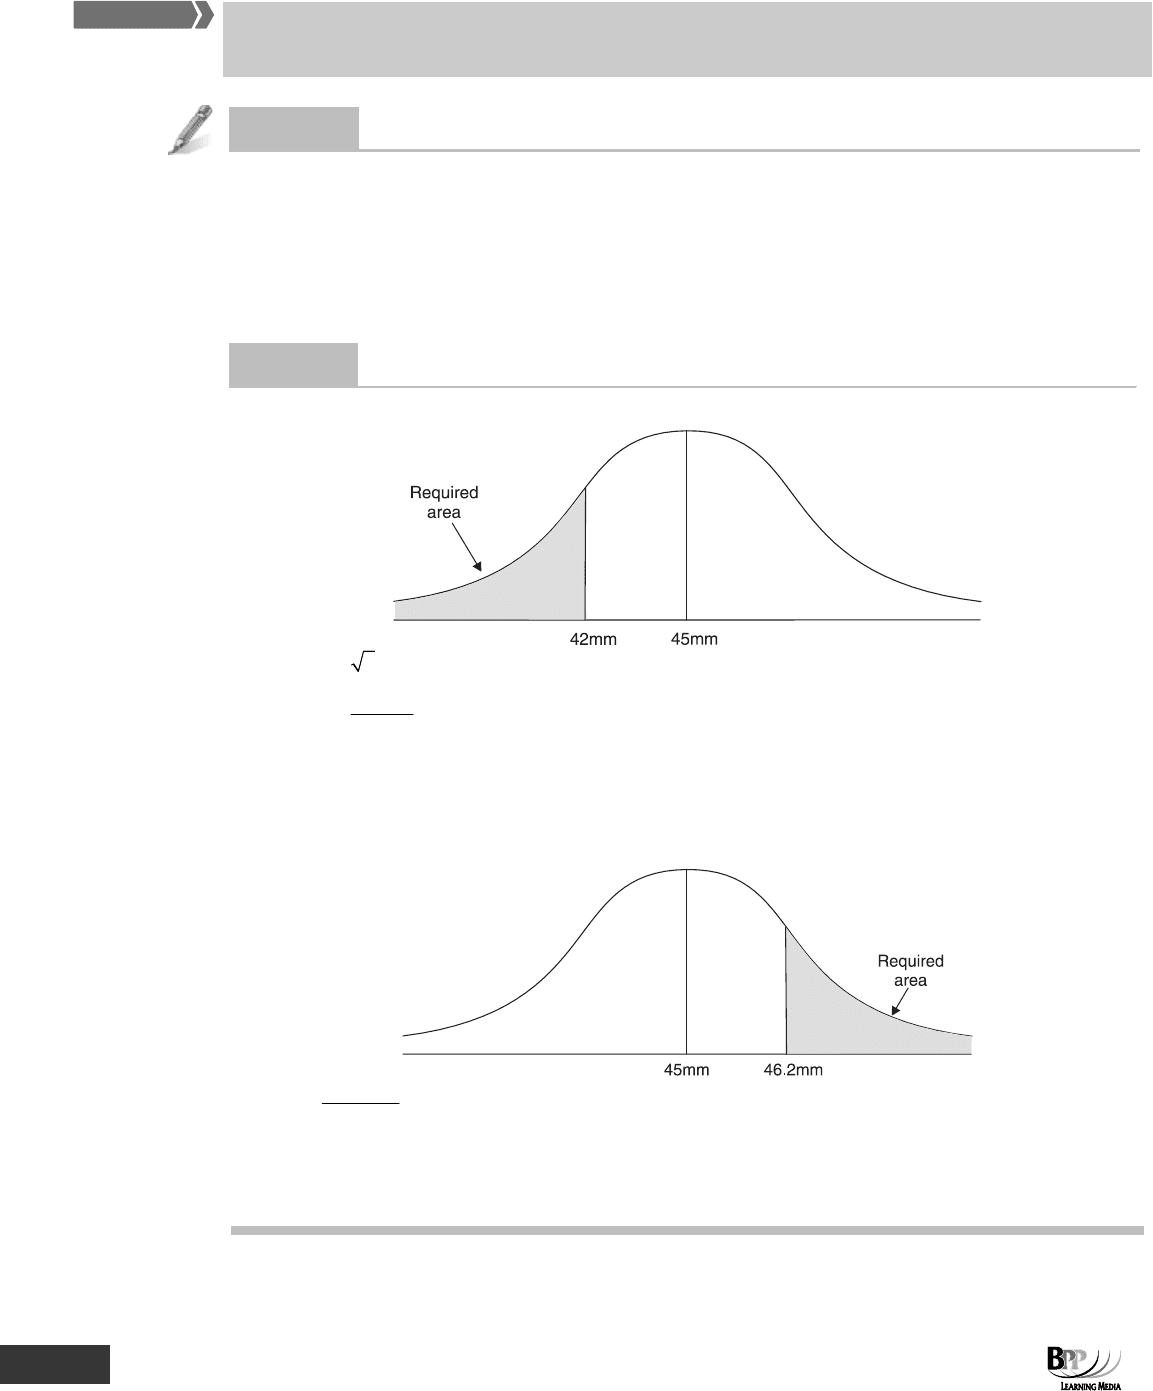
The specification for the width of a widget is a minimum of 42mm and a maximum of 46.2mm. A normally
distributed batch of widgets is produced with a mean of 45mm and a variance of 4mm.
Required
(a) Calculate the percentage of parts that are too small
(b) Calculate the percentage of parts that are too big
Answe
r
(a)
σ = 4= 2
z =
2
4542 −
= – 1.5
Proportion of widgets between 42mm and 45mm = 0.4332.
Proportion of widgets smaller than 42mm = 0.5 – 0.4332 = 0.0668
= 6.68%
(b)
z =
2
452.46 −
= 0.6
Proportion of widgets between 45mm and 46.2mm = 0.2257.
Proportion of widgets bigger than 46.2mm = 0.5 – 0.2257 = 0.2743
= 27.43%
FA
S
T F
O
RWAR
D

Part C Probability ⏐ 7: Distributions 201
You may need to work backwards from a % of population to calculate the Z score and then the x value.
Question
Standard deviation
A normal distribution has a mean of 120 and a standard deviation of 15. 75% of the population is therefore below
what value?
Answe
r
50% of the population is below 120.
25% of the population is below x.
From the normal distribution table, a value of 0.25 equates to a z value of 0.67.
z =
σ
μ−x
0.67 =
15
120x −
0.67 × 15 = x – 120
10.05 = x – 120
x = 10.05 + 120
= 130.05
75% of the population is below 130.05
5 The Pareto distribution and the '80:20 rule'
Pareto analysis is used to highlight the general principle that 80% of value (inventory value, wealth, profit and so
on) is concentrated in 20% of the items in a particular population.
Pareto analysis is based on the observations of the economist Vilfredo Pareto, who suggested that 80% of a
nation's wealth is held by 20% of its population (and so the remaining 80% of the population holds only 20% of
the nation's wealth).
Pareto analysis is the 80/20 rule and it has been applied to many other situations.
• In inventory control, where 20% of inventory items might represent 80% of the value
• In product analysis, where 80% of company profit is earned by 20% of the products
Assessment
focus point
Key term
FA
S
T F
O
RWAR
D

202 7: Distributions ⏐ Part C Probability
5.1 Example: Pareto analysis and products
(a) A company produces ten products which it sells in various markets. The revenue from each product is as
follows.
Product
Revenue
$'000
A
231
B
593
C
150
D
32
E
74
F
17
G
1,440
H
12
I
2
J
19
2,570
(b) Rearranging revenue in descending order and calculating cumulative figures and percentages gives us the
following analysis.
Product
Revenue
Cumulative
revenue (W1)
%
(W2)
$'000 $'000
G 1,440 1,440 56.0
B 593 2,033 79.1
A 231 2,264 88.1
C 150 2,414 93.9
E 74 2,488 96.8
D 32 2,520 98.1
J 19 2,539 98.8
F 17 2,556
99.5
H 12 2,568
99.9
I
2
2,570
100.0
2,570
Workings
1 This is calculated as follows:
1,440 + 593 = 2,033
2,033 + 231 = 2,264 and so on.
2 (1/2,570 × 1,440 × 100)% = 56.0%
(1/2,570 × 2,033 × 100)% = 79.1% and so on.
(c) In this case the Pareto rule applies – almost 80% of revenue is brought in by just two products, G and B.
The point of Pareto analysis is to highlight the fact that the effort that is put into a company's products is
often barely worth the trouble in terms of the sales revenue generated.
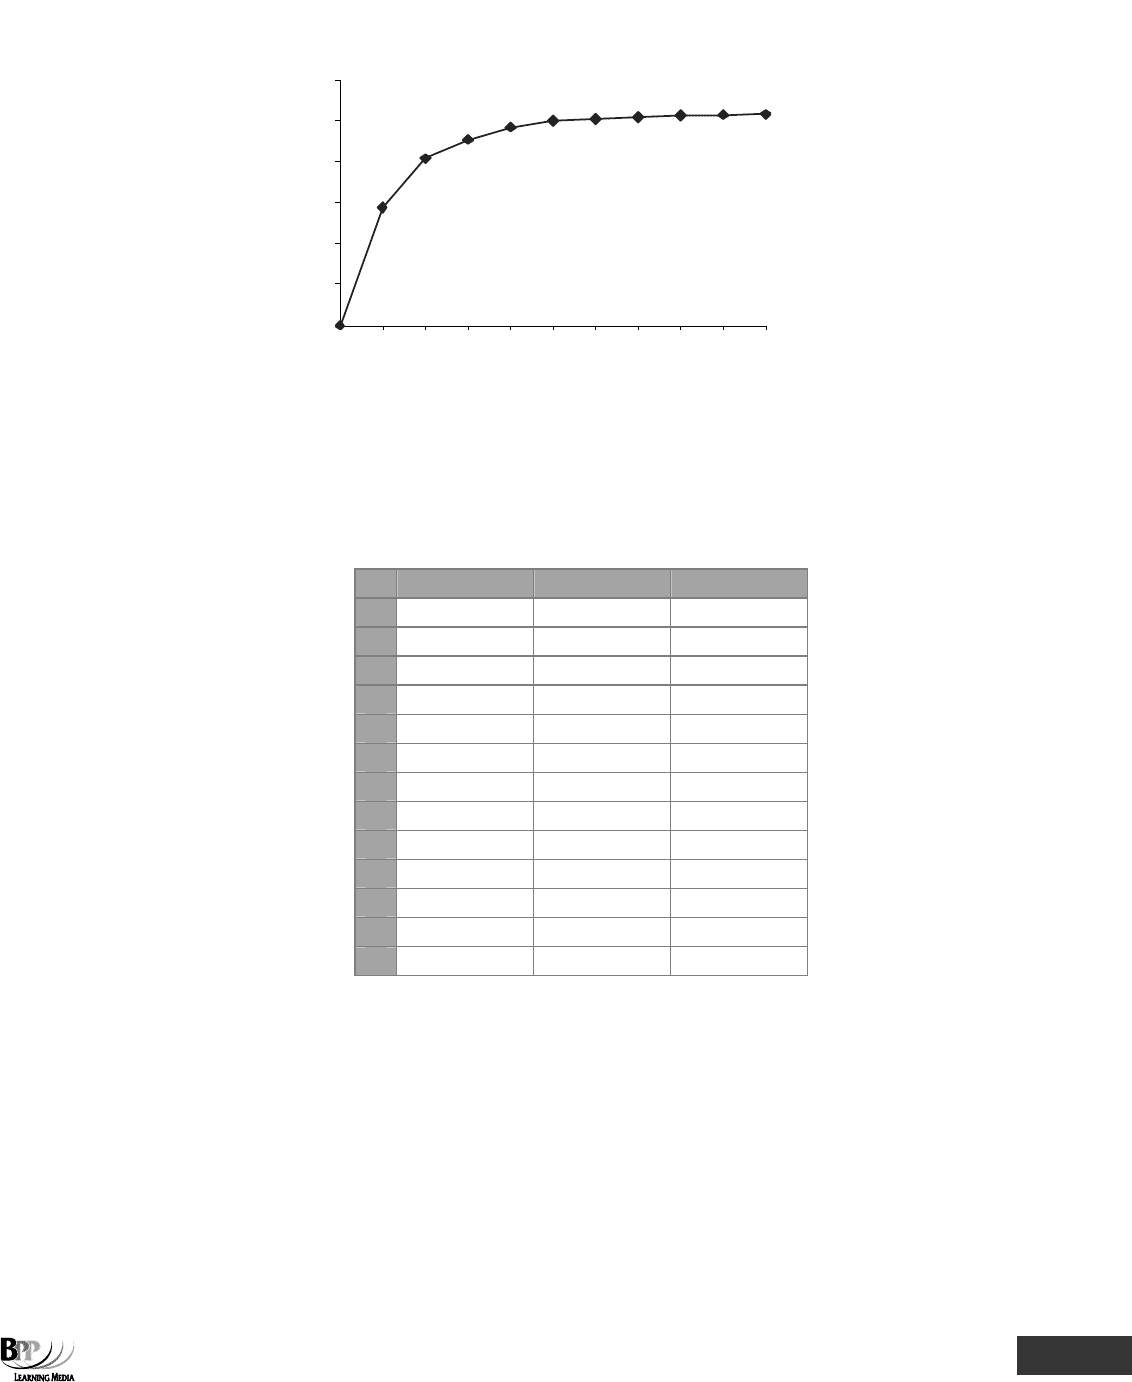
(d) We can illustrate a pareto distribution on a graph, plotting cumulative revenue against each product.
Part C Probability ⏐ 7: Distributions 203
Revenue information presented as a pareto curve
0
500
1000
1500
2000
2500
3000
0GBACEDJ FH I
Product
Revenue
$'000
5.2 Pareto analysis using Excel
Excel can be used to sort data and calculate cumulative percentages in order to carry out Pareto analysis.
In the spreadsheet below, the data from the example in Paragraph 5.1 has been input.
A B C
1
Product Revenue
2
$'000
3
A 231
4
B 593
5
C 150
6
D 32
7
E 74
8
F 17
9
G 1440
10
H 12
11
I 2
12
J 19
13
2570
In order to carry out the Pareto analysis:
Step 1 Select the cells A3:B12 and click on DATA then SORT. In the 'sort by' box select $'000 and check the
'descending' box. Click 'ok' to perform the sort.
Step 2 Calculate the percentage of the total revenue that each product generates by entering the formula
=B3/$B$13 and copy this formula down the column. Change the format of the cells to percentage.
Step 3 Calculate the cumulative revenue by entering =C3 in cell D3 and =D3+C4 into cell D4. Copy this formula
down the column.
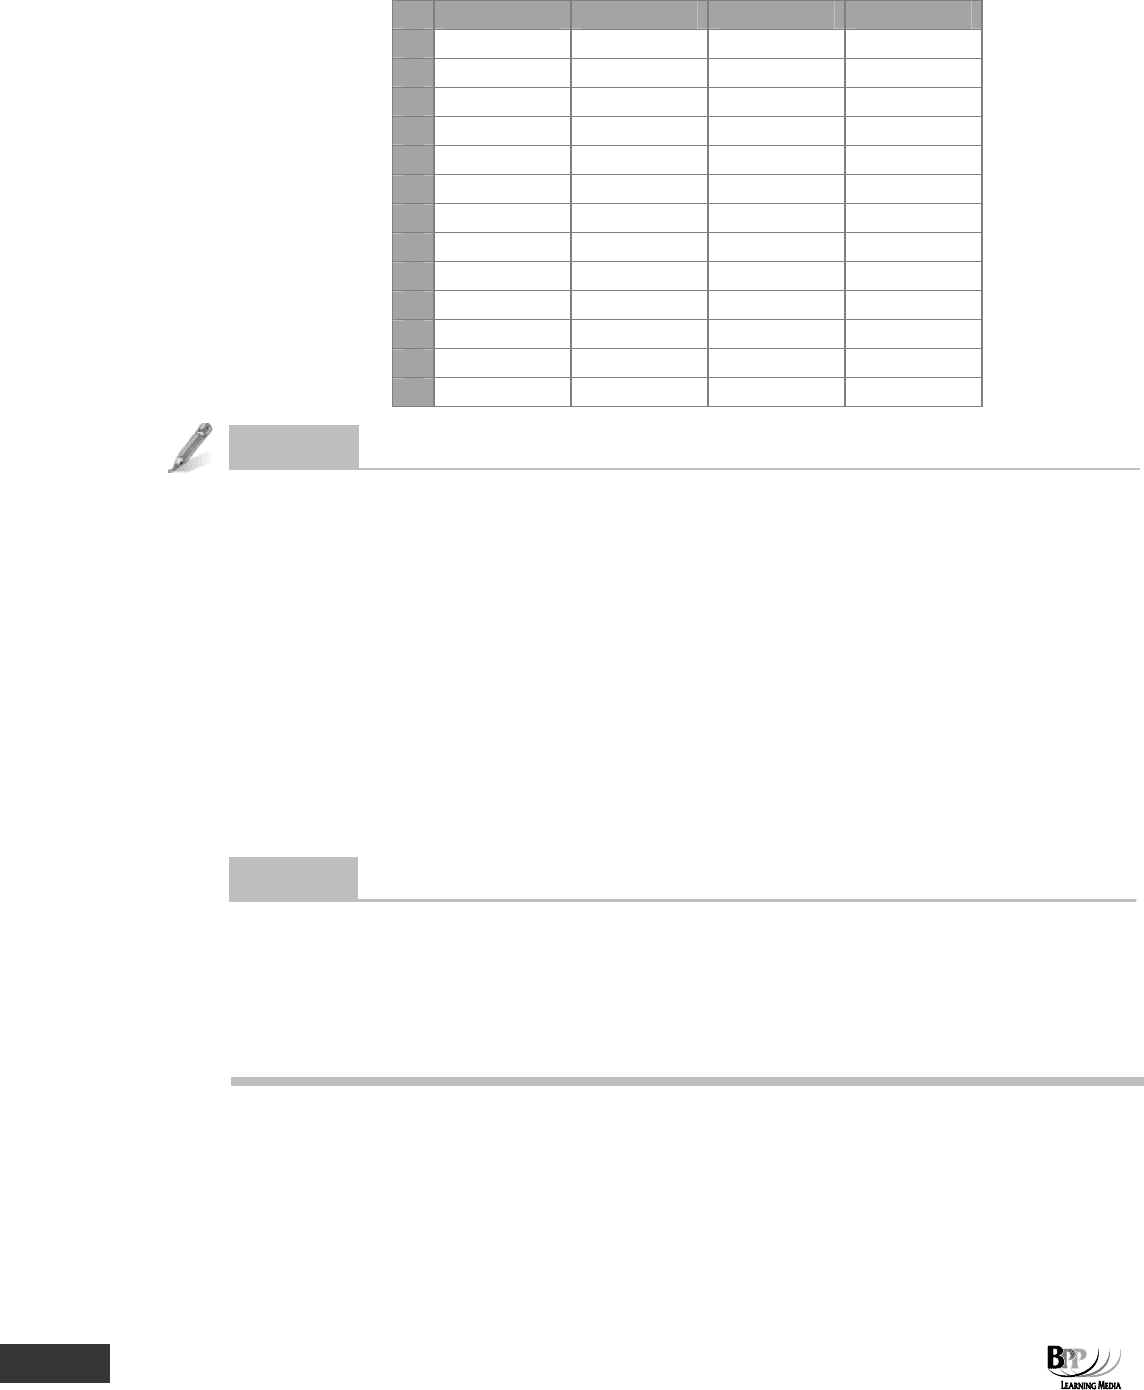
The completed spreadsheet should look like this.
204 7: Distributions ⏐ Part C Probability
A B C D
1
Product Revenue % of total Cum total
2
$'000
3
G 1440 56.03% 56.03%
4
B 593 23.07% 79.11%
5
A 231 8.99% 88.09%
6
C 150 5.84% 93.93%
7
E 74 2.88% 96.81%
8
D 32 1.25% 98.05%
9
J 19 0.74% 98.79%
10
F 17 0.66% 99.46%
11
H 12 0.47% 99.92%
12
I 2 0.08% 100.00%
13
2570
Question
Pareto analysis
In Pareto analysis, what is the 80:20 rule?
(i) An approximate rule to the effect that 20% of the products will provide 80% of sales.
(ii) An approximate rule to the effect that an increase of 80% in costs will be reflected by a 20% decline in
sales.
(iii) An approximate rule that 80% of wealth is held by 20% of the population.
(iv) An approximate rule to the effect that the wealth of the richest 20% of the population equals that of the
other 80%.
A (ii) and (iii)
B (ii) only
C (i) only
D (i) and (iii)
Answe
r
D
Rule (i) was first suggested by the economist Pareto in the context of the distribution of wealth.
There is no such general guidance to the effect of
rule (ii).
Rule (iii) was initially suggested by Pareto on the basis of his observations of social inequality.
Rule (iv) is incorrect.

Part C Probability ⏐ 7: Distributions 205
Chapter Roundup
• If we convert the frequencies in a frequency distribution table into proportions, we get a probability distribution.
• The normal distribution is a probability distribution which usually applies to continuous variables, such as
distance and time.
• Properties of the normal distribution are as follows.
– It is symmetrical
– It has a mean, μ (pronounced mew)
– The area under the curve totals exactly 1
– The area to the left of μ = area to right of μ
– It is a bell shaped curve
• Distances above or below the mean of a normal distribution are expressed in numbers of standard deviations, z.
z =
x −μ
σ
Where z = the number of standard deviations above or below the mean
x = the value of the variable under consideration
μ = the mean
σ = the standard deviation
• The normal distribution can be used to calculate probabilities. Sketching a graph of a normal distribution curve
often helps in normal distribution problems.
• If you are given the variance of a distribution, remember to first calculate the standard deviation by taking its
square root.
• Pareto analysis is used to highlight the general principle that 80% of value (inventory value, wealth, profit and so
on) is concentrated in 20% of the items in a particular population.
Quick Quiz
1 The normal distribution is a type of distribution.
2 The area under the curve of a normal distribution = which represents % of
all probabilities.
3 The mean of a normal distribution = σ
True
F
False
F
4 What proportions/percentages do the following z scores represent?
(a) 1.45
(b) 2.93
(c) 0.955
206 7: Distributions ⏐ Part C Probability
5 What are the corresponding z scores for the following proportions/percentages?
(a) 0.4382
(b) 0.4750
(c) 0.4747
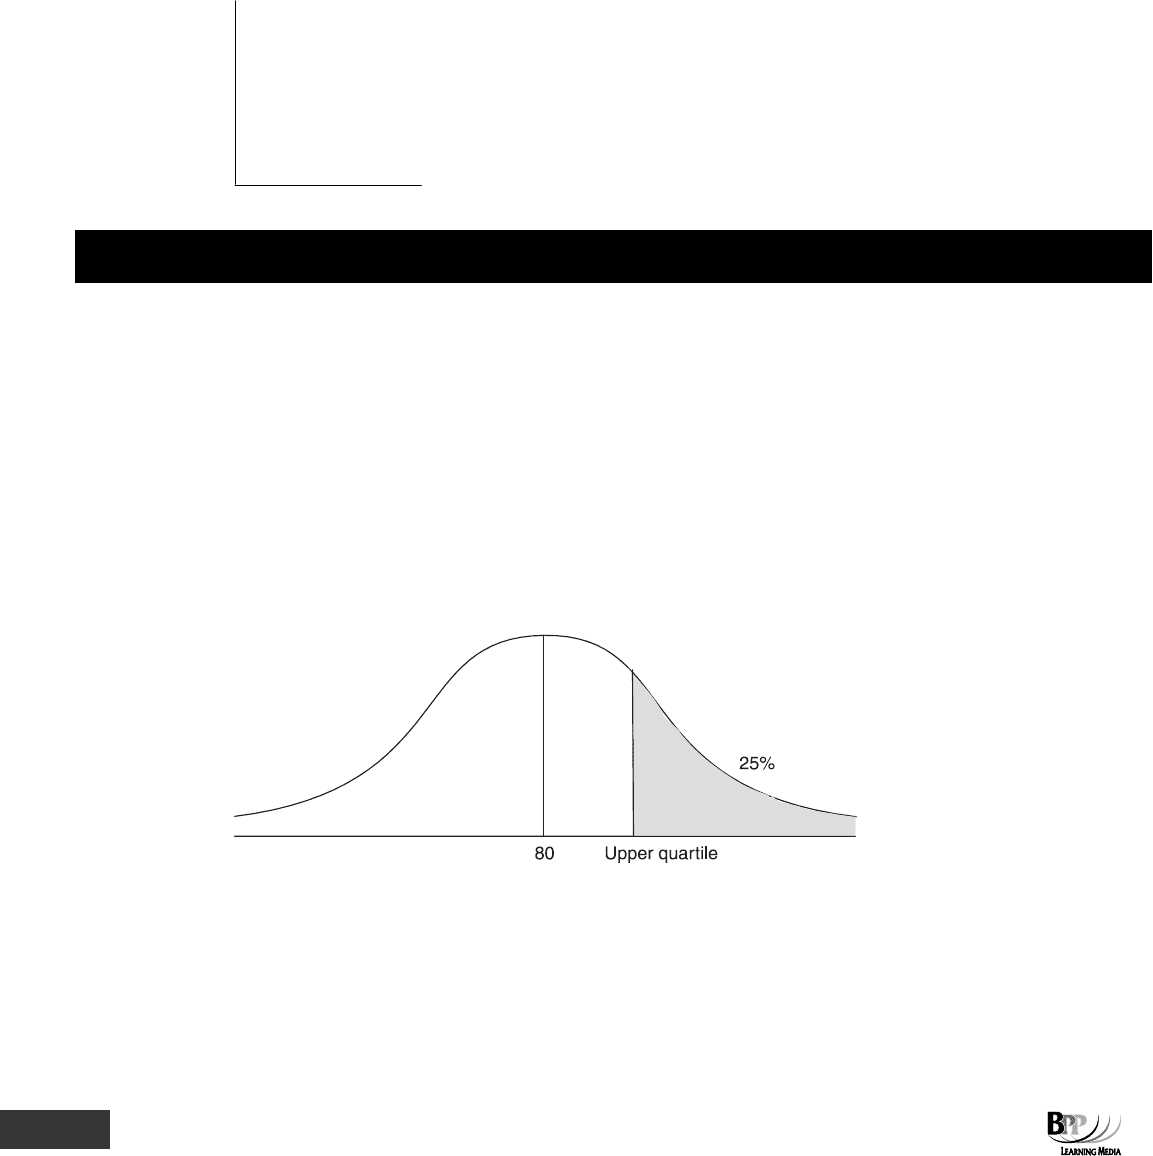
6 A normal distribution has a mean of 80 and a variance of 16. What is the upper quartile of this distribution?
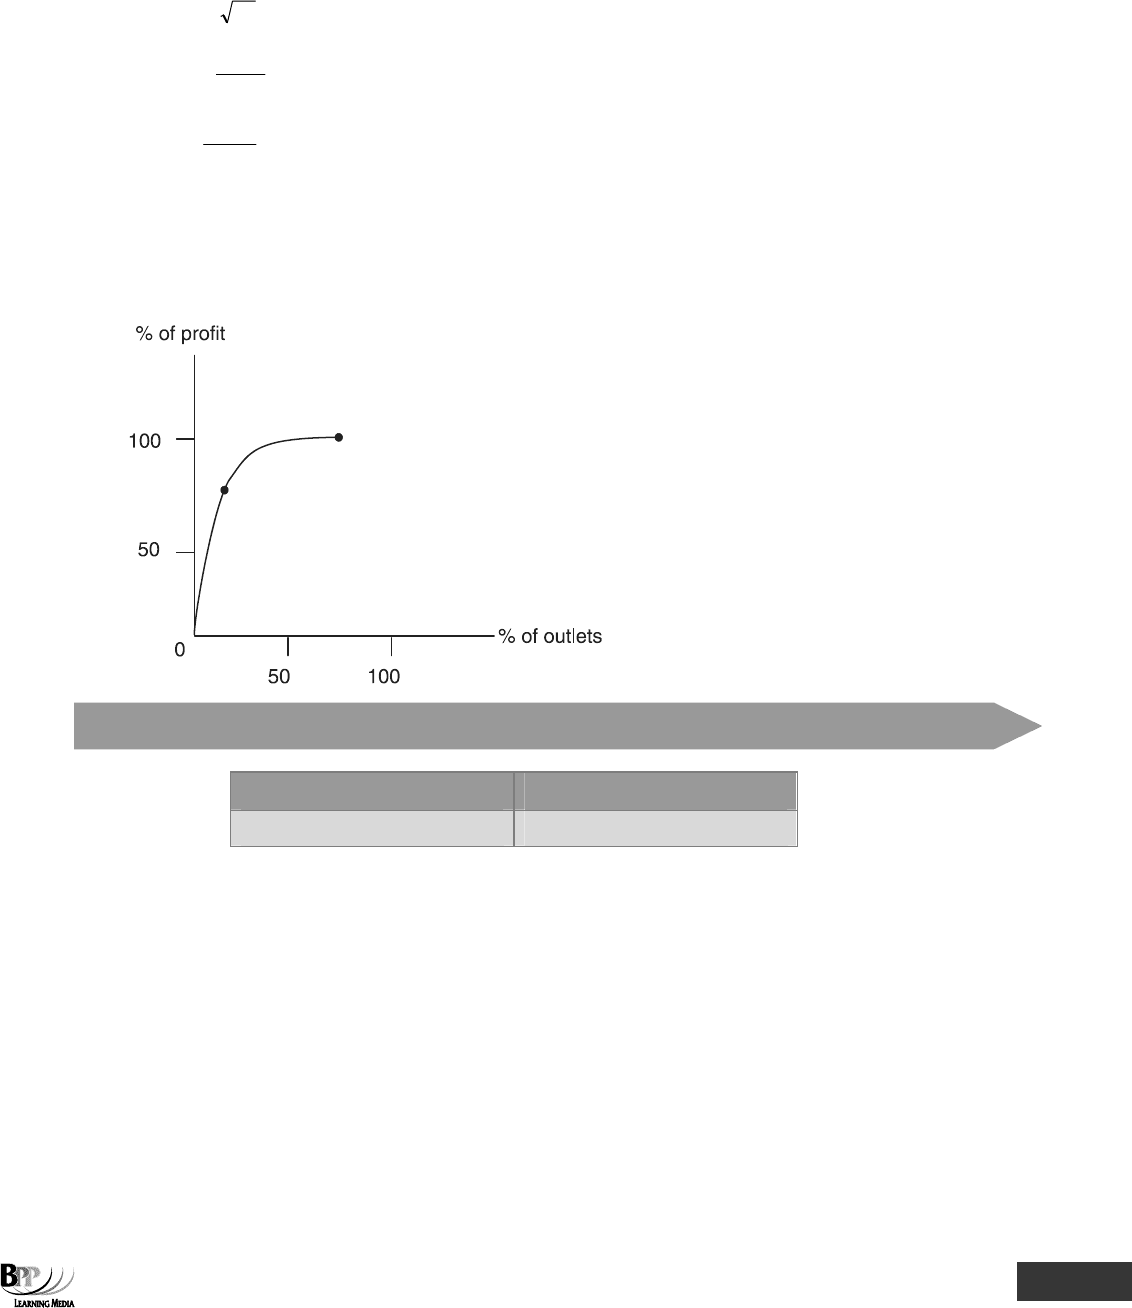
7 On the axes below, sketch and label correctly a Pareto curve to demonstrate a situation where 80% of an
organisation's profit is derived from 20% of its retail outlets.
Answers to Quick Quiz
1 Probability
2 1, 100%
3 False. The mean of a normal distribution = μ
4 (a) 0.4265 = 42.65%
(b) 0.4983 = 49.83%
(c) 0.3302 = 33.02% (Take average of 0.95 and 0.96 = (0.3289 + 0.3315) ÷ 2 = 0.3302.)
5 (a) 1.54
(b) 1.96
(c) 1.955
6 The upper quartile is at the point where 25% of the area under the curve is above this point.
From the normal distribution table, the nearest value to 0.25 is 0.2486 which corresponds to a z value of 0.67.
Part C Probability ⏐ 7: Distributions 207
If z = 0.67
μ = 80
σ =
16 = 4
z =
σ
μ−x
0.67 =
4
80−x
x – 80 = 4 × 0.67
x = 2.68 + 80
= 82.68
7
Now try the questions below from the Exam Question Bank
Question numbers Pages
58-63 338-339

208 7: Distributions ⏐ Part C Probability

209
Part D
Financial mathematics