CIMA - C3 Fundamentals Of Business Mathematics
Подождите немного. Документ загружается.


190 7: Distributions ⏐ Part C Probability
1 Probability distributions
1.1 Converting frequency distributions into probability distributions
If we convert the frequencies in a frequency distribution table into proportions, we get a probability distribution.
Marks out of 10
Number of students
Proportion or probability
(statistics test)
(frequency distribution)
(probability distribution)
0
0
0.00
1
0
0.00
2
1
0.02*
3
2
0.04
4
4
0.08
5
10
0.20
6
15
0.30
7
10
0.20
8
6
0.12
9
2
0.04
10
0
0.00
50
1.00
* 1/50 = 0.02
A probability distribution is an analysis of the proportion of times each particular value occurs in a set of items.
1.2 Graphing probability distributions
A graph of the probability distribution would be the same as the graph of the frequency distribution, but with the
vertical axis marked in proportions rather than in numbers.
(a) The area under the curve in the frequency distribution represents the total number of students
whose marks have been recorded, 50 people.
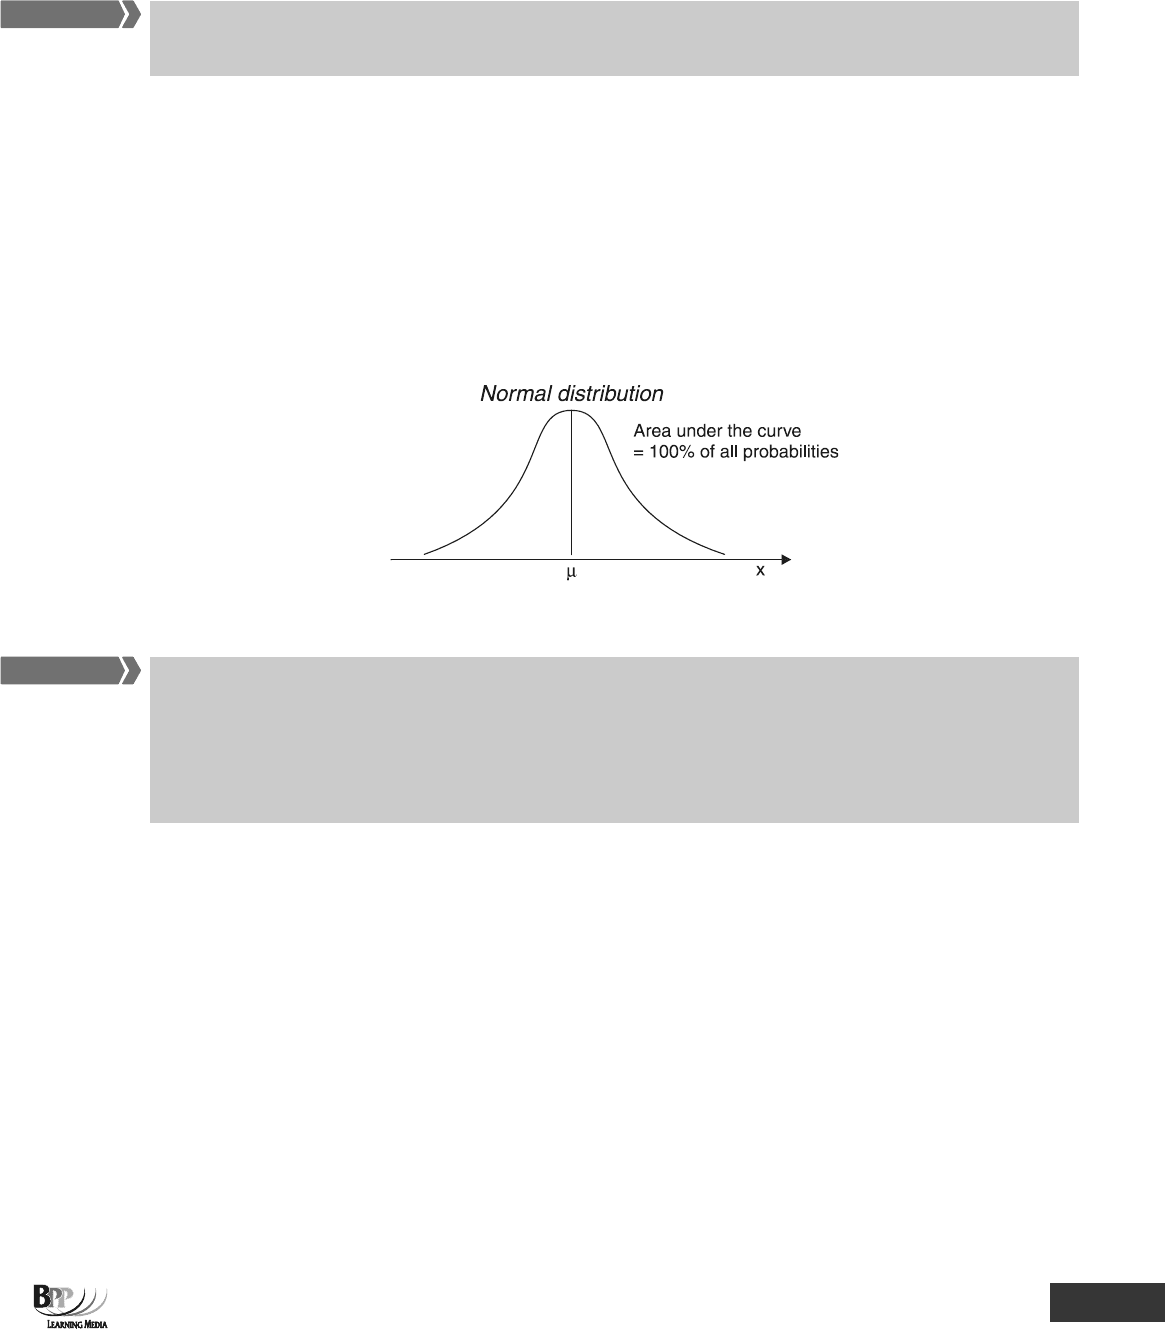
(b) The area under the curve in a probability distribution is 100%, or 1 (the total of all the
probabilities).
There are a number of different probability distributions but the only one that you need to know about for the
Business Mathematics assessment is the normal distribution.
Key term
FA
S
T F
O
RWAR
D
Part C Probability ⏐ 7: Distributions 191
2 The normal distribution
The normal distribution is a probability distribution which usually applies to continuous variables, such as
distance and time.
2.1 Introduction
In calculating P(x), x can be any value, and does not have to be a whole number.
The normal distribution can also apply to discrete variables which can take many possible values. For example,
the volume of sales, in units, of a product might be any whole number in the range 100 – 5,000 units. There are so
many possibilities within this range that the variable is for all practical purposes continuous.
2.2 Graphing the normal distribution
The normal distribution can be drawn as a graph, and it would be a bell-shaped curve.
2.3 Properties of the normal distribution
Properties of the normal distribution are as follows.
• It is symmetrical and bell-shaped
• It has a mean, μ (pronounced mew)
• The area under the curve totals exactly 1
• The area to the left of μ = area to the right of μ = 0.5
2.4 Importance of the normal distribution
The normal distribution is important because in the practical application of statistics, it has been found that many
probability distributions are close enough to a normal distribution to be treated as one without any significant
loss of accuracy. This means that the normal distribution can be used as a tool in business decision making
involving probabilities.
3 The standard normal distribution
3.1 Introduction
For any normal distribution, the dispersion around the mean (μ) of the frequency of occurrences can be measured
exactly in terms of the standard deviation (σ) (a concept we covered in Chapter 7).
The standard normal distribution has a mean (μ) of 0 and a standard deviation (σ) of 1.
FA
S
T F
O
RWAR
D
FA
S
T F
O
RWAR
D
192 7: Distributions ⏐ Part C Probability
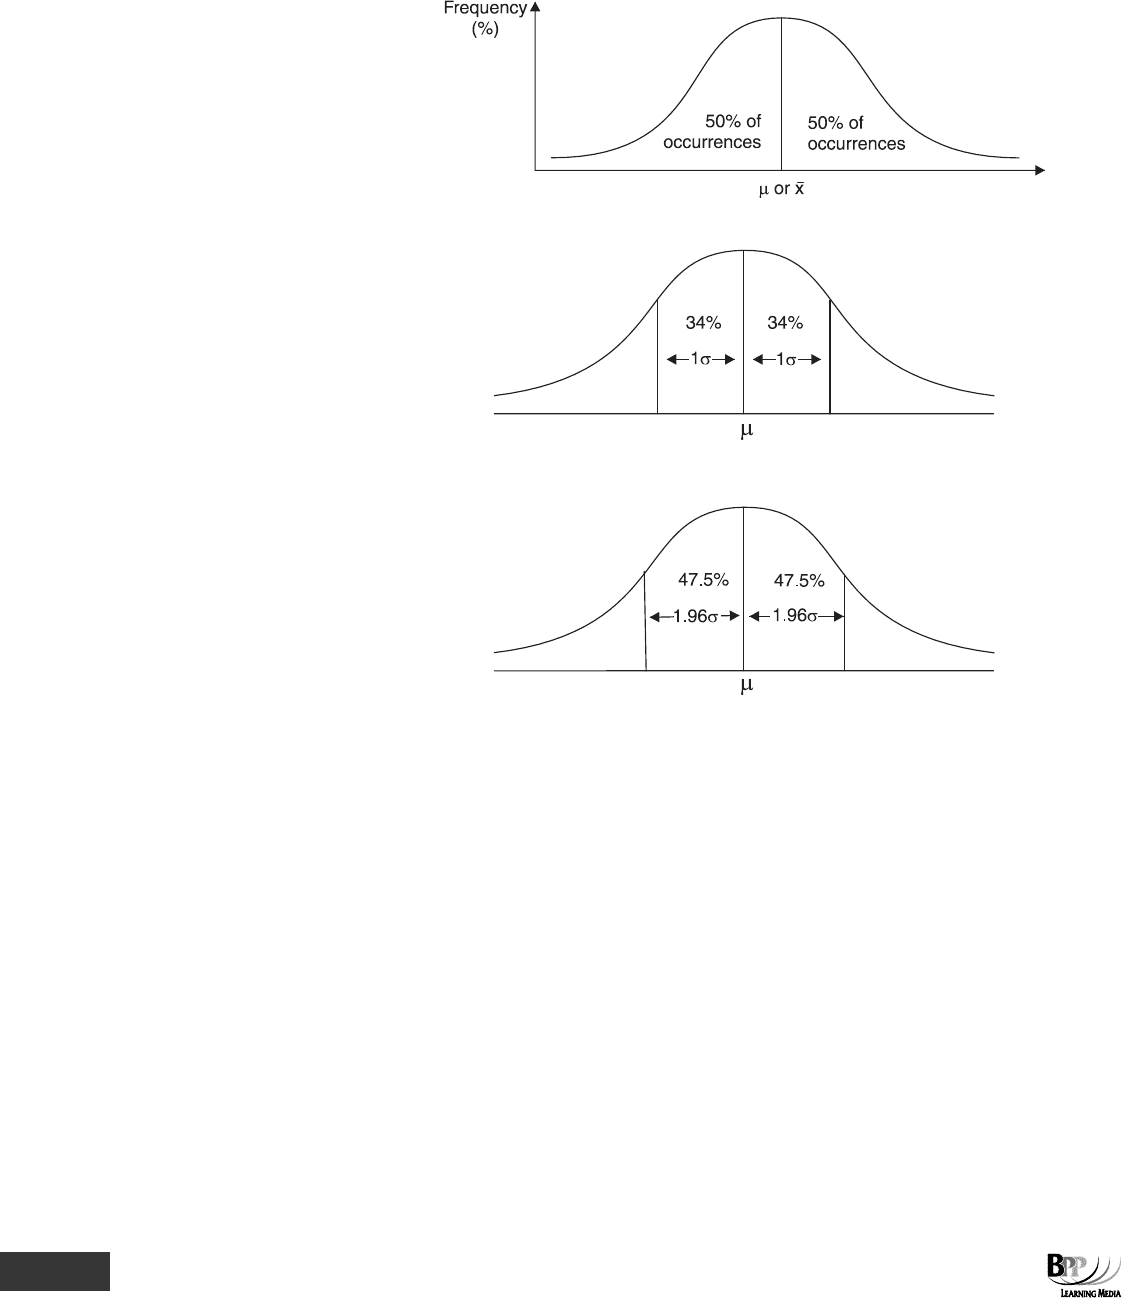
(a) The entire frequency curve represents all the possible outcomes and their frequencies of occurrence.
Since the normal curve is symmetrical, 50% of occurrences have a value greater than the mean
value (μ), and 50% of occurrences have a value less than the mean value (μ).
(b) About 68% of frequencies have a value within one standard deviation either side of the mean.
(c) 95% of the frequencies in a normal distribution occur in the range ± 1.96 standard deviations from
the mean.
You will not need to remember these precise figures as a normal distribution table can be used to
find the relevant proportions and this will be given to you in the exam.
3.2 Normal distribution tables
Although there is an infinite number of normal distributions, depending on values of the mean μ and the standard
deviation σ, the relative dispersion of frequencies around the mean, measured as proportions of the total
population, is exactly the same for all normal distributions. In other words, whatever the normal distribution,
47.5% of outcomes will always be in the range between the mean and 1.96 standard deviations below the mean,
49.5% of outcomes will always be in the range between the mean and 2.58 standard deviations below the mean
and so on.
A normal distribution table, shown at the end of this Study Text, gives the proportion of the total between the
mean and a point above or below the mean for any multiple of the standard deviation.
Part C Probability ⏐ 7: Distributions 193
3.2.1 Example: Normal distribution tables
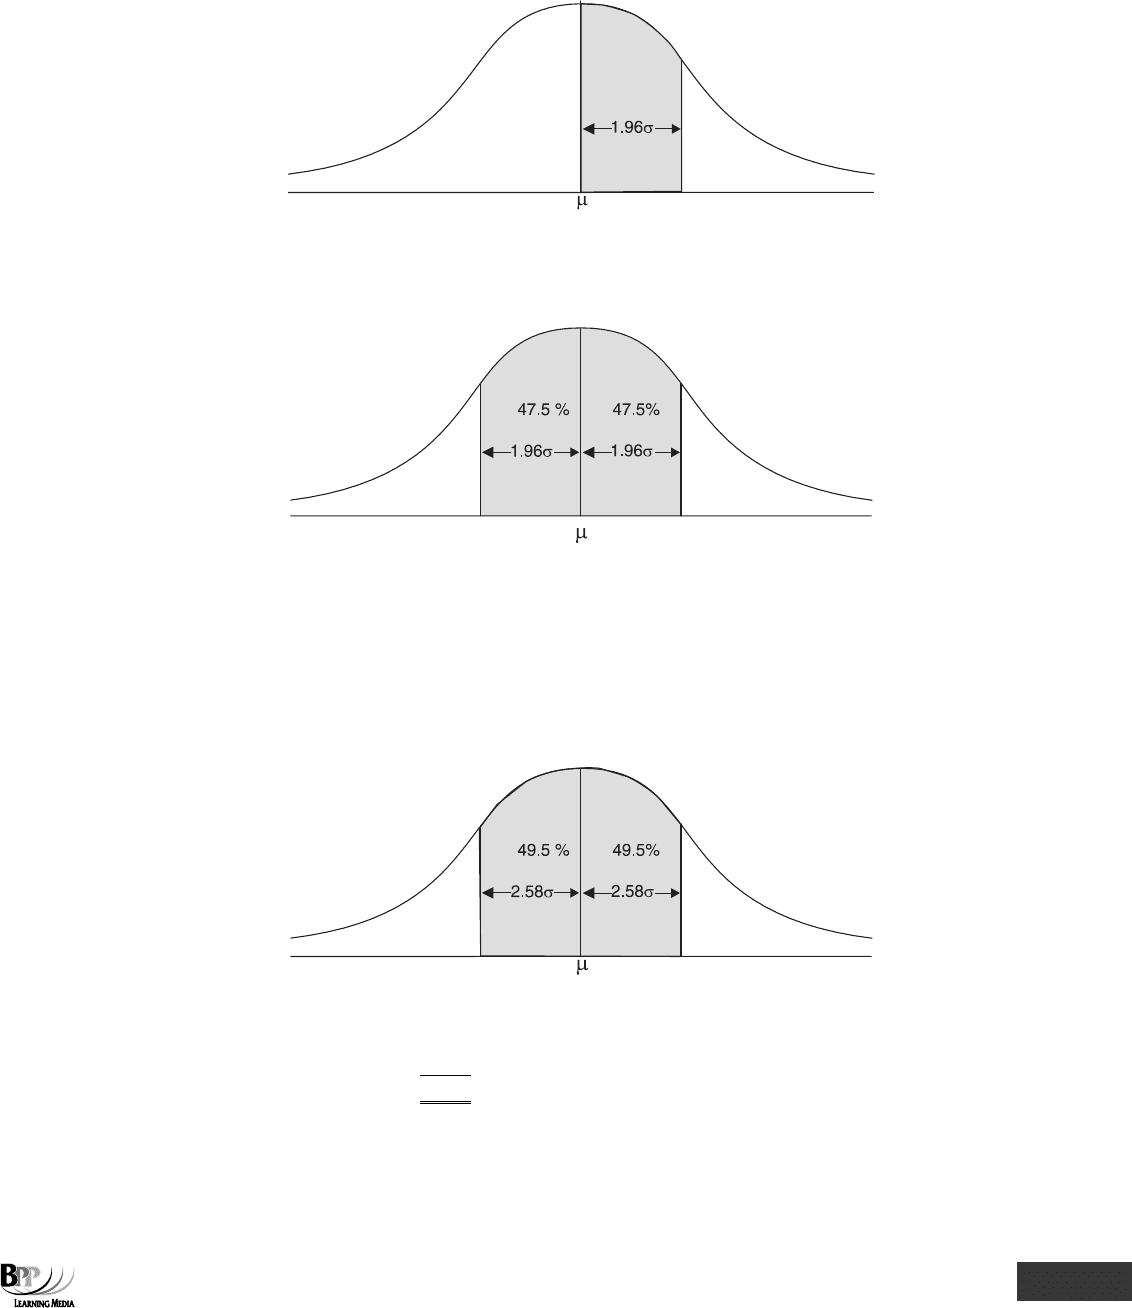
What is the probability that a randomly picked item will be in the shaded area of the diagram below?
Look up 1.96 in the normal distribution table and you will obtain the value .475. This means there is a 47.5%
probability that the item will be in the shaded area.
Since the normal distribution is symmetrical 1.96σ below the mean will also correspond to an area of 47.5%.
The total shaded area = 47.5% × 2 = 95%
In Paragraph 3.1(c) we said that 95% of the frequencies in a normal distribution lie in the range ± 1.96 standard
deviations from the mean but we did not say what this figure was based on. It was of course based on the
corresponding value in the normal distribution tables (when z = 1.96) as shown above.
We can also show that 99% of the frequencies occur in the range ± 2.58 standard deviation from the mean.
Using the normal distribution table, a z score of 2.58 corresponds to an area of 0.4949 (or 49.5%). Remember, the
normal distribution is symmetrical.
49.5% × 2 = 99%
If mean, μ + 2.58σ = 49.5% and
mean, μ − 2.58σ =
49.5%
Range = mean ± 2.58σ =
99.0%
Therefore, 99% of frequencies occur in the range mean (μ) ± 2.58 standard deviations (σ), as proved by using
normal distribution tables.
194 7: Distributions ⏐ Part C Probability
Question
68% of frequencies
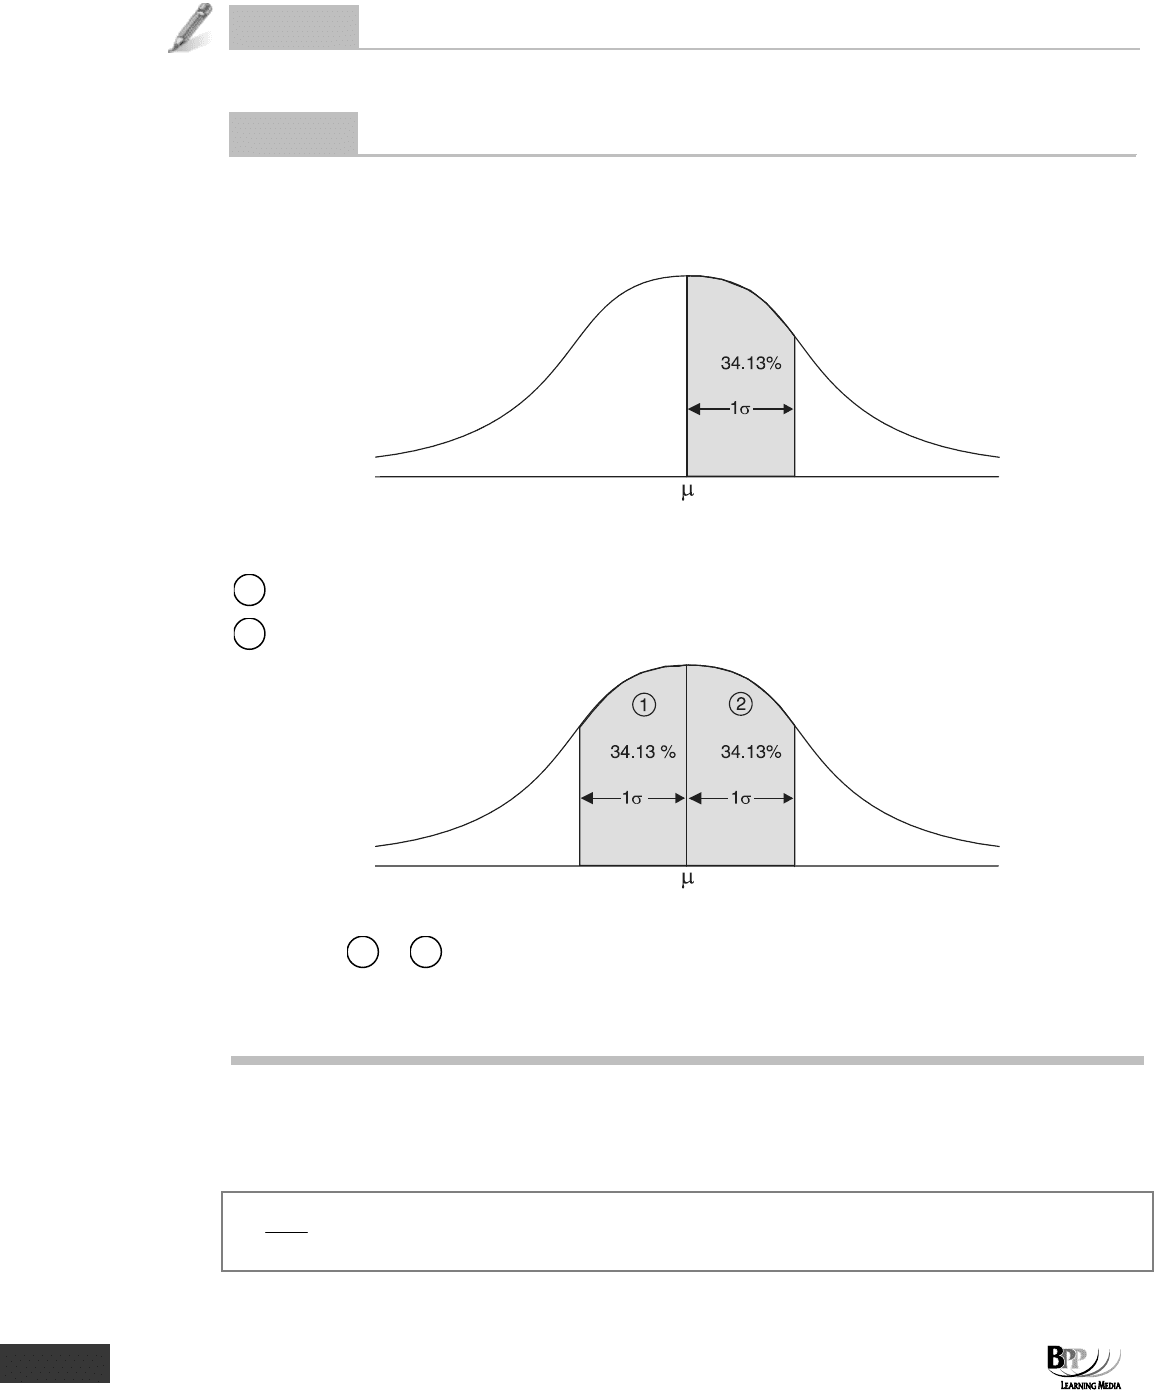
Prove that approximately 68% of frequencies have a value within one standard deviation either side of the mean, μ.
Answe
r
One standard deviation corresponds to z = 1
If z = 1, we can look this value up in normal distribution tables to get a value (area) of 0.3413. One standard
deviation above the mean can be shown on a graph as follows.
The normal distribution is symmetrical, and we must therefore show the area corresponding to one standard
deviation below the mean on the graph also.
1
The area one standard deviation below the mean
2
The area one standard deviation above the mean
Area one standard deviation above and below the mean
=
1
+
2
= 34.13% + 34.13%
= 68.26% 68%
4 Using the normal distribution to calculate probabilities
z =
σ
μ−x
This formula is given to you on the normal distribution table.
Assessment
formula

Part C Probability ⏐ 7: Distributions 195
The normal distribution can be used to calculate probabilities. Sketching a graph of a normal distribution curve
often helps in normal distribution problems.
z =
σ
μ−x
where z = the number of standard deviations above or below the mean (z score)
x = the value of the variable under consideration
μ = the mean
σ = the standard deviation.
4.1 Introduction
In order to calculate probabilities, we need to convert a normal distribution (X) with a mean μ and standard
deviation
σ to the standard normal distribution (z) before using the table to find the probability figure.
4.2 Example: Calculating z
Calculate the following z scores and identify the corresponding proportions using normal distribution tables.
(a) x = 100,
μ = 200, σ = 50
(b) x = 1,000,
μ = 1,200, σ = 200
(c) x = 25,
μ = 30, σ = 6
Solution
(a) z =
σ
μ
_
x
=
50
200100 −
= 2
A z score of 2 corresponds to a proportion of 0.4772 or 47.72%.
(b) z =
σ
μ
_
x
=
200
200,1000,1 −
= 1
A z score of 1 corresponds to a proportion of 0.3413 or 34.13%.
(c) z =
σ
μ
_
x
=
6
3025 −
= 0.8333
0.8333 corresponds to a proportion of 0.2967 or 29.67%
FA
S
T F
O
RWAR
D

196 7: Distributions ⏐ Part C Probability
4.3 Example: Using the normal distribution to calculate probabilities
A frequency distribution is normal, with a mean of 100 and a standard deviation of 10.
Required
Calculate the proportion of the total frequencies which will be:
(a) above 80
(b) above 90
(c) above 100
(d) above 115
(e) below 85
(f) below 95
(g) below 108
(h) in the range 80 – 110
(i) in the range 90 – 95
Solution
(a) If the value (x) is below the mean (μ), the total proportion is 0.5 plus proportion between the value and the
mean (area (a)).
The proportion of the total frequencies which will be above 80 is calculated as follows.
10
10080 −
= 2 standard deviations
below the mean.
From the tables, where z = 2 the proportion is 0.4772.
The proportion of frequencies above 80 is 0.5 + 0.4772 = 0.9772.
(b) The proportion of the total frequencies which will be above 90 is calculated as follows.
10
10090 −
= 1 standard deviation below the mean.
From the tables, when z = 1, the proportion is 0.3413.
The proportion of frequencies above 90 is 0.5 + 0.3413 = 0.8413.
(c) 100 is the mean. The proportion above this is 0.5. (The normal curve is symmetrical and 50% of
occurrences have a value greater than the mean, and 50% of occurrences have a value less than the mean.)
(d) If the value is above the mean, the proportion (b) is 0.5 minus the proportion between the value and the
mean (area (a)).

Part C Probability ⏐ 7: Distributions 197
The proportion of the total frequencies which will be above 115 is calculated as follows.
10
100115
−
= 1.5 standard deviations above the mean.
From the tables, where z = 1.5, the proportion is 0.4332.
The proportion of frequencies above 115 is therefore 0.5 – 0.4332 = 0.0668.
(e) If the value is
below the mean, the proportion (b) is 0.5 minus the proportion between the value and the mean
(area (a)).
The proportion of the total frequencies which will be below 85 is calculated as follows.
10
10085
−
= 1.5 standard deviations below the mean.
The proportion of frequencies below 85 is therefore the same as the proportion above 115 = 0.0668.
(f) The proportion of the total frequencies which will be below 95 is calculated as follows.
10
10095
−
= 0.5 standard deviations below the mean.
When z = 0.5, the proportion from the tables is 0.1915. The proportion of frequencies below 95 is therefore
0.5 – 0.1915 = 0.3085.
(g) If the value is
above the mean, the proportion required is 0.5 plus the proportion between the value and the
mean (area (a)).
The proportion of the total frequencies which will be below 108 is calculated as follows.
10
100108
−
= 0.8 standard deviations above the mean.

198 7: Distributions ⏐ Part C Probability
From the tables for z = 0.8 the proportion is 0.2881.
The proportion of frequencies below 108 is 0.5 + 0.2881 = 0.7881.
(h) The proportion of the total frequencies which will be in the range 80–110 is calculated as follows. The range
80 to 110 may be divided into two parts:
(i) 80 to 100 (the mean);
(ii) 100 to 110.
The proportion in the range 80 to 100 is (2 standard deviations) 0.4772
The proportion in the range 100 to 110 is (1 standard deviation) 0.3413
The proportion in the total range 80 to 110 is 0.4772 + 0.3413 = 0.8185.
(i) The range 90 to 95 may be analysed as:
(i) the proportion above 90 and below the mean
(ii) minus the proportion above 95 and below the mean
Proportion above 90 and below the mean (1 standard deviation)
0.3413
Proportion above 95 and below the mean (0.5 standard deviations)
0.1915
Proportion between 90 and 95
0.1498
Question
Normal distribution and proportions
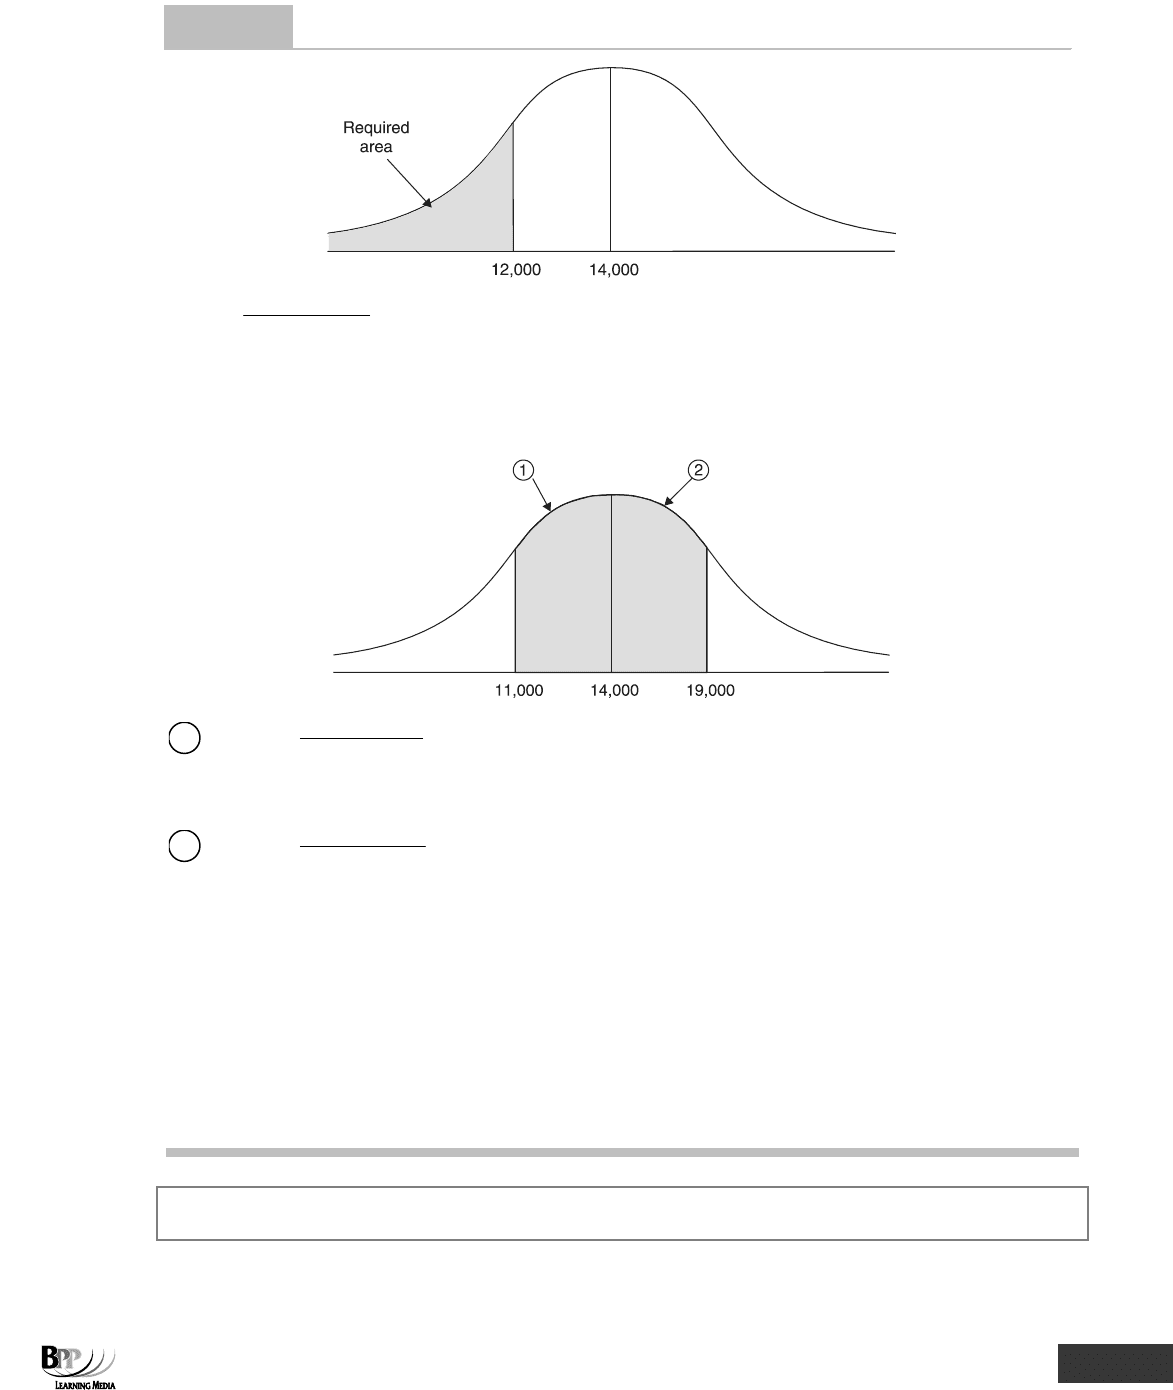
The salaries of employees in an industry are normally distributed, with a mean of $14,000 and a standard deviation
of $2,700.
Required
(a) Calculate the proportion of employees who earn less than $12,000.
(b) Calculate the proportion of employees who earn between $11,000 and $19,000.
Part C Probability ⏐ 7: Distributions 199
Answe
r
(a)
z =
700,2
000,14000,12
−
=
−0.74
From normal distribution tables, the proportion of salaries between $12,000 and $14,000 is 0.2704 (from tables).
The proportion of salaries less than $12,000 is therefore 0.5 – 0.2704 = 0.2296.
(b)
1
z =
700,2
000,14000,11 −
= 1.11
2
z =
700,2
000,14000,19
−
= 1.85
The proportion with earnings between $11,000 and $14,000 is 0.3665 (from tables where z = 1.11).
The proportion with earnings between $14,000 and $19,000 is 0.4678 (from tables where z = 1.85).
The required proportion is therefore 0.3665 + 0.4678 = 0.8343.
Note that
the normal distribution is, in fact, a way of calculating probabilities. In this question, for example, the
probability that an employee earns less than $12,000 (part (a)) is 0.2296 (or 22.96%) and the probability that an
employee earns between $11,000 and $19,000 is 0.8343 (or 83.43%).
Make sure you always draw a sketch of a normal distribution to identify the areas that you are concerned with.
Assessment
focus point