CIMA - C3 Fundamentals Of Business Mathematics
Подождите немного. Документ загружается.

110 3: Data presentation ⏐ Part B Summarising and analysing data
Month Production Factory cost
Thousands $'000
20X8
November 7 45
December 10 59
20X9
January 13 75
February 14 80
March 11 65
April 7 46
May 5 35
June 4 30
July 3 25
August 2 20
September 1 15
October 5 35
You may assume that the value of money remained stable throughout the year.
Required
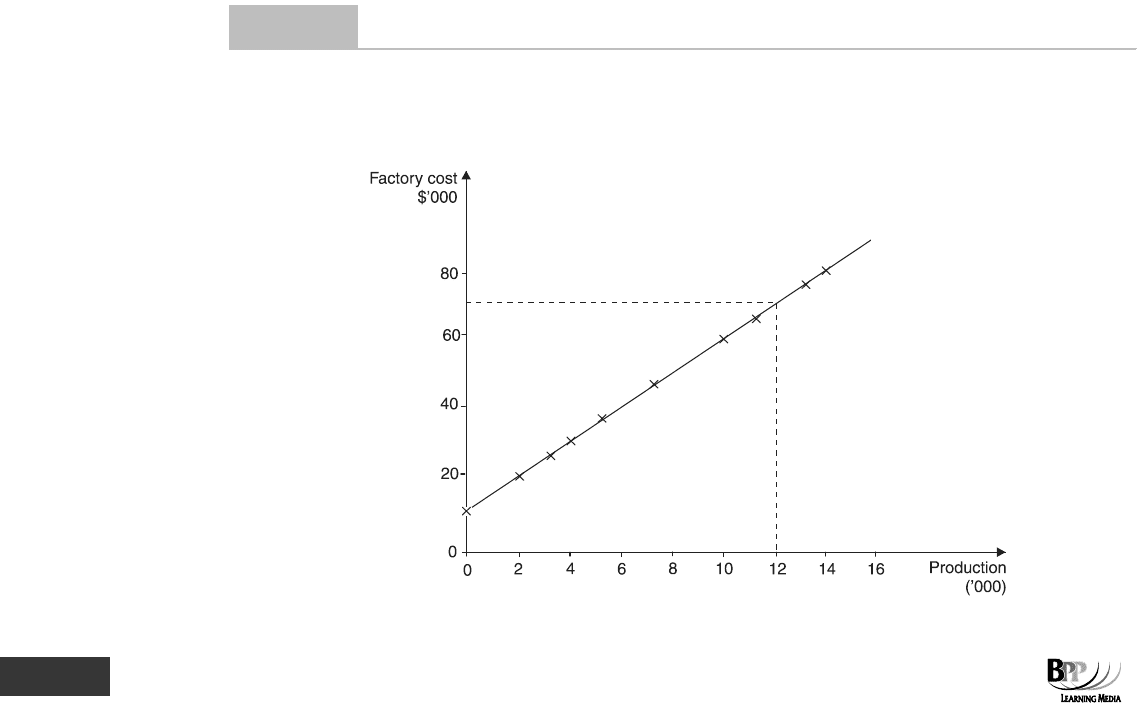
(a) Draw a scatter diagram related to the data provided above, and plot on it the line of best fit.
(b) Now answer the following questions.
(i) What would you expect the factory cost to have been if 12,000 widgets had been produced in a
particular month?
(ii) What is your estimate of WDG
's monthly fixed cost?
Answe
r
Your answers to parts (b)(i) and (ii) may have been slightly different from those given here, but they should not
have been very different, because the data points lay very nearly along a straight line.
(a) WDG Co – Scatter diagram of production and factory costs, November 20X8-October 20X9
Part B Summarising and analysing data ⏐ 3: Data presentation 111
(b) (i) The estimated factory cost for a production of 12,000 widgets is $70,000.
(ii) The monthly fixed costs are indicated by the point where the line of best fit meets the vertical axis
(costs at zero production). The fixed costs are estimated as $10,000 a month.
7 Using spreadsheets
Excel includes the facility to produce a range of charts and graphs. The Chart Wizard provides a tool to simplify the
process of chart construction.
As we saw in Chapter 1b, using Microsoft Excel, it is possible to display data held in a range of spreadsheet cells in
a variety of charts or graphs.
7.1 Creating a histogram
Earlier in this chapter, we looked at data on output and number of employees. We will now use the same data to
illustrate how Excel can be used to create a histogram. The data is first input into a spreadsheet as follows.
A B C D
1
Weekly output per employee
2
3
1087 850 1084 792
4
924 1226 1012 1205
5
1265 1028 1230 1182
6
1086 1130 989 1155
7
1134 1166 1129 1160
The next step is to calculate the frequencies using the FREQUENCY function. This function calculates how often
values occur within a
range of values, and then returns a vertical array of numbers. Since FREQUENCY returns an
array, it must be entered as an array formula. The format is =FREQUENCY(DATARANGE,BIN) where BIN is the
required range to be used for the x axis. This has been input into cells F3 to F9 in the spreadsheet below.
To enter the FREQUENCY formula, first select the range G3:G9 and then enter =FREQUENCY(A3:D7,F3:F9) and hold
down the CTRL and SHIFT keys as you press ENTER.
A B C D E F G
1
Weekly output per employee
2
Output Frequency
3
1087 850 1084 792 700 0
4
924 1226 1012 1205 800 1
5
1265 1028 1230 1182 900 1
6
1086 1130 989 1155 1000 2
7
1134 1166 1129 1160 1100 5
8
1200 7
9
1300 4
FA
S
T F
O
RWAR
D
112 3: Data presentation ⏐ Part B Summarising and analysing data
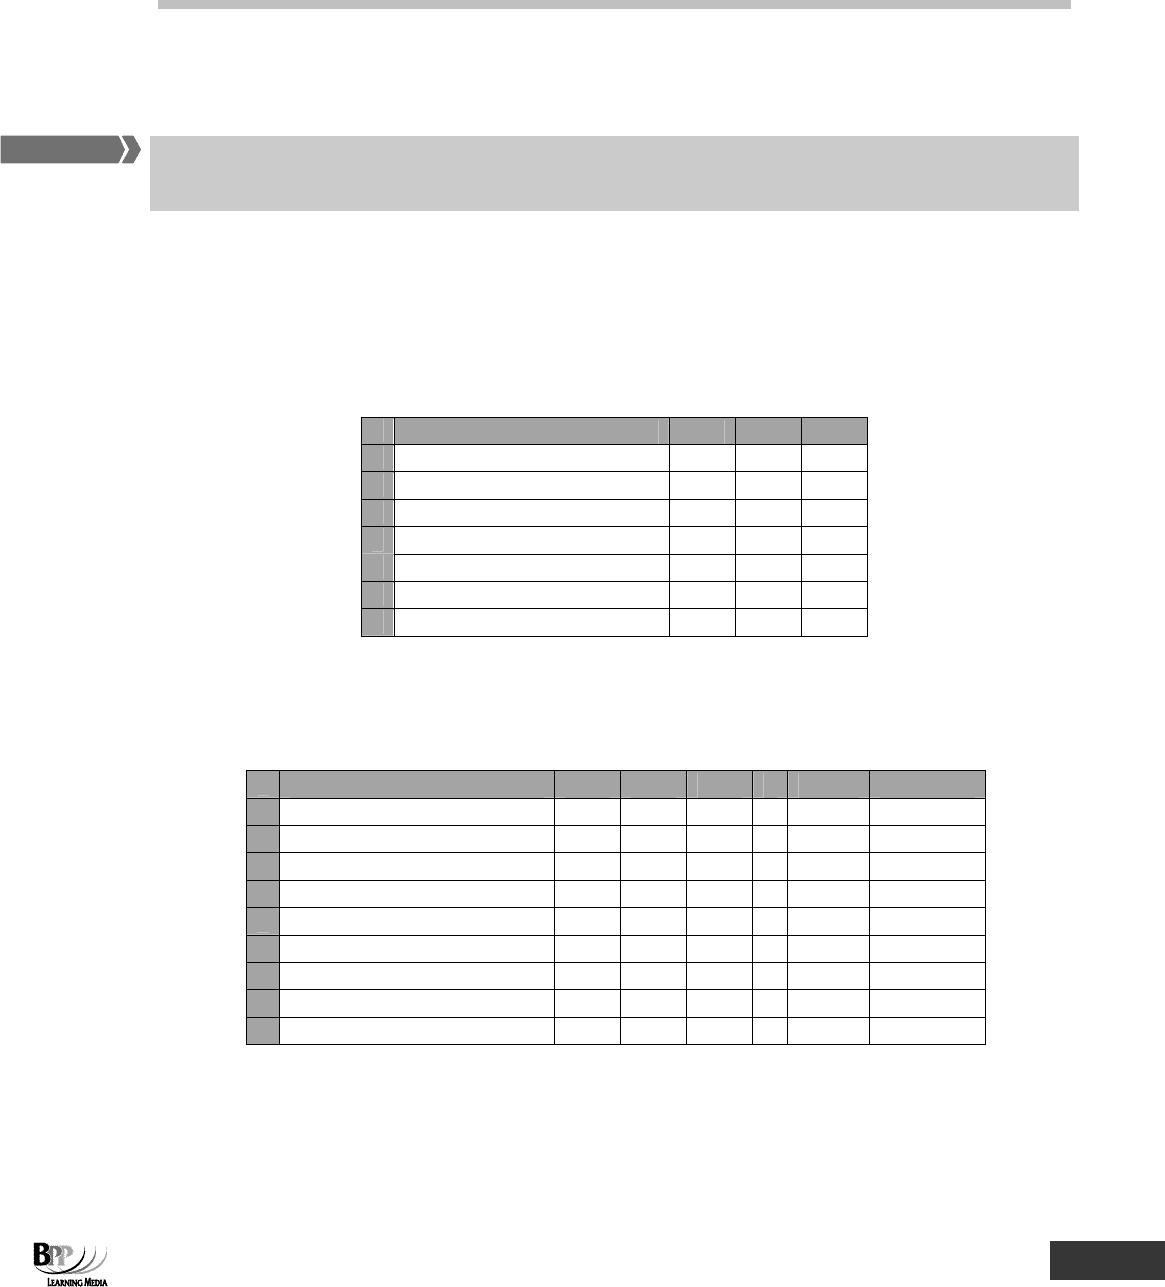
We can now use the Chart Wizard to produce a histogram from the frequency data. Select the range G3:G9 and
click on the chart icon. Select the
column option and then in Step 2 click on the series tab and click in the box next
to 'Category (x) axis labels'. Select the range F3:F9 and click finish.
Frequency distribution
0
2
4
6
8
700 800 900 1000 1100 1200 1300
Output
Frequency
In order to make the bars touch, right click on one of the bars on the chart, select FORMAT DATA SERIES, then
OPTIONS. Set the gap width to zero.
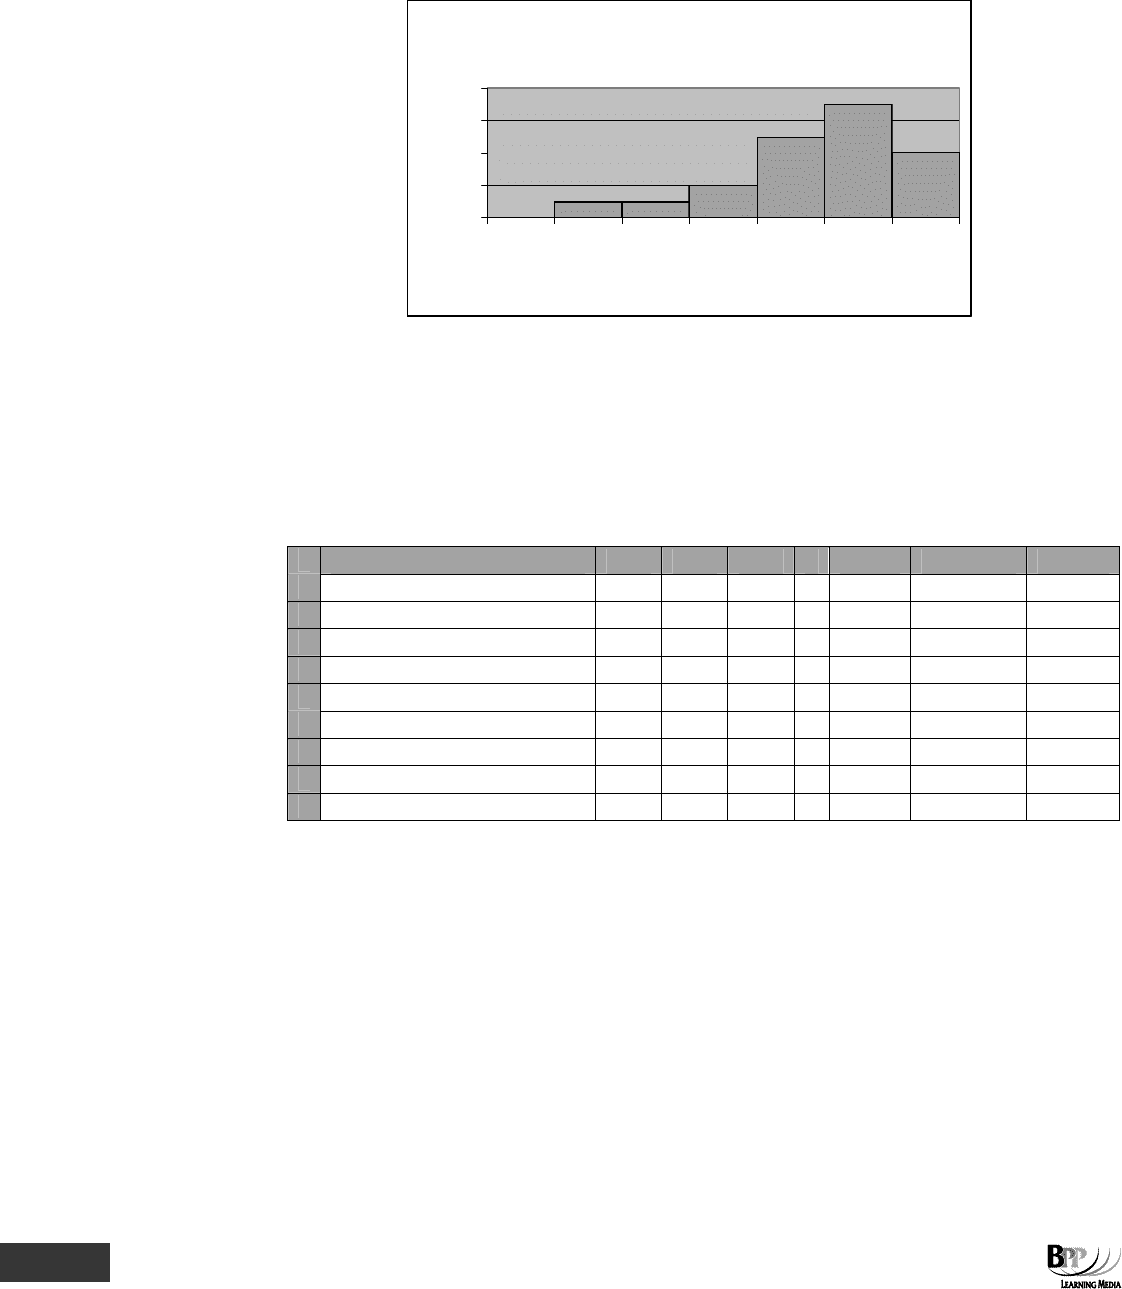
7.2 Creating an ogive
Excel can also be used to draw an ogive, the graph of a cumulative frequency distribution. In the spreadsheet
below, a column for
cumulative frequency has been inserted. The cumulative frequencies are calculated by
entering =G3 into cell H3, then =H3+G4 into cell H4. This formula has then been copied down to cell H9.
A B C D E F G H
1
Weekly output per employee
2
Output Frequency Cum frq
3
1087 850 1084 792 700 0 0
4
924 1226 1012 1205 800 1 1
5
1265 1028 1230 1182 900 1 2
6
1086 1130 989 1155 1000 2 4
7
1134 1166 1129 1160 1100 5 9
8
1200 7 16
9
1300 4 20
We can now use the Chart Wizard to produce an ogive using the XY chart option. First select the range F3:F9 then
hold down the CTRL key and select the range H3:H9. Click on the chart icon and select the XY (scatter) with lines
option. Add titles to the chart.
Part B Summarising and analysing data ⏐ 3: Data presentation 113
Ogive
0
5
10
15
20
25
0 500 1000 1500
Output
Cumulative
frequency
Chapter Roundup
• Tables are a simple way of presenting information about two variables.
• Charts often convey the meaning or significance of data more clearly than would a table.
• There are three main types of bar chart: simple, component (including percentage component) and multiple (or
compound).
• Frequency distributions are used if values of particular variables occur more than once.
• A frequency distribution can be represented pictorially by means of a histogram. The number of observations in a
class is represented by the area covered by the bar, rather than by its height.
• An ogive shows the cumulative number of items with a value less than or equal to, or alternatively greater than or
equal to, a certain amount.
• Scatter diagrams are graphs which are used to exhibit data, (rather than equations) in order to compare the way in
which two variables vary with each other.
• Excel includes the facility to produce a range of charts and graphs. The Chart Wizard provides a tool to simplify the
process of chart construction.

114 3: Data presentation ⏐ Part B Summarising and analysing data
Quick Quiz
1 Which of the following is not recommended when producing a table of information?
A Keeping accuracy to a maximum
B Clearly labelling all columns
C Eliminating unnecessary information
D Ordering columns and rows by order of importance and magnitude
2 When selecting a standard width of bar in a histogram you would select the size of the class interval which occurs
most frequently.
True
F
False F
3 A grouped frequency distribution can be drawn as a(n) histogram/ogive, whereas a cumulative frequency
distribution can be graphed as a(n) ogive/histogram.
4 A scatter diagram has an x axis and a y axis which represent dependent and independent variables as follows.
x axis independent variable
y axis dependent variable
5 Which Excel function can be used to calculate how often values occur within a range of values?
6 In a histogram, one class is ¾ the width of the other classes. If the score in that class is 33, the correct height to
plot on the histogram is
7 A pie chart is used to display the following data:
Sales %
Region A 26
Region B 41
Region C 33
What angle on the pie chart will be used to represent Region C's share of sales?
A 33
B 237.6
C 118.8
D 59.4
8 A cumulative frequency distribution of output of employees is as follows:
Weekly output Cumulative frequency
Units
Less than 150 90
Less than 200 250
Less than 300 310
Less than 400 340
Less than 600 350
How many employees produced more than 200 units?
How many employees produced between 200 and 300 units?
]
[
?
Part B Summarising and analysing data ⏐ 3: Data presentation 115
Answers to Quick Quiz
1 A Maximising accuracy would make the table too detailed and hard to understand.
2 True
3 A grouped frequency distribution can be drawn as a
histogram, whereas a cumulative frequency distribution can
be graphed as an
ogive.
4 x axis independent variable
y axis dependent variable
5 Frequencies are calculated in Excel using the FREQUENCY function.
6
0.75
33
= 44
7 C Region C's angle is given by 33% × 360 = 118.8
8 produced more than 200 units
produced between 200 and 300 units
Now try the questions below from the Exam Question Bank
Question numbers Pages
31-37 330-332
]
[
44
1
00
60

116 3: Data presentation ⏐ Part B Summarising and analysing data
117
Topic list Syllabus references
1 The arithmetic mean C, (iv), (4)
2 The mode C, (iv), (4)
3 The median C, (iv), (4)
Averages
Introduction
In Chapter 3 we saw how data can be summarised and presented in tabular, chart and
graphical formats. Sometimes you might need more information than that provided by
diagrammatic representations of data. In such circumstances you may need to apply some
sort of numerical analysis, for example you might wish to calculate a measure of centrality
and a measure of dispersion. In Chapter 4b we will look at measures of dispersion, in this
chapter measures of centrality, or averages.
An average is a representative figure that is used to give some impression of the size of all
the items in the population. There are three main types of average.
• Arithmetic mean
• Mode
• Median
We will be looking at each of these averages in turn, their calculation, advantages and
disadvantages. In the next chapter we will move on to the second type of numerical measure,
measures of dispersion.

118 4a: Averages ⏐ Part B Summarising and analysing data
1 The arithmetic mean
1.1 Arithmetic mean of ungrouped data
The arithmetic mean is the best known type of average and is widely understood. It is used for further statistical
analysis.
Arithmetic mean of ungrouped data =
itemsofNumber
itemsofvaluesofSum
The arithmetic mean of a variable x is shown as
x
('x bar').
1.1.1 Example: The arithmetic mean
The demand for a product on each of 20 days was as follows (in units).
3 12 7 17 3 14 9 6 11 10 1 4 19 7 15 6 9 12 12 8
The arithmetic mean of daily demand is
x
.
x
=
days of Number
demand of Sum
=
20
185
= 9.25 units
In this example, demand on any one day is never actually 9.25 units. The arithmetic mean is merely an
average
representation
of demand on each of the 20 days.
1.2 Arithmetic mean of data in a frequency distribution
It is more likely in an assessment that you will be asked to calculate the arithmetic mean of a frequency
distribution
. In our previous example, the frequency distribution would be shown as follows.
Daily demand
Frequency
Demand
×
frequency
x
f
fx
1
1
1
3
2
6
4
1
4
6
2
12
7
2
14
8
1
8
9
2
18
10
1
10
11
1
11
12
3
36
14
1
14
15
1
15
17
1
17
19
1
19
20
185
x
=
20
185
= 9.25
FA
S
T F
O
RWAR
D
Part B Summarising and analysing data ⏐ 4a: Averages 119
1.3 Sigma, Σ
Σ means 'the sum of' and is used as shorthand to mean 'the sum of a set of values'.
In the previous example:
(a)
∑f would mean the sum of all the frequencies, which is 20
(b)
∑fx would mean the sum of all the values of 'frequency multiplied by daily demand', that is, all 14
values of fx, so
∑fx = 185
1.4 Arithmetic mean of grouped data in class intervals
The arithmetic mean of grouped data,
f
fx
or
n
fx
x
∑
∑
∑
=
where n is the number of values recorded, or the number
of items measured.
This formula will be given to you in your exam.
You might also be asked to calculate (or at least approximate) the arithmetic mean of a frequency distribution,
where the frequencies are shown in class intervals.
1.4.1 Example: The arithmetic mean of grouped data
Using the example in Paragraph 1.2, the frequency distribution might have been shown as follows.
Daily demand Frequency
> 0 ≤ 5 4
> 5
≤ 10 8
>10
≤ 15 6
>15
≤ 20
2
20
There is, of course, an extra difficulty with finding the average now; as the data have been collected into classes, a
certain amount of detail has been lost and the values of the variables to be used in the calculation of the mean are
not clearly specified.
1.4.2 The mid-point of class intervals
To calculate the arithmetic mean of grouped data we therefore need to decide on a value which best represents all
of the values in a particular class interval
. This value is known as the mid-point.
The
mid-point of each class interval is conventionally taken, on the assumption that the frequencies occur evenly
over the class interval range. In the example above, the variable is discrete, so the first class includes 1, 2, 3, 4 and
5, giving a mid-point of 3. With a
continuous variable, the mid-points would have been 2.5, 7.5 and so on. Once
the value of x has been decided, the mean is calculated using the formula for the arithmetic mean of grouped data.
Key term
FA
S
T F
O
RWAR
D
Assessment
formula