CIMA - C3 Fundamentals Of Business Mathematics
Подождите немного. Документ загружается.


130 4a: Averages ⏐ Part B Summarising and analysing data
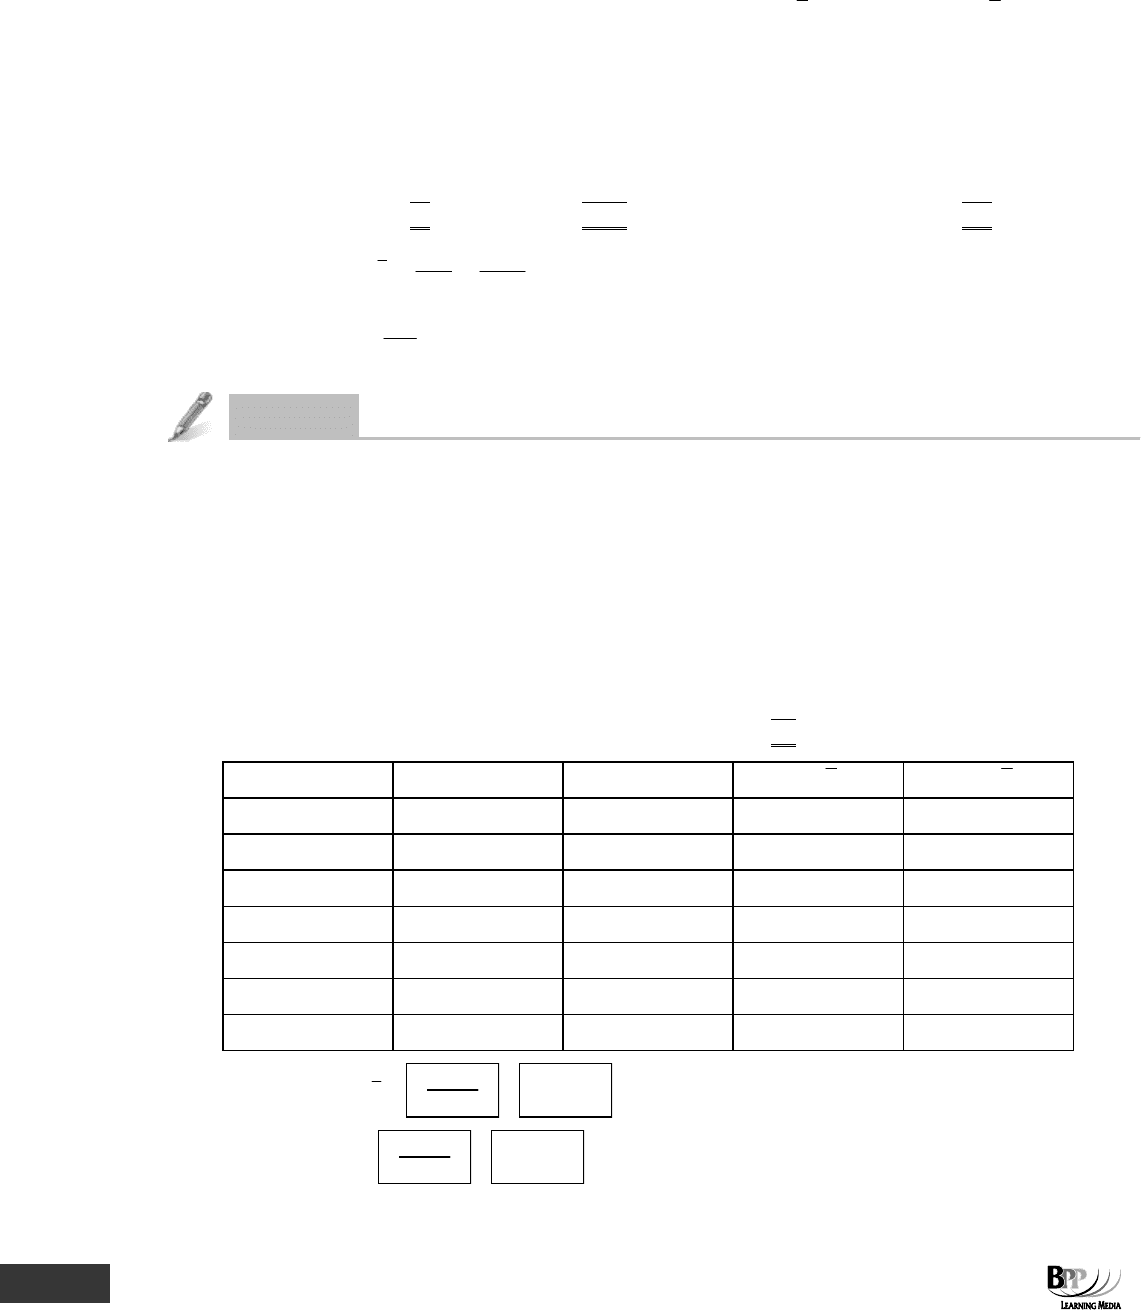
4 Class interval Mid-point Mid-point
(Discrete data) (Continuous data)
25 < 30 27
27.5
30 < 35 32
32.5
35 < 40 37
37.5
40 < 45 42
42.5
45 < 50 47
47.5
50 < 55 52
52.5
55 < 60 57
57.5
60 < 65 62
62.5
5 (a) Histogram
(b) Ogive
6 6, 7, 8, 9, 10, 11, 12, 13
Median is 9½
Now try the questions below from the Exam Question Bank
Question numbers Pages
38-42 332-333
9
½
131
Topic list Syllabus references
1 The range C, (iv), (4)
2 Quartiles and the semi-interquartile range C, (iv), (4)
3 The mean deviation C, (iv), (4)
4 The variance and the standard deviation C, (iv), (4)
5 The coefficient of variation C, (iv), (4)
6 Skewness C, (iv), (4)
7 Using spreadsheets G, (i), (1)
Dispersion
Introduction
In Chapter 4a we introduced the first type of statistic that can be used to describe certain
aspects of a set of data – averages. Averages are a method of determining the 'location' or
central point of a distribution, but they give no information about the dispersion of values in
the distribution.
Measures of dispersion give some idea of the spread of a variable about its average. The
main measures are as follows.
• The range
• The semi-interquartile range
• The standard deviation
• The variance
• The coefficient of variation
132 4b: Dispersion ⏐ Part B Summarising and analysing data
1 The range
The range is the difference between the highest and lowest observations.
1.1 Main properties of the range as a measure of spread
• It is easy to find and to understand
• It is easily affected by one or two extreme values
• It gives no indication of spread between the extremes
• It is not suitable for further statistical analysis
Question
Mean and range
Calculate the mean and the range of the following set of data.
4 8 7 3 5 16 24 5
Mean Range
Answe
r
Mean Range
9 21
Workings
Mean,
8
72
x =
= 9
Range = 24 – 3 = 21.
2 Quartiles and the semi-interquartile range
2.1 Quartiles
The quartiles and the median divide the population into four groups of equal size.
Quartiles are one means of identifying the range within which most of the values in the population occur.
• The lower quartile (Q
1
) is the value below which 25% of the population fall
• The upper quartile (Q
3
) is the value above which 25% of the population fall
• The median (Q
2
) is the value of the middle member of an array
Key term
FA
S
T F
O
RWAR
D
FA
S
T F
O
RWAR
D
Part B Summarising and analysing data ⏐ 4b: Dispersion 133
2.1.1 Example: Quartiles
If we had 11 data items:
• Q
1
= 11 × 1/4 = 2.75 = 3
rd
item
• Q
3
= 11 × 3/4 = 8.25 = 9
th
item
• Q
2
= 11 × 1/2 = 5.5 = 6
th
item
2.2 The semi-interquartile range
The semi-interquartile range is half the difference between the upper and lower quartiles.
The lower and upper quartiles can be used to calculate a measure of spread called the semi-interquartile range.
The semi-interquartile range is half the difference between the lower and upper quartiles and is sometimes called
the quartile deviation,
2
)Q
_
(Q
13
.
For example, if the lower and upper quartiles of a frequency distribution were 6 and 11, the semi-interquartile
range of the distribution would be (11 – 6)/2 = 2.5 units. This shows that the average distance of a quartile from
the median is 2.5. The smaller the quartile deviation, the less dispersed is the distribution.
As with the range, the quartile deviation may be misleading as a measure of spread. If the majority of the data are
towards the lower end of the range then the third quartile will be considerably further above the median than the
first quartile is below it, and when the two distances from the median are averaged the difference is disguised.
Therefore it is often better to quote the actual values of the two quartiles, rather than the quartile deviation.
2.3 The inter-quartile range
The inter-quartile range is the difference between the values of the upper and lower quartiles (Q
3
– Q
1
) and hence
shows the range of values of the middle half of the population.
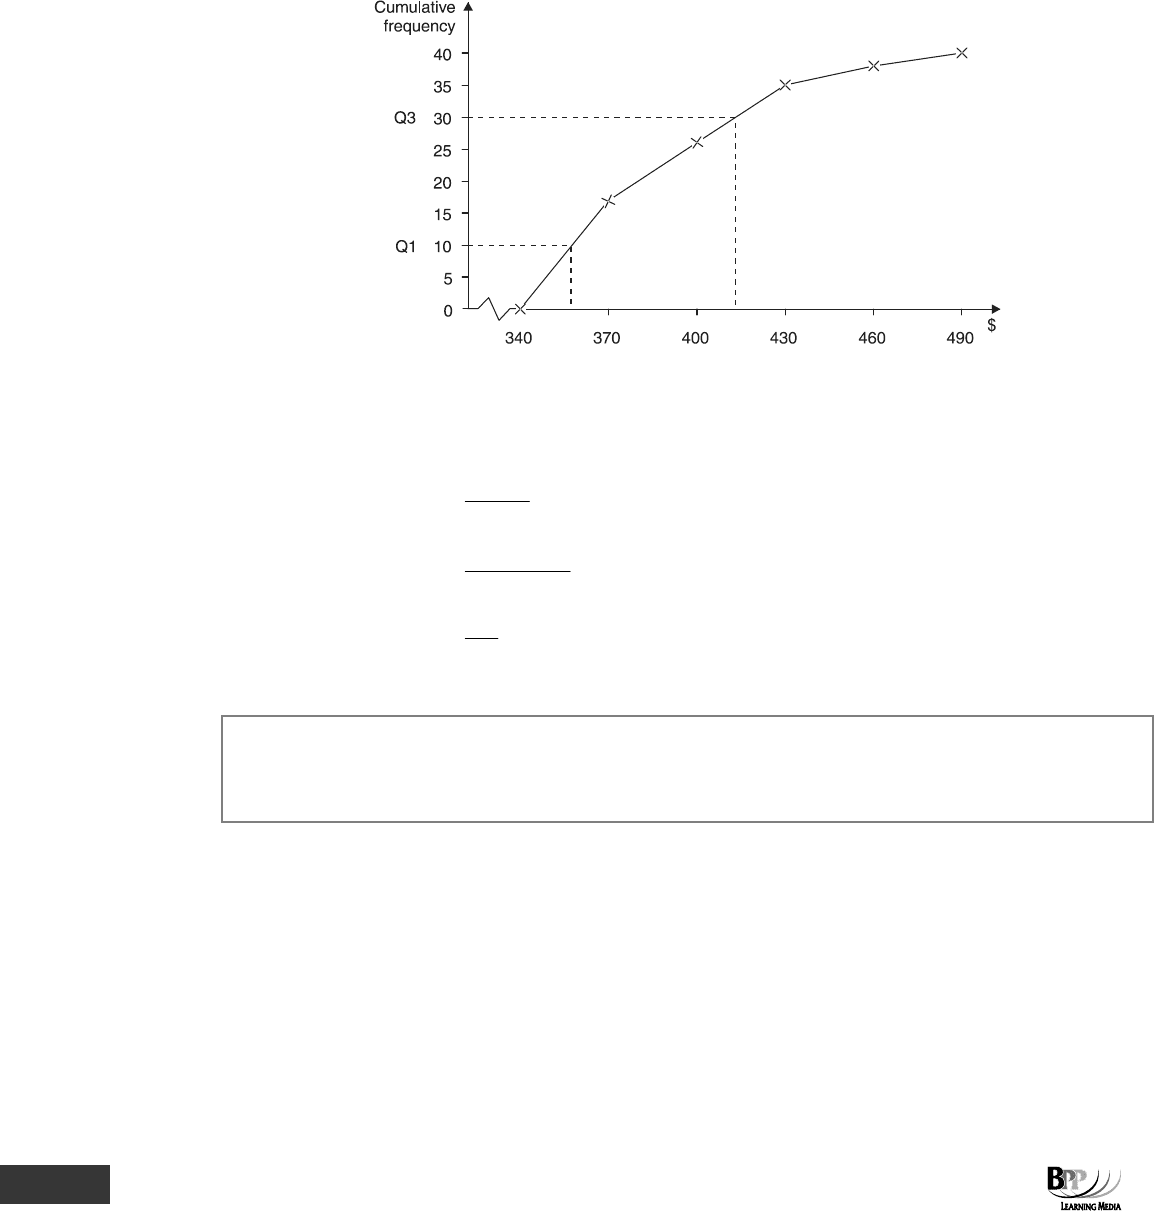
2.4 Example: Using ogives to find the semi-interquartile range
Construct an ogive of the following frequency distribution and hence establish the semi-interquartile range.
Class
Frequency
Cumulative frequency
$
≥ 340, < 370
17
17
≥ 370, < 400
9
26
≥ 400, < 430
9
35
≥ 430, < 460
3
38
≥ 460, < 490
2
40
40
Key term
FA
S
T F
O
RWAR
D
FA
S
T F
O
RWAR
D
134 4b: Dispersion ⏐ Part B Summarising and analysing data
Solution
Establish which items are Q
1
and Q
3
(the lower and upper quartiles respectively).
Upper quartile (Q
3
) = 3/4 × 40 = 30
th
value
Lower quartile (Q
1
) = 1/4 × 40 = 10
th
value
Reading off the values from the ogive, approximate values are as follows.
Q
3
(upper quartile) = $412
Q
1
(lower quartile) = $358
Semi-interquartile range =
2
QQ
13
−
=
2
)358412$( −
=
2
54$
= $27
Remember that the median is equal to Q
2
(the point above which, and below which, 50% of the population fall). In
the example in Paragraph 2.4 the median would be the 40/2 = 20
th
item which could be found from reading off the
ogive (approximately 385).
2.5 Deciles
As we have seen, quartiles divide a cumulative distribution into quarters. We can also divide the cumulative
distribution into tenths to produce deciles. For example, the first decile will have 10% of values below it and 90%
above it.
Assessment
focus point

Part B Summarising and analysing data ⏐ 4b: Dispersion 135
3 The mean deviation
3.1 Measuring dispersion
Because it only uses the middle 50% of the population, the inter-quartile range is a useful measure of dispersion if
there are extreme values in the distribution. If there are no extreme values which could potentially distort a
measure of dispersion, however, it seems unreasonable to exclude 50% of the data. The mean deviation (the topic
of this section), and the standard deviation (the topic of Section 4) are often more useful measures.
The mean deviation is a measure of the average amount by which the values in a distribution differ from the
arithmetic mean.
Mean deviation =
n
lxlxf −Σ
You will need to know this formula for your assessment but we are using it to build up your understanding of this
topic.
3.2 Explaining the mean deviation formula
(a) I–Ix x is the difference between each value (x) in the distribution and the arithmetic mean x of the
distribution. When calculating the mean deviation for grouped data the deviations should be
measured to the midpoint of each class: that is, x is the midpoint of the class interval. The vertical
bars mean that all differences are taken as positive since the total of all of the differences, if this is
not done, will always equal zero. Thus if x = 3 and
x = 5, then x – x = –2 but I
–
Ix x = 2.
(b) f
I–Ix x
is the value in (a) above, multiplied by the frequency for the class.
(c) ∑f
I–Ix x is the sum of the results of all the calculations in (b) above.
(d) n (which equals ∑f) is the number of items in the distribution.
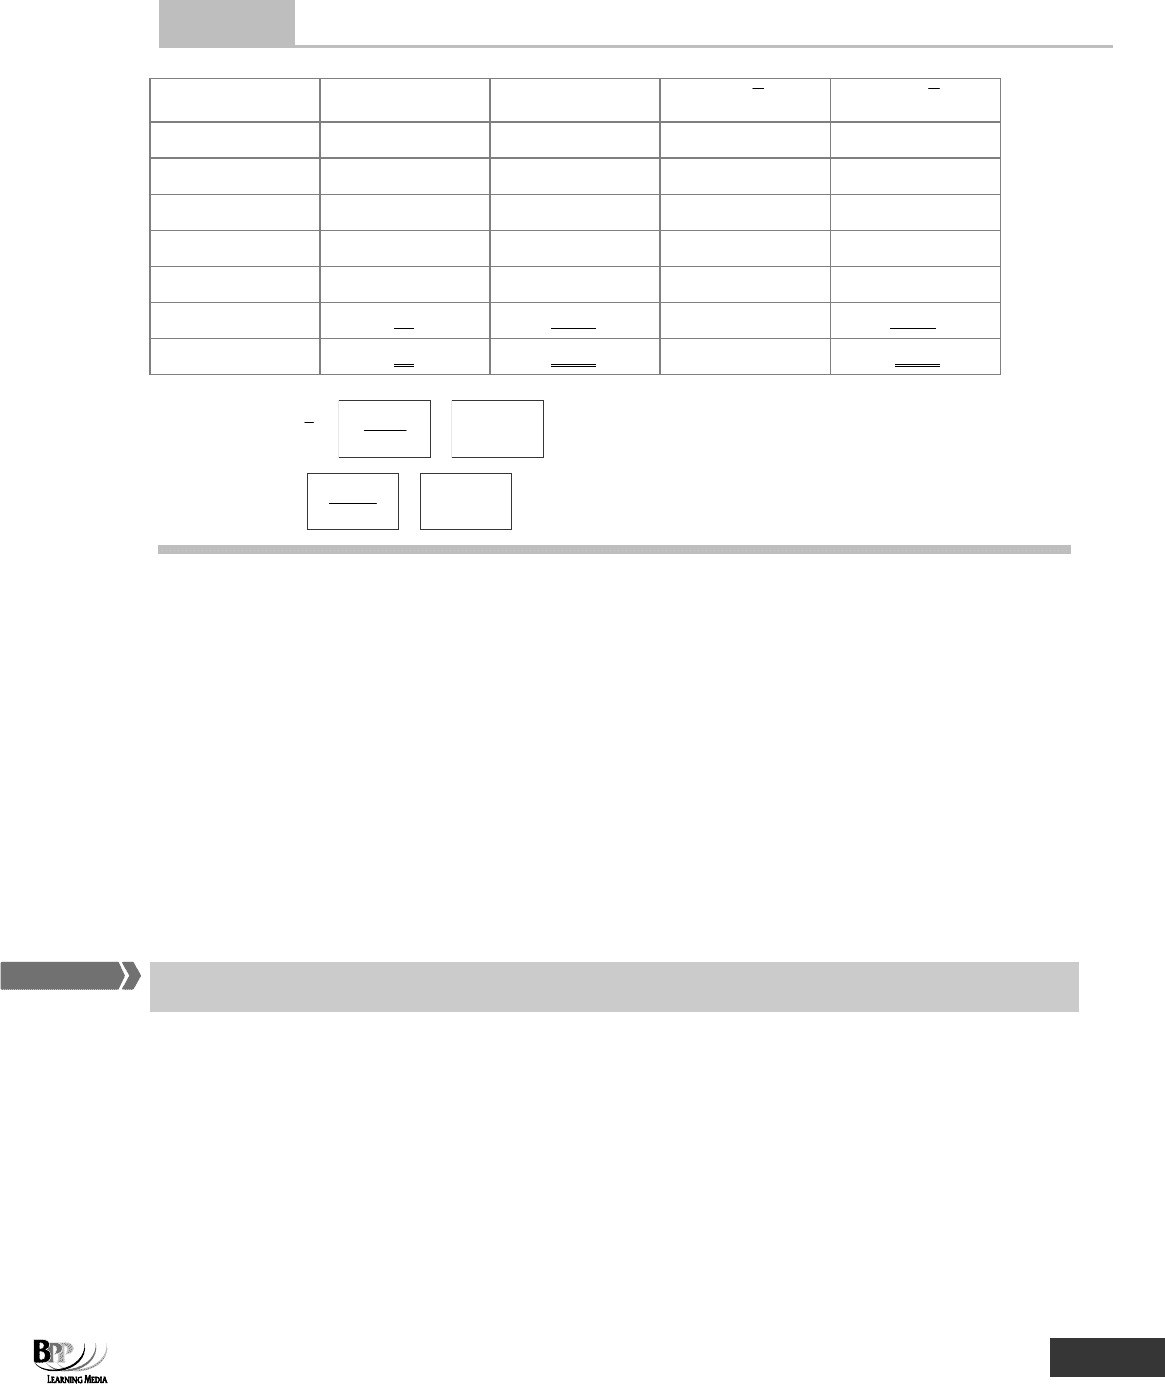
3.3 Example: The mean deviation
The hours of overtime worked in a particular quarter by the 60 employees of ABC Co are as follows.
Hours
Frequency
More than
Not more than
0
10
3
10
20
6
20
30
11
30
40
15
40
50
12
50
60
7
60
70
6
60
Required
Calculate the mean deviation of the frequency distribution shown above.
FA
S
T F
O
RWAR
D
136 4b: Dispersion ⏐ Part B Summarising and analysing data
Solution
Midpoint
x f fx
II xx − II xxf −
5
3
15
32
96
15
6
90
22
132
25
11
275
12
132
35
15
525
2
30
45
12
540
8
96
55
7
385
18
126
65
6
390
28
168
∑f =
60
∑fx =
2,220
780
Arithmetic mean x =
f
fx
∑
∑
=
60
220,2
= 37
Mean deviation =
60
780
= 13 hours
Question
Mean deviation
Complete the following table and then calculate the arithmetic mean and the mean deviation of the following
frequency distribution (to one decimal place).
Frequency of
Value
occurrence
5
4
15
6
25
8
35
20
45
6
55
6
50
x f fx
II xx − II xxf −
5
15
25
35
45
55
Arithmetic mean
x
=
=
Mean deviation =
=
Part B Summarising and analysing data ⏐ 4b: Dispersion 137
Answer
x
f
fx
II xx − II xxf −
5
4
20
27.2
108.8
15
6
90
17.2
103.2
25
8
200
7.2
57.6
35
20
700
2.8
56.0
45
6
270
12.8
76.8
55
6
330
22.8
136.8
50
1,610
539.2
Arithmetic mean
x
=
50
610,1
=
32.2
Mean deviation =
50
2.539
=
10.8
3.4 Summary of the mean deviation
(a) It is a measure of dispersion which shows by how much, on average, each item in the distribution
differs in value from the arithmetic mean of the distribution.
(b) Unlike quartiles, it uses all values in the distribution to measure the dispersion, but it is not greatly
affected by a few extreme values because an average is taken.
(c) It is not, however, suitable for further statistical analysis.
4 The variance and the standard deviation
4.1 The variance
The variance, σ
2
, is the average of the squared mean deviation for each value in a distribution.
σ is the Greek letter sigma (in lower case). The variance is therefore called 'sigma squared'.
FA
S
T F
O
RWAR
D
138 4b: Dispersion ⏐ Part B Summarising and analysing data
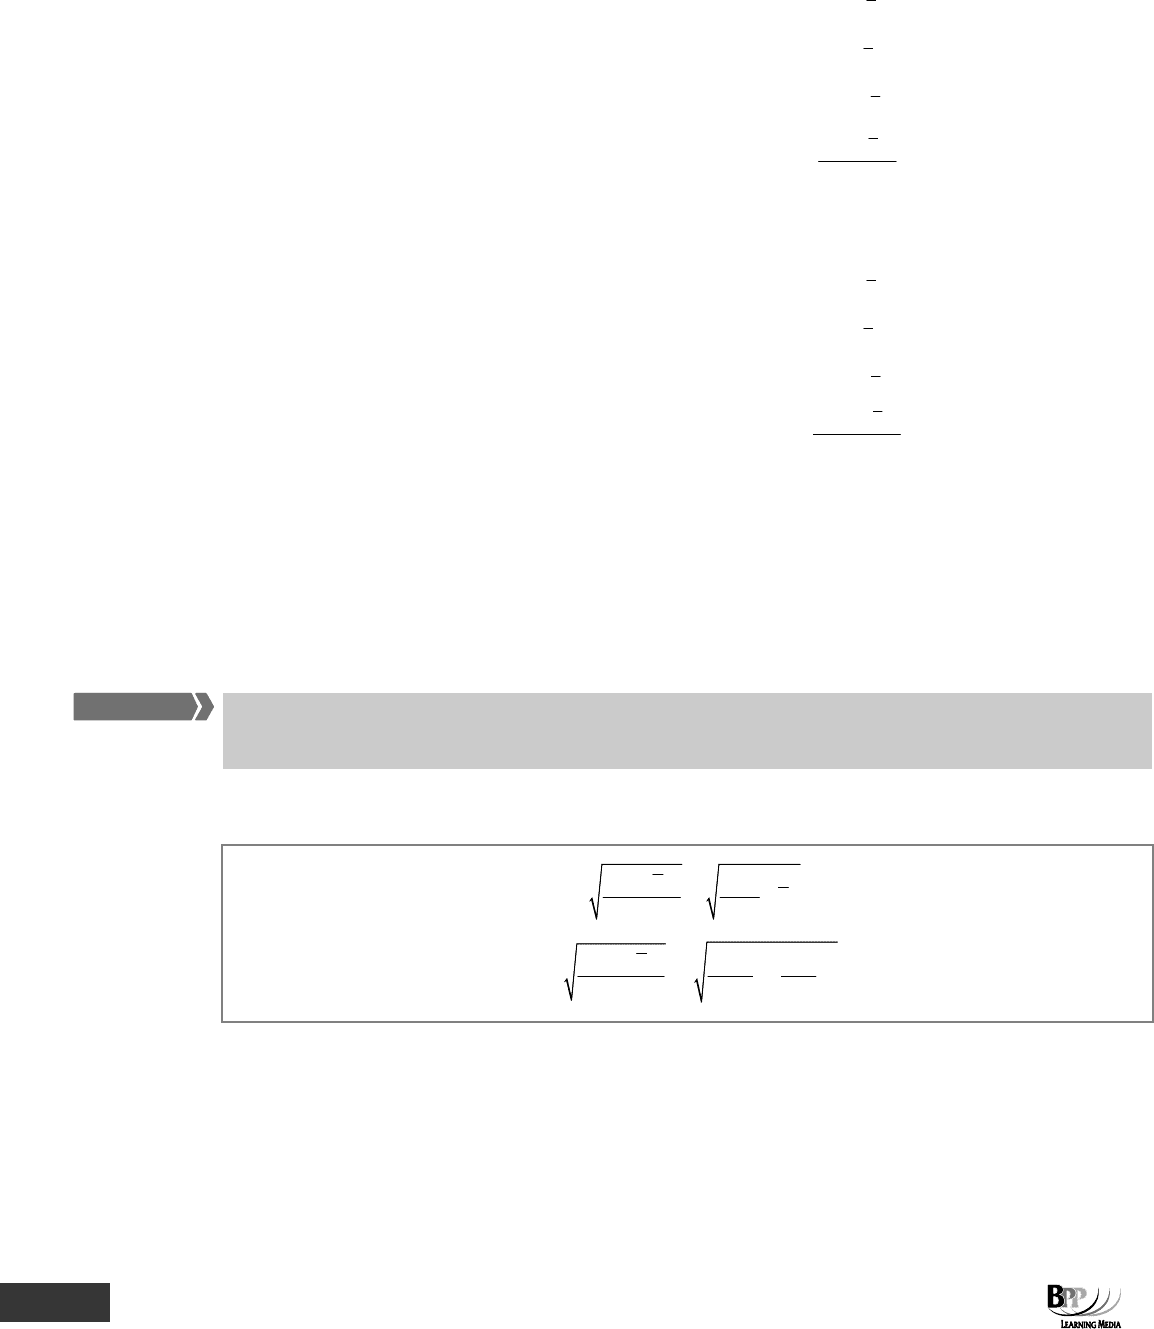
4.2 Calculation of the variance for ungrouped data
Step 1
Difference between value and mean x –
x
Step 2 Square of the difference (x –
x
)
2
Step 3 Sum of the squares of the difference ∑(x – x)
2
Step 4 Average of the sum (= variance = σ
2
)
n
)xx(
2
−∑
4.3 Calculation of the variance for grouped data
Step 1
Difference between value and mean (x – x)
Step 2 Square of the difference (x – x)
2
Step 3 Sum of the squares of the difference ∑f(x –
x
)
2
Step 4 Average of the sum (= variance = σ
2
)
(
)
f
xxf
2
∑
−∑
4.4 The standard deviation
The units of the variance are the square of those in the original data because we squared the differences. We
therefore need to take the square root to get back to the units of the original data.
The standard deviation = square
root of the variance.
The standard deviation measures the spread of data around the mean. In general, the larger the standard deviation
value in relation to the mean, the more dispersed the data.
The standard deviation, which is the square root of the variance, is the most important measure of spread used in
statistics. Make sure you understand how to calculate the standard deviation of a set of data.
There are a number of formulae which you may use to calculate the standard deviation; use whichever one you feel
comfortable with. The standard deviation formulae provided in your assessment are shown as follows.
Standard deviation (for ungrouped data) =
2
(x x)
n
∑−
=
2
2
x
x
n
∑
−
Standard deviation (for grouped data) =
2
f(x x)
f
∑−
∑
=
2
2
fx fx
ff
∑∑
⎛⎞
−
⎜⎟
∑∑
⎝⎠
The key to these calculations is to set up a table with totals as shown below and then use the totals in the formulae
given to you.
4.5 Example: The variance and the standard deviation
Calculate the variance and the standard deviation of the frequency distribution in Paragraph 3.3
Assessment
formula
FA
S
T F
O
RWAR
D
Part B Summarising and analysing data ⏐ 4b: Dispersion 139
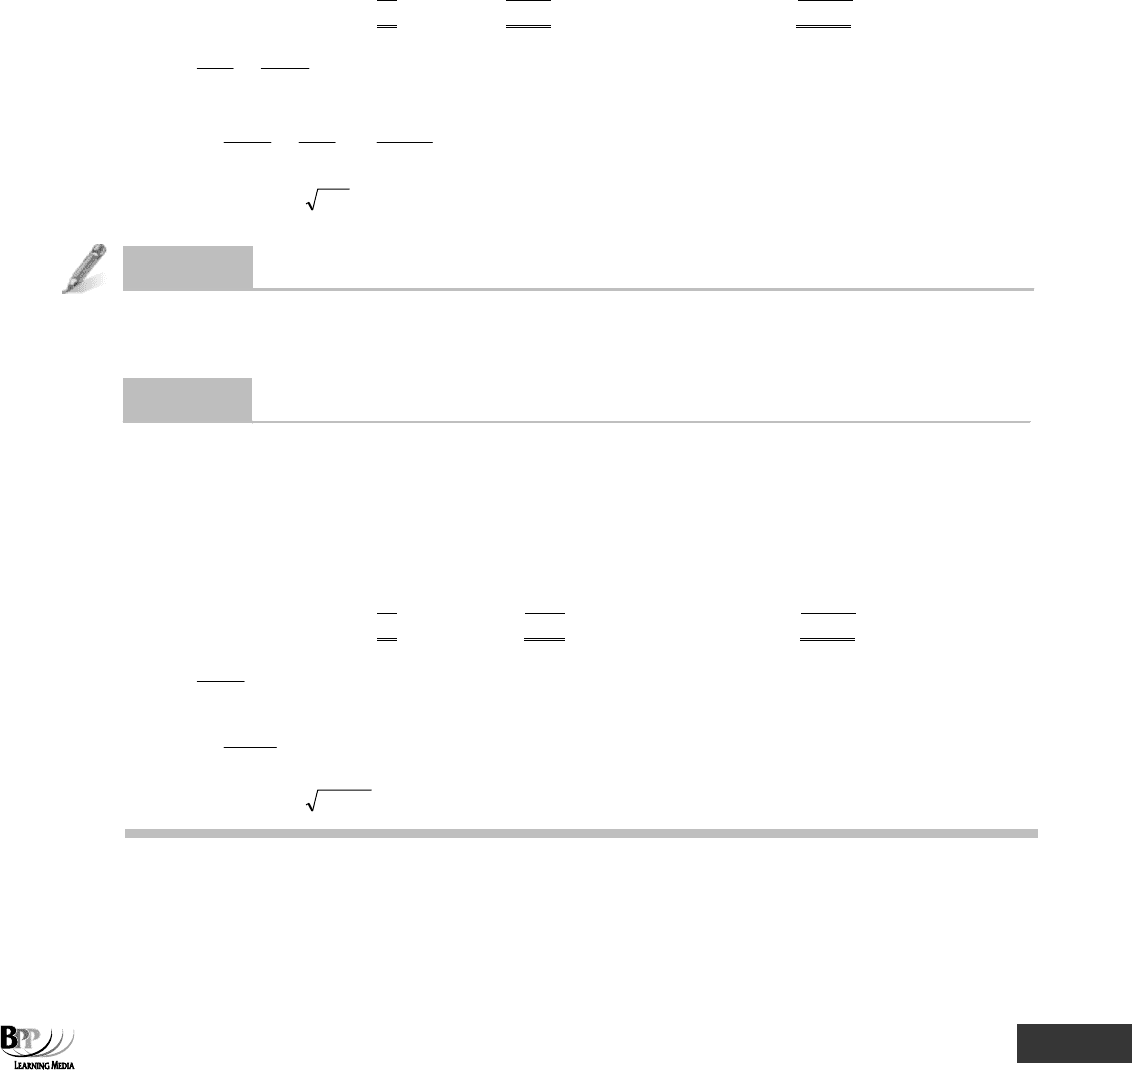
Solution
Using the formula provided in the assessment, the calculation is as follows.
Midpoint
x
f
fx
x²
fx²
5
3
15
25
75
15
6
90
225
1,350
25
11
275
625
6,875
35
15
525
1,225
18,375
45
12
540
2,025
24,300
55
7
385
3,025
21,175
65
6
390
4,225
25,350
Σf =
60
Σfx =
2,220
Σfx
2
=
97,500
Mean =
f
fx
∑
∑
=
2,220
60
= 37
Variance =
2
2
2
)37(
60
500,97
f
fx
f
fx
−=
⎟
⎠
⎞
⎜
⎝
⎛
∑
∑
−
∑
∑
= 256 hours
Standard deviation = 256 = 16 hours
Question
Variance and standard deviation
Calculate the variance and the standard deviation of the frequency distribution in the question entitled: mean
deviation.
Answe
r
x
f
fx
x
2
fx
2
5
4
20
25
100
15
6
90
225
1,350
25
8
200
625
5,000
35
20
700
1,225
24,500
45
6
270
2,025
12,150
55
6
330
3,025
18,150
Σf =
50
Σfx =
1610
Σfx
2
=
61,250
Mean =
1,610
50
= 32.2
Variance =
50
250,61
– (32.2)
2
= 188.16
Standard deviation =
16.188
= 13.72