CIMA - C3 Fundamentals Of Business Mathematics
Подождите немного. Документ загружается.

80 2: Data and information ⏐ Part B Summarising and analysing data
Question
Sampling methods
Sampling methods are frequently used for the collection of data. Five commonly used types of samples are (A)
simple random, (B) stratified random, (C) systematic, (D) cluster and (E) quota. State which of these sample types
is being described in the following situations.
(a) One school in an area is selected at random and then all pupils in that school are surveyed.
Type of sample is
(b) The local authority has a list of all pupils in the area and the sample is selected in such a way that all pupils
have an equal probability of selection.
Type of sample is
(c) An interviewer surveys pupils emerging from every school in the area, attempting to question them
randomly but in line with specified numbers of boys and girls in the various age groups.
Type of sample is
(d) The local authority has a list of all pupils in the selected area, categorised according to their gender and age.
The sample selected is chosen randomly from the various categories, in proportion to their sizes.
Type of sample is
(e) The local authority has a list of all pupils in the selected area. The first pupil is selected randomly from the
list and then every 100th pupil thereafter is selected for the survey.
Type of sample is
Answe
r
(a)
D
(b)
A
(c)
E
(d)
B
(e)
C
Question
Systematic sampling
Which of the following are disadvantages of systematic sampling? Tick as appropriate.
F The sample chosen might be biased
F Some samples have a zero chance of being selected so sampling method is not completely random
F Prior knowledge of each item in the population is required

Part B Summarising and analysing data ⏐ 2: Data and information 81
Answe
r
9
The sample chosen might be biased
9
Some samples have a zero chance of being selected so sampling method is not completely random
F Prior knowledge of each item in the population is required
Chapter Roundup
• Data are the raw materials for data processing. Information is data that has been processed.
• Quantitative data are data that can be measured. A 'variable' is something which can be measured.
• Qualitative data cannot be measured, but have attributes (an attribute is something an object either has or does
not have).
• The main characteristics of good information are as follows.
– It should be relevant for its purpose.
– It should be complete for its purpose.
– It should be sufficiently accurate for its purpose.
– It should be clear to the user.
– The user should have confidence in it.
– It should be communicated to the right person.
– It should not be excessive – its volume should be manageable.
– It should be timely – in other words communicated at the most appropriate time.
– It should be communicated by an appropriate channel of communication.
– It should be provided at a cost which is less than the value of its benefits.
• Data may be primary (collected specifically for the purpose of a survey) or secondary (collected for some other
purpose).
• Discrete data/variables can only take on a countable number of values. Continuous data/ variables can take on any
value
• Data are often collected from a sample rather than from a population. If the whole population is examined, the
survey is called a census.
82 2: Data and information ⏐ Part B Summarising and analysing data
Quick Quiz
1 Fill in the blanks in the statements below using the words in the box.
Data can be either (1) …………………. (have variables) or (2) …………………. (have (3) ………………….).
Variables can be either (4) …………………. (eg 0, 1, 2, 3) or (5) …………………. (eg 0.54, 0.612, 0.117). Data
may also be classified as (6) …………………. (collected for a specific survey) or (7) …………………. (collected
for some other purpose).
• Quantitative • Continuous • Attributes • Primary
• Secondary • Qualitative • Discrete
2 Which of the following statements is/are correct?
Data and information are the same thing
Information is derived from data
Quantitative data are data that can be measured
Data is derived from information
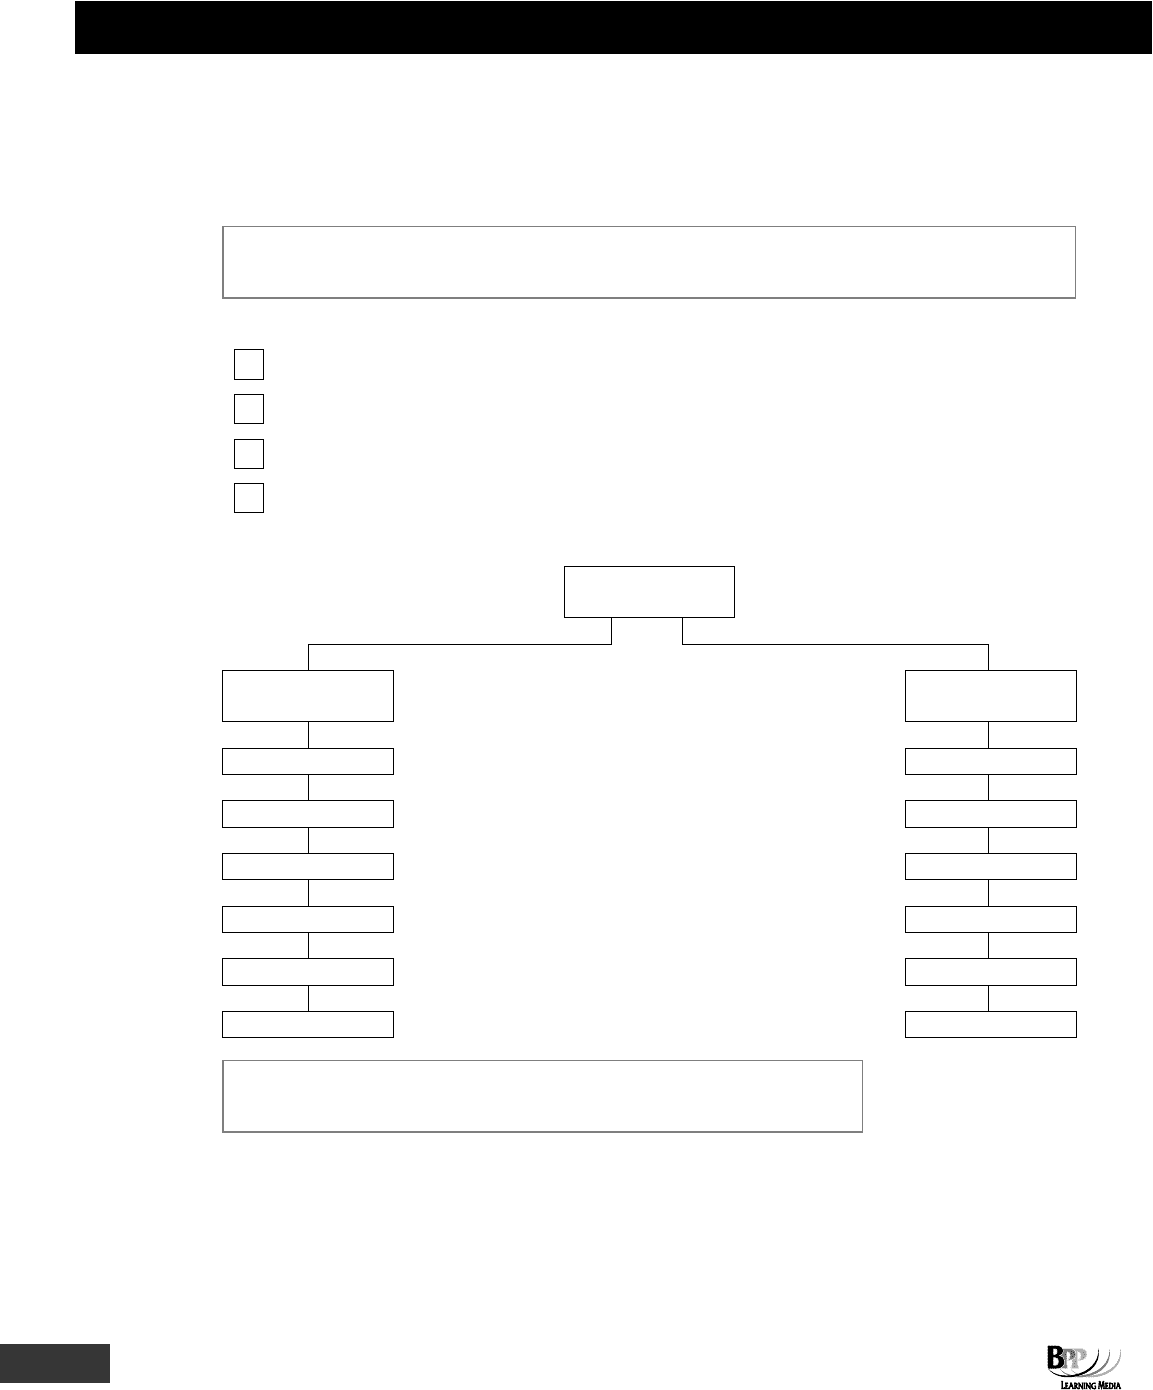
3 Fill in the blanks in the boxes below using the words in the box.
SAMPLING
METHODS
PROBABILITY NON-
PROBABILITY
…………………. ………………….
…………………. ………………….
…………………. ………………….
…………………. ………………….
…………………. ………………….
…………………. ………………….
• Multistage • Random • Cluster
• Stratified • Quota • Systematic
4 A simple random sample is a sample selected in such a way that every item in the population has an equal chance
of being included.
True
F
False
F

Part B Summarising and analysing data ⏐ 2: Data and information 83
5 I If a sample is selected using random sampling, it will be free from bias
II A sampling frame is a numbered list of all items in a sample
III Cluster sampling is a non-probability sampling method
IV In quota sampling, investigators are told to interview all the people they meet up to a certain quota
Which of the above statements are true?
A I, II, III and IV
B I, II and IV only
C I and II only
D I and IV only
6 The essence of systematic sampling is that
A Each element of the population has an equal chance of being chosen
B Members of various strata are selected by the interviewers up to predetermined limits
C Every nth item of the population is selected
D Every element of one definable sub-section of the population is selected
Answers to Quick Quiz
1 (1) Quantitative (2) Qualitative (3) Attributes
(4) Discrete (5) Continuous (6) Primary
(7) Secondary
2
Data and information are the same thing
9
Information is derived from data
9
Quantitative data are data that can be measured
Data is derived from information
84 2: Data and information ⏐ Part B Summarising and analysing data
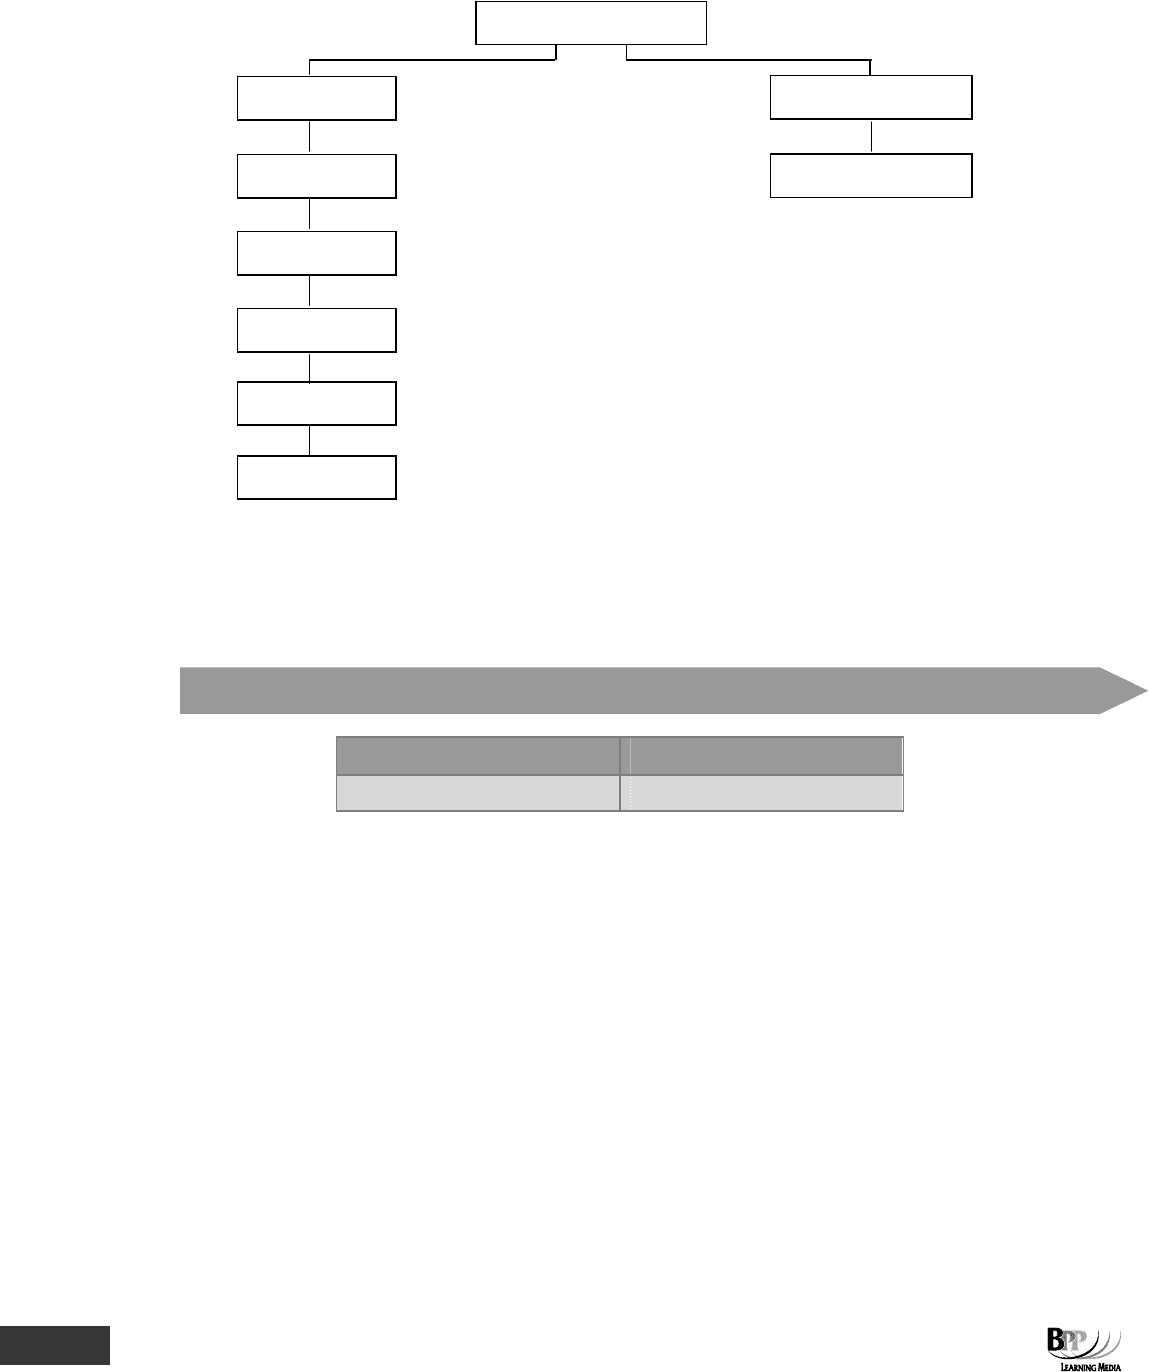
3
4 True
5 D
6 C
Now try the questions below from the Exam Question Bank
Question numbers Pages
27-30 329-330
SAMPLING METHODS
PROBABILITY
random
stratified
systematic
multistage
cluster
NON-PROBABILITY
quota
85
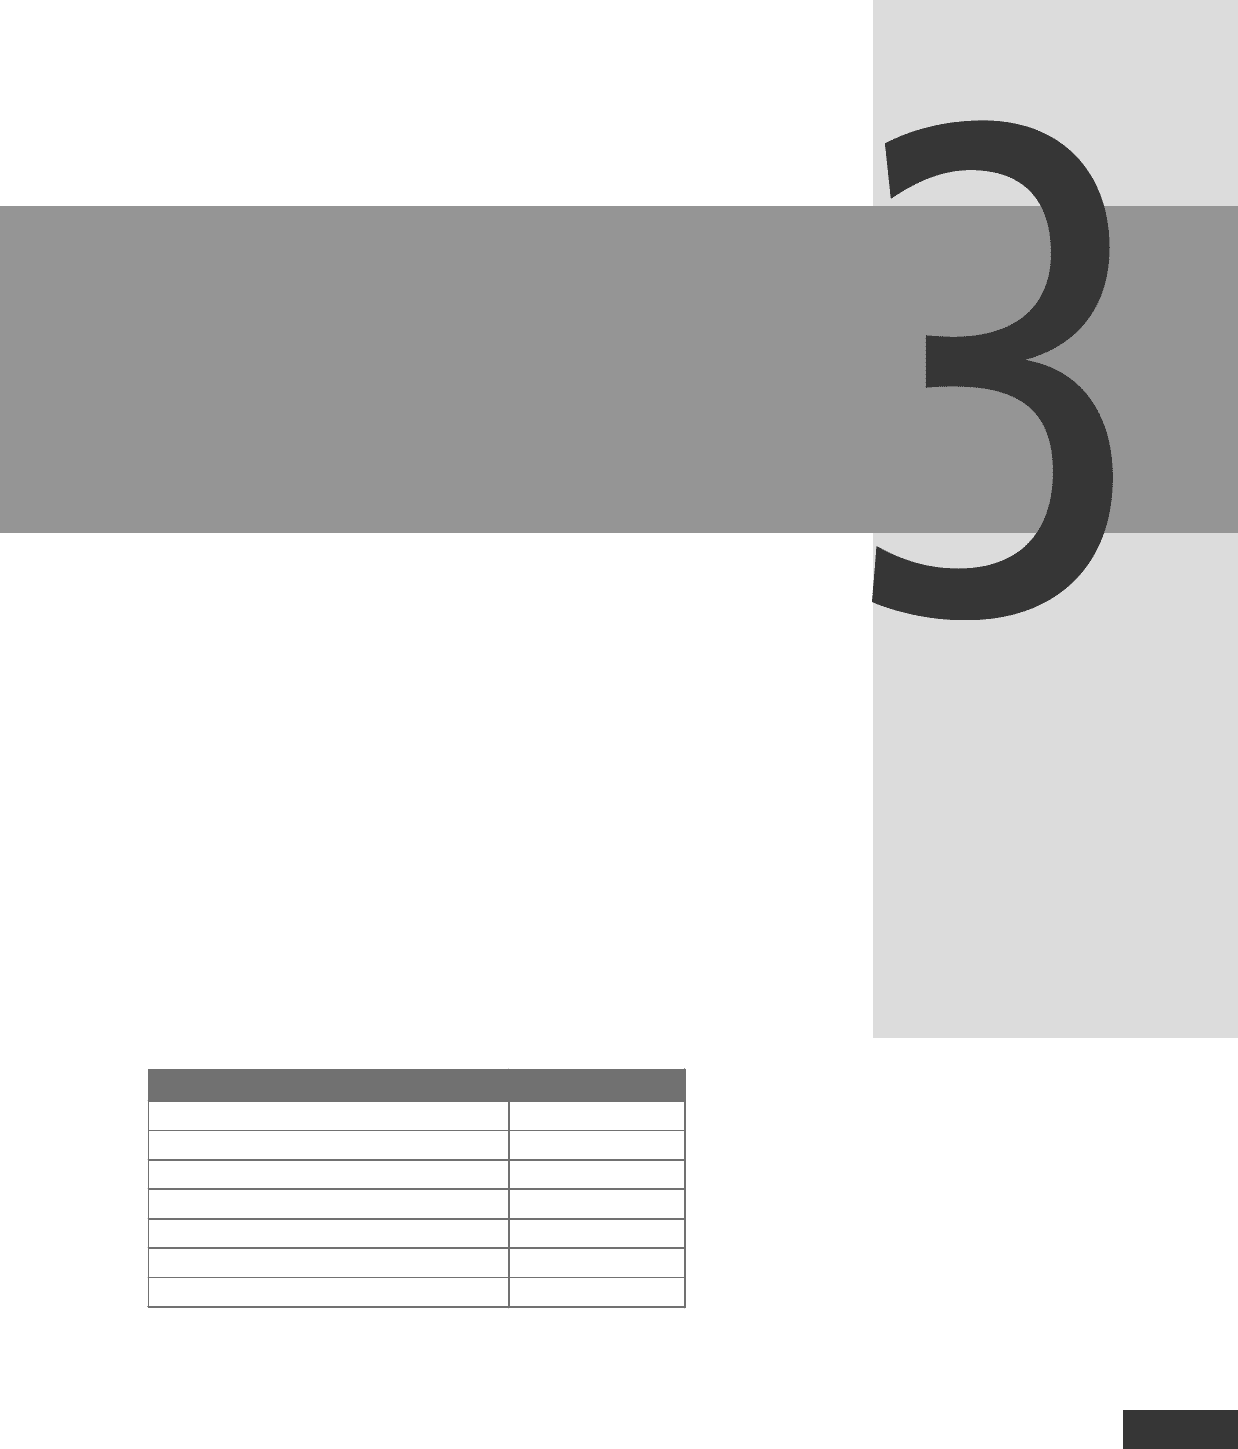
Topic list Syllabus references
1 Tables C, (iii), (2)
2 Charts C, (iii), (3)
3 Frequency distributions C, (v), (5)
4 Histograms C, (iii), (3)
5 Ogives C, (3)
6 Scatter diagrams C, (3)
7 Using spreadsheets G, (i), (1)
Data presentation
Introduction
We now have to present the data we have collected so that they can be of use. This chapter
begins by looking at how data can be presented in tables and charts. Such methods are
helpful in presenting key data in a concise and easy to understand way.
Data that are a mass of numbers can usefully be summarised into a frequency distribution.
Histograms and ogives are the pictorial representation of grouped and cumulative
frequency distributions.
86 3: Data presentation ⏐ Part B Summarising and analysing data
1 Tables
1.1 Tables and tabulation
Tables are a simple way of presenting information about two variables.
Raw data (for example a list of results from a survey) need to be summarised and analysed, to give them
meaning. One of the most basic ways is the preparation of a table.
• Tabulation means putting data into tables.
• A table is a matrix of data in rows and columns, with the rows and the columns having titles.
Since a table is two-dimensional, it can only show two variables. To tabulate data, you need to recognise what the
two dimensions should represent, prepare rows and columns accordingly with suitable titles, and then insert the
data into the appropriate places in the table.
1.2 Example: Tables
The total number of employees in a certain trading company is 1,000. They are employed in three departments:
production, administration and sales. 600 people are employed in the production department and 300 in
administration. There are 110 males under 21 in employment, 110 females under 21, and 290 females aged 21
years and over. The remaining employees are males aged 21 and over.
In the production department there are 350 males aged 21 and over, 150 females aged 21 and over and 50 males
under 21, whilst in the administration department there are 100 males aged 21 and over, 110 females aged 21 and
over and 50 males aged under 21.
Draw up a table to show all the details of employment in the company and its departments and provide suitable
secondary statistics to describe the distribution of people in departments.
Solution
The basic table required has the following two dimensions.
• Departments
• Age/sex analysis
In this example we are going to show the percentage of the total workforce in each department.
Analysis of employees
Department
Production
Administration
Sales
Total
No
%
No
%
No
%
No
%
Males 21 yrs +
350
58.4
100
33.3
40 ** 40.0
490 *
49.0
Females 21 yrs +
150
25.0
110
36.7
30
** 30.0
290
29.0
Subtotals 21 yrs +
500
83.4
210
70.0
70
70.0
780
78.0
Males under 21
50
8.3
50
16.7
10 ** 10.0
110
11.0
Females under 21
50
*
8.3
40
*
13.3
20
**
20.0
110
11.0
Subtotals under 21
100
16.6
90
30.0
30
30.0
220
22.0
Total
600
100.0
300
100.0
100
100.0
1,000
100.0
* Balancing figure to make up the column total
** Balancing figure then needed to make up the row total
Key term
FA
S
T F
O
RWAR
D
Part B Summarising and analysing data ⏐ 3: Data presentation 87
1.3 Guidelines for tabulation
The example above illustrates certain guidelines which you should apply when presenting data in tabular form.
These are as follows.
• The table should be given a clear title
• All columns should be clearly labelled
• Where appropriate, there should be clear sub-totals
• A total column may be presented; this would usually be the right-hand column
• A total figure is often advisable at the bottom of each column of figures
• Tables should not be packed with so much data that reading information is difficult
• Non-essential information should be eliminated
• Consider ordering columns/rows by order of importance/magnitude
2 Charts
2.1 Visual display
Charts often convey the meaning or significance of data more clearly than would a table.
Instead of presenting data in a table, it might be preferable to give a visual display in the form of a chart. The
purpose of a chart is to convey the data in a way that will demonstrate its meaning more clearly than a table of data
would. Charts are not always more appropriate than tables, and the most suitable way of presenting data will
depend on the following.
(a) What the data are intended to show. Visual displays usually make one or two points quite
forcefully, whereas tables usually give more detailed information.
(b) Who is going to use the data. Some individuals might understand visual displays more readily than
tabulated data.
2.2 Bar charts
The bar chart is one of the most common methods of presenting data in a visual form. It is a chart in which
quantities are shown in the form of bars.
There are three main types of bar chart: simple, component (including percentage component) and multiple (or
compound).
A simple bar chart is a chart consisting of one or more bars, in which the length of each bar indicates the
magnitude of the corresponding data item.
Key term
Key term
FA
S
T F
O
RWAR
D
FA
S
T F
O
RWAR
D
88 3: Data presentation ⏐ Part B Summarising and analysing data
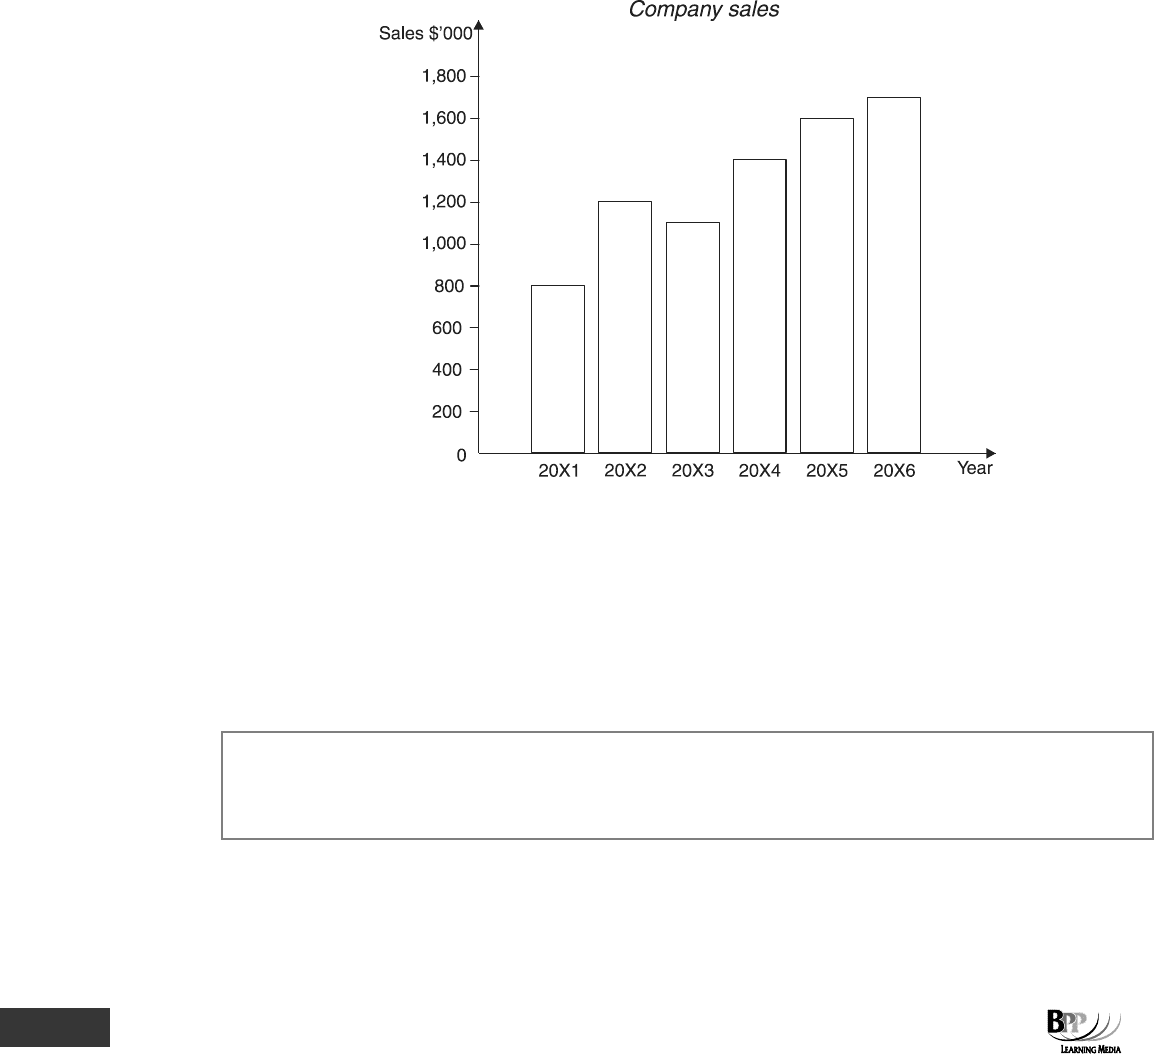
2.2.1 Example: A simple bar chart
A company's total sales for the years from 20X1 to 20X6 are as follows.
Year Sales
$'000
20X1 800
20X2 1,200
20X3 1,100
20X4 1,400
20X5 1,600
20X6 1,700
The data could be shown on a simple bar chart as follows:
Each axis of the chart must be clearly labelled, and there must be a scale to indicate the magnitude of the data.
Here, the y axis includes a scale for the amount of sales, and so readers of the bar chart can see not only that sales
have been rising year by year (with 20X3 being an exception), but also what the actual sales have been each year.
2.2.2 Purposes of simple bar charts
Simple bar charts serve two purposes.
• The actual magnitude of each item is shown
• The lengths of bars on the chart allow magnitudes to be compared
A component bar chart is a bar chart that gives a breakdown of each total into its components. The total length of
each bar and each component on a component bar chart indicates magnitude (a bigger amount is shown by a
longer bar).
Key term
Part B Summarising and analysing data ⏐ 3: Data presentation 89
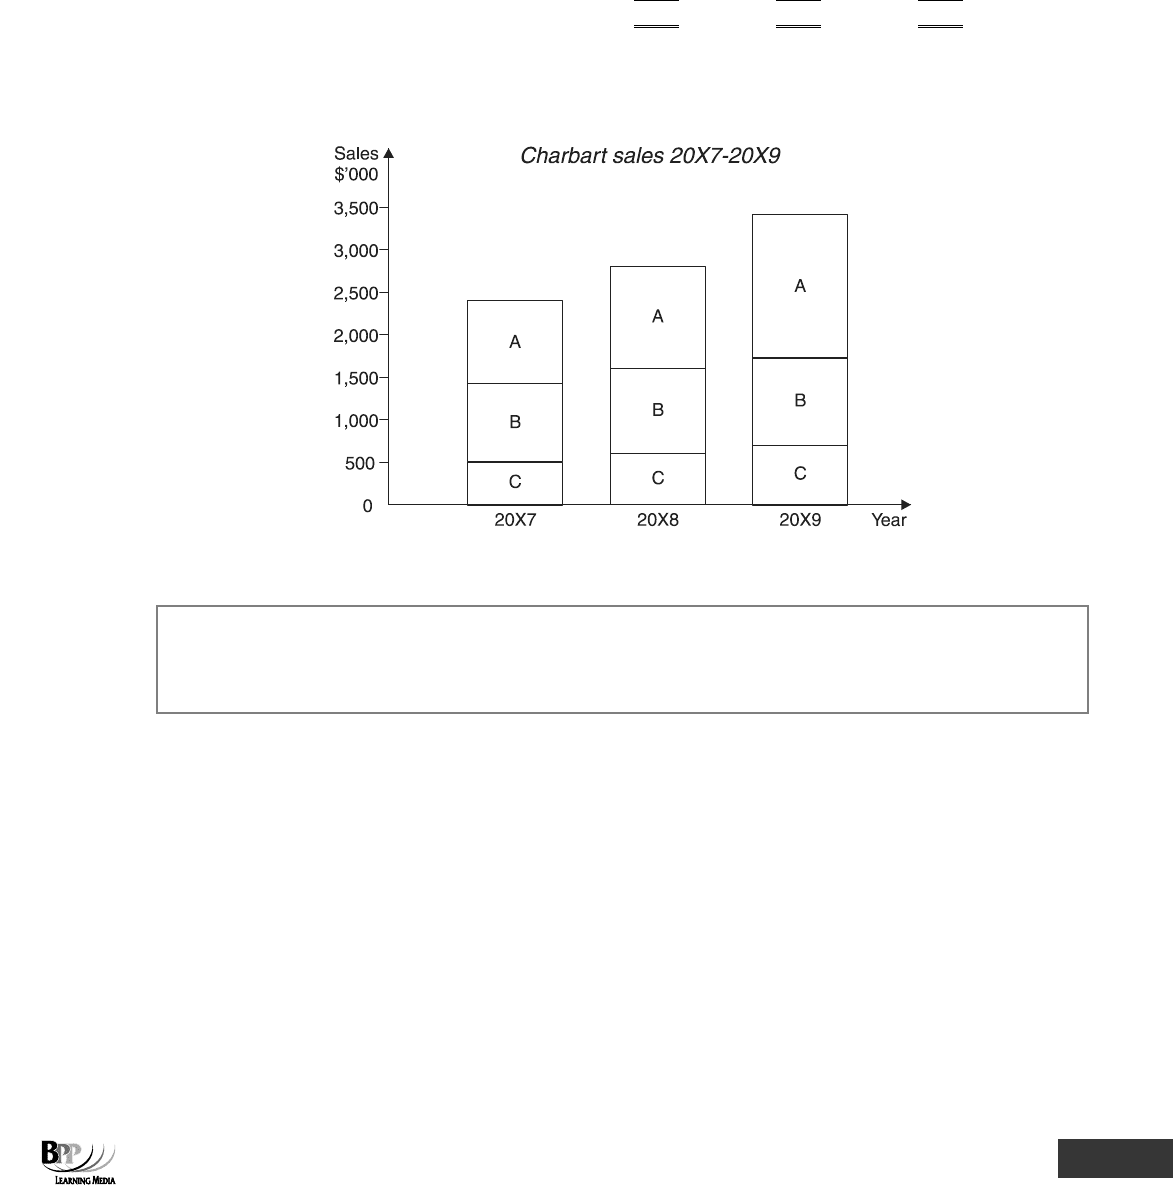
2.2.3 Example: A component bar chart
Charbart's sales for the years from 20X7 to 20X9 are as follows.
20X7
20X8
20X9
$'000
$'000
$'000
Product A
1,000
1,200
1,700
Product B
900
1,000
1,000
Product C
500
600
700
Total
2,400
2,800
3,400
A component bar chart would show the following.
• How total sales have changed from year to year
• The components of each year's total
In this diagram the growth in sales is illustrated and the significance of growth in product A sales as the reason for
the total sales growth is also fairly clear.
A percentage component bar chart is a component bar chart which does not show total magnitudes – if one or
more bars are drawn on the chart, the total length of each bar is the same. The lengths of the sections of the bar
however, do vary, and it is these lengths that indicate the relative sizes of the components.
Key term