Chung Y.-W. Practical guide to surface science and spectroscopy
Подождите немного. Документ загружается.


97
PROBLEMS
the r.m.s. displacement of surface atoms can be 50% larger than that
of bulk atoms. This observation is intuitively reasonable, since surface
atoms do not have neighbors above them and thus have more room to
move perpendicular to the surface.
PROBLEMS
1. Consider the one-dimensional treatment of LEED using the geom-
etry shown in Fig. 5.1.
(a) Show that the change in angular position of a given diffracted
beam ⌬ is related to the change in lattice spacing ⌬d at a
fixed electron wavelength as follows:
⌬
⫽⫺tan
⌬d
d
.
(b) Given an angular resolution of 0.5⬚ in LEED measurements,
calculate the minimum measurable surface strain for a first-
order diffraction beam at a diffraction angle of 45⬚.
2. Consider a one-dimensional periodic array ABAB . . . of atoms
with periodicity d (i.e., the distance between A and B is d). The
atomic scattering factors are f
A
and f
B
, respectively.
(a) Using the geometry in Fig. 5.1, derive an equation relating
d and the diffraction angle similar to Eq. (5.1).
(b) Show that the structure factor S
G
⫽ f
A
⫹ f
B
exp(i⌬k⭈d).
(c) Show that for diffraction beams of order n, the diffraction
intensity is proportional to 兩 f
A
⫹ f
B
兩
2
if n is even and is
proportional to 兩 f
A
⫺ f
B
兩
2
if n is odd.
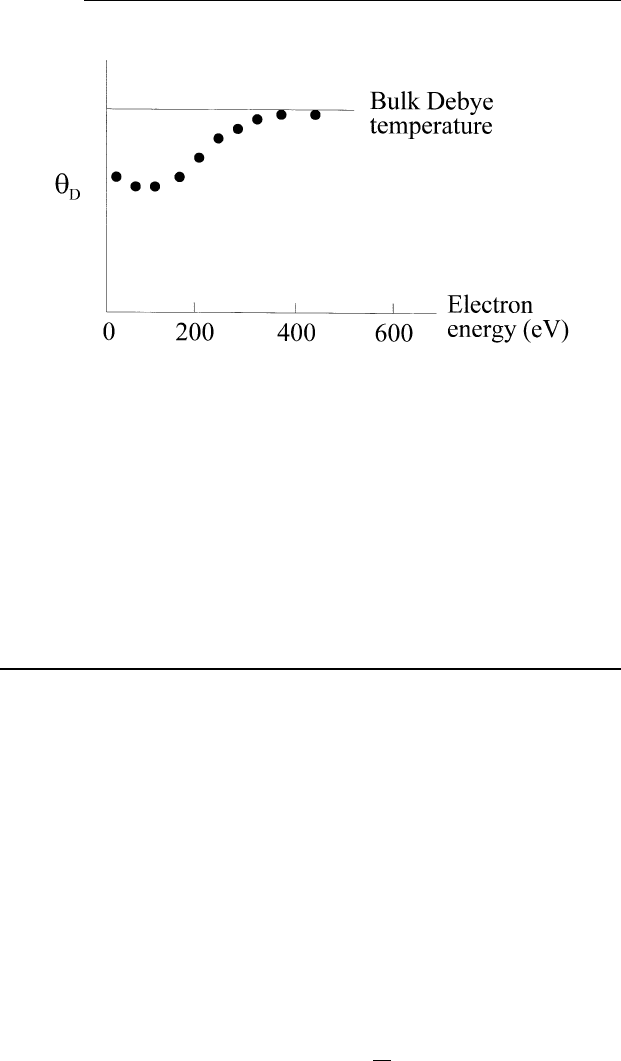
3. One can measure the surface Debye temperature using LEED.
This is done by measuring the diffraction intensity of a given
Bragg spot as a function of temperature. A typical result is shown
in Fig. 5.9, using Bragg spots at different electron energies. Ex-
plain the variation.
4. Consider the one-dimensional interference function J due to scat-
tering by M atoms, rewritten from Eq. (5.19) as
J ⫽
sin
2
Mx
sin
2
x
,
where x ⫽
1
–
2
⌬k⭈ a. J is a maximum when x is equal to an integral
multiple of , corresponding to diffraction spots. However, if one
98
CHAPTER5/LOW-ENERGY ELECTRON DIFFRACTION
FIGURE 5.9 Surface Debye temperature versus electron energy.
examines the function carefully, one also obtains maxima of J
when x is equal to some intermediate value between multiples
of (what are they?). Therefore, we should see spots between
major diffraction spots. Evaluate J for M ⫽ 20. Plot J as a function
of x from x ⫽ 0tox ⫽ . Using this result, explain why such
intermediate spots are not observed in practice.
APPENDIX
DIFFRACTION INTENSITY AS A FUNCTION OF
TEMPERATURE
From Eq. (5.14), the total scattered wave amplitude
tot
goes as
兺
c
f
c
exp(i⌬k⭈ R
c
) 兺
l
exp(i⌬k⭈ R
l
).
Because of the thermal motion of atoms, R
c
⫽ R
c,o
⫹ u, so that
tot
⫽
tot,o
exp(i⌬k⭈ u) .
To compute the thermal average of
tot
, we need only calculate the
thermal average of exp(i⌬k⭈u). Let us expand the exponential as follows:
具exp(i⌬k⭈ u典 ⫽
冓
1 ⫺ i(⌬k⭈ u) ⫺
1
2!
(⌬k⭈ u)
2
⫹ ...
冔
.

99
DIFFRACTION INTENSITY AS A FUNCTION OF TEMPERATURE
Since u is as likely to be in one direction as another, the average of
terms containing odd powers of u must be equal to zero. Therefore,
the preceding equation is reduced to
冓
1 ⫺
(⌬k⭈ u)
2
2!
⫹
(⌬k⭈ u)
4
4!
⫺ ...
冔
⫽
冓
兺
∞
n⫽0
(⫺1)
n
(⌬k⭈ u)
2n
(2n)!
冔
.
Now, the thermal average of u
2n
is given by
具u
2n
典 ⫽
冕
∞
⫺
∞
u
2n
exp
冉
⫺
mu
2
2k
B
T
冊
du
冕
∞
⫺
∞
exp
冉
⫺
mu
2
2k
B
T
冊
du
⫽ (2n ⫺ 1)!!具u
2
典
n
,
where (2n⫺1)!! ⫽ 1⭈3⭈5⭈ ...(2n⫺3)⭈(2n⫺1). Therefore,
具exp(i⌬k⭈ u)典 ⫽
兺
∞
n⫽0
(⫺1)
n
具(⌬k⭈ u)
2
典
n
(2n ⫺ 1)!!
(2n)!
⫽
兺
∞
n⫽0
(⫺1)
n
n!
冋
具(⌬k⭈ u)典
2
2
册
n
⫽ exp
冋
⫺
1
2
具(⌬k⭈ u)典
2
册
,
noting that (2n)! ⫽ 2
n
n!(2n ⫺ 1)!!. Squaring the wave amplitude
gives
I ⫽ I
o
exp[⫺ 具(⌬k⭈ u)典
2
] ⫽ I
o
exp(⫺ 2W),
where 2W ⫽ (⌬k)
2
⬍u
2
⬎ cos
2
␣ ⫽ (⌬k)
2
⬍u
2
⬎ /3,␣ being the angle
between ⌬k and u. From statistical mechanics of a simple 3D lattice
at high temperature,
1
2
k
B
T ⫽
1
8
Nm
2
qn
具a
2
qn
典 ,
where N is the number of unit cells in the crystal, m the atomic mass,
and
qn
the phonon angular frequency with mode n and wavevector

100
CHAPTER5/LOW-ENERGY ELECTRON DIFFRACTION
q. The total contribution to ⬍u
2
⬎ due to all phonon modes is obtained
by summation:
具u
2
典 ⫽
兺
q,n
具a
2
q,n
cos
2
qxcos
2
q,n
t典 ⫽
1
4
兺
q,n
具a
2
q,n
典
⫽
3
4
兺
q
具a
2
q
典 ⫽
3
4
兺
q
4k
B
T
Nm
2
q
,
noting that there are three normal modes for a simple 3D lattice. We
can convert the summation into an integral by using
兺
q
⫽
V
(2
)
3
冕
q
max
0
4
q
2
dq ,
where V is the crystal volume and q
max
⫽ (6
2
N/V)
1/3
, the maximum
wavevector. Using the Debye approximation (
q
⫽ cq), c being the
speed of sound in the crystal, we can reduce the summation to
3
4
4k
B
T
Nm
1
c
2
V
(2
)
3
冕
q
max
0
4
q
2
dq
1
q
2
⫽
9ប
2
T
mk
B
D
2
,
noting that
D
⫽ ប
max
/k
B
and
max
⫽ cq
max
. Therefore, we have
2W ⫽
3(⌬k)
2
ប
2
T
mk
B
2
D
.

6
SCANNING PROBE
MICROSCOPY
6.1 INTRODUCTION
Scanning probe microscopy refers to a class of surface diagnostic
techniques that operate by scanning a fine probe on a specimen surface.
The first such technique is known as scanning tunneling microscopy.
The scanning tunneling microscope (STM) was invented by Heinrich
Rohrer and Gerd Binnig of IBM’s Zurich Research Laboratory in
Switzerland in 1982. One interesting aspect of this microscopy tech-
nique is its ability to perform high-resolution imaging of surfaces over
a relatively large range in both the horizontal and vertical directions.
What is more significant is that such high resolution is achieved in
vacuum, air, and liquid environments, thus making this technique conve-
nient to use for practical specimens.
To bring the subject into perspective, we begin by looking at the
history behind the scanning tunneling microscope. Then we examine
briefly the physical basis of the STM. Techniques involved in the design
and operation of the microscope are detailed, followed by several
101

102
CHAPTER6/SCANNING PROBE MICROSCOPY
examples of its applications. Finally, extension of scanning tunneling
microscopy into a whole class of scanning probe techniques is dis-
cussed.
6.2 HISTORICAL PERSPECTIVE
The theory of quantum mechanical tunneling was first developed in
the early 1920s. One of the early triumphs of this new theory is its correct
explanation of the strong dependence of the half-lives of radioactive
nuclides on their kinetic energies. Leo Esaki was the first one exploiting
tunneling in a solid-state device, viz., the tunnel diode, while working
at IBM’s Yorktown Heights Thomas J. Watson Research Center. For
this invention, he received the Nobel Prize in Physics in 1972. At about
this time, Russell Young and coworkers at the National Bureau of
Standards (now the National Institute of Standards and Technology)
described an instrument called the topografiner, which in many ways
is the predecessor of the modern STM. The topografiner operates in
the field emission mode with a resolution of 20 nm horizontal and 0.3
nm vertical. The reason that the resolution was somewhat limited at
this stage is probably due to vibration.
The concept of the STM was first described in a patent disclosure
in mid-1979 by Heinrich Rohrer and his research staff assistant Gerd
Binnig. The next few years were spent in solving problems related to
vibration isolation and coarse and fine motion control in all three axes.
Their first success came in 1981 when images resolving monatomic
steps on the surface of a calcium–iridium–tin crystal were obtained.
But the paper was rejected because one referee found the paper ‘‘not
interesting enough.’’ The publication that caught the attention of the
scientific community came in 1982 when they successfully imaged the
famous Si(111)–(7x7) surface. This surface structure was first observed
in the 1960s, but its complexity precluded a structural solution until
this work in 1982. For their work in STM, Binnig and Rohrer were
awarded the Nobel Prize in Physics in 1986.
Since then, many STMs have been built and developed around the
world. Commercial versions operating both in air and in ultrahigh
vacuum are also now readily available. Variants have been developed,
such as the atomic force microscope and the scanning capacitance
microscope, that expand the functionalities of the basic STM. Applica-
tions cover many disciplines in physics, chemistry, biology, materials
103
6.3 REVIEW OF ELECTRON TUNNELING
science, and engineering. Reports of using the STM for lithography in
the nanometer scale are emerging.
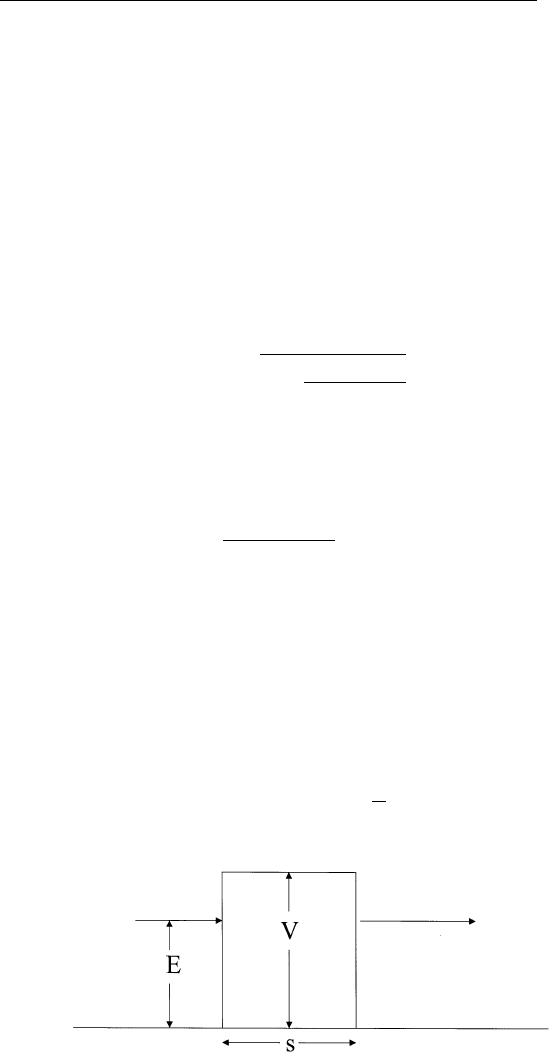
6.3 REVIEW OF ELECTRON TUNNELING
Consider a flux of particles of energy E impinging on a potential barrier
V(x) ⫽ V for x ⫽⫺s/2 to s/2 and V(x) ⫽ 0 elsewhere (Fig. 6.1). Under
these conditions, the transmission probability T for this flux of particles
is given by
T ⫽
1
1 ⫹
(Vsinhks)
2
4E(V ⫺ E)
(6.1)
where k ⫽ [2m(V ⫺ E)/ប
2
]
1/2
, m being the mass of the particle. Under
conditions when ks » 1, the preceding expression can be simplified to
give
T ⫽
16E(V ⫺ E)
V
2
exp(⫺ 2ks). (6.2)
Therefore, the flux of particles through this potential barrier is reduced
by this transmission probability factor. To make connection to the
typical setup in scanning tunneling microscopy, one can consider elec-
tron tunneling between two metal surfaces separated by a distance s.
At low applied bias, one is essentially looking at electron tunneling
from the Fermi level of one metal to another. Therefore, (V ⫺ E )is
equal to some composite of the work function of these two metal
surfaces. We can then write the tunneling current I as
I ⬇ exp(⫺ As
兹
) (6.3)
FIGURE 6.1 Electron tunneling through a potential barrier.

104
CHAPTER6/SCANNING PROBE MICROSCOPY
where A ⫽ 10.25 eV
⫺1/2
nm
⫺1
, is in electron volts and s is in
nanometers.
6.4 PRINCIPLE OF STM IMAGING
Consider a sharp conducting tip brought to within one nm of a specimen
surface. Typically, a bias of 0.01–1 V is applied between the tip and
the specimen. Under these conditions, the tip–surface spacing s is
sufficiently small that electrons can tunnel from, say, the tip to the
specimen. As a result, a current I flows across this gap and can be
shown to vary with s as in Eq. (6.3). Note that for most systems, the
effective work function is on the order of 4 eV. One can see that if
the tip–surface spacing is increased (decreased) by 0.1 nm, the tunneling
current will decrease (increase) by a factor ⬇10.
One can then exploit this sensitive dependence of the tunneling
current I on the tip–surface spacing for topographic imaging as follows.
In scanning the tip horizontally across the specimen, any change in
the tip–surface spacing results in a large change in the tunneling current
I. One can use some feedback mechanism to move the tip up or down
to maintain a constant value of I. According to Eq. (6.3), this implies
that one is maintaining a constant tip–surface spacing (the effective
work function may change with position due to surface heterogeneity,
but its variation is ignored in this discussion). In other words, the up-
and-down motion of the tip traces out the topography of the surface,
analogous to the conventional technique of stylus profilometry, except
that the tip never touches the surface in STM. This is known as constant
current imaging, a common imaging mode used in scanning tunneling
microscopy.
Let us return to the situation where the effective work function
varies with position. In the constant current imaging mode, one main-
tains a constant value of As
兹
during scanning. Therefore, for an
absolutely flat surface with an effective work function of (4 ⫾ 1) eV
(a substantial surface heterogeneity) and a nominal tip–surface spacing
of 1.0 nm, the STM topograph would reveal an apparent height variation
of ⫾ 0.1 nm due to such surface heterogeneities. Therefore, for surface
roughness variations exceeding 0.1 nm, STM images obtained in the
constant current mode reveal primarily surface topography. To sepa-
rately map such surface heterogeneities, one can modulate the vertical

105
6.4 PRINCIPLE OF STM IMAGING
position of the tip sinusoidally at a rate faster than the feedback response
of the system. In this case, the tunneling current is also modulated.
From Eq. (6.3), one can readily show that
dlnI
ds
⫽⫺A
兹
(6.4)
from which the work function variation can be imaged.
Because of the proximity of the tip to the surface and the nature
of tunneling, the tunneling electron beam diameter can be very small.
From Tersoff and Hamann (Phys. Rev. B31, 2 (1985)), the full-width
at half-maximum beam size is given in nanometers by
1.67
冪
z
k
(6.5)
where k is defined in Eq. (6.1), and z is the sum of R, the local radius
of curvature of the tip, and s, the tip–surface spacing. For a composite
work function of 4 eV (k⬇10), R ⫽ 0.2 nm, and s ⫽ 0.5 nm, the
electron beam diameter is on the order of 0.4 nm. This implies that the
tunneling current is self-focused into a region with atomic dimensions.
Atomic resolution has routinely been demonstrated in scanning tunnel-
ing microscopy.
E
XAMPLE.
Why does an STM work not only in vacuum, but also
in air and under liquids?
S
OLUTION.
In a typical tunneling operation, the volume through
which the tunneling electrons pass is about 0.1 nm
3
. Given that there
are 6 ⫻ 10
23
molecules in 22.4 liters of room-temperature air, we can
calculate the number of air molecules in a volume of 0.1 nm
3
as follows:
6 ⫻ 10
23
⫻ 0.1 ⫻ 10
⫺27
/ (22.4 ⫻ 10
⫺3
)
⫽ 2.7 ⫻ 10
⫺3
.
Therefore, there is less than 0.003 air molecule contained in this volume.
Knowing that there are 6 ⫻ 10
23
molecules in 18 cm
3
of room-tempera-
ture water, we can show that the corresponding number is 3.3. Therefore,
the tunneling electrons flow more or less unscattered by ambient mole-
cules in air or water.

106
CHAPTER6/SCANNING PROBE MICROSCOPY
6.5 STM IMAGE INTERPRETATION
In the preceding discussion, it is concluded that when the tunneling
current is kept constant during scanning, the resulting STM image
represents the surface topography. However, it is not clear what surface
topography means at the atomic scale. In the simplest approximation,
if we assume that the tip–surface separation is more than 1 nm so that
there is no chemical interaction, we can calculate the tunneling current
at ordinary temperatures using the golden rule,
I ⫽
2e
ប
兺
t,s
f(E
t
)[1 ⫺ f (E
s
⫹ eV)]兩M
ts
兩
2
␦
(E
t
⫺ E
s
) , (6.6)
where f is the Fermi function, E
t
energy of the state t associated with
the tip, E
s
that associated with the surface, V the bias voltage (assumed
negative on the tip), and M
ts
the tunneling matrix element. At small
bias, Eq. (6.6) can be simplified to
I ⫽
2e
2
ប
V
兺
t,s
兩M
ts
兩
2
␦
(E
t
⫺ E
F
)
␦
(E
s
⫺ E
F
) (6.7)
where E
F
is the Fermi energy. If the tip wavefunction is sufficiently
localized, then the matrix element is simply proportional to
s
(r
o
), the
surface wavefunction at position r
o
of the tip, and Eq. (6.7) is reduced
to
I ⬇
兺
s
兩
s
(r
o
)兩
2
␦
(E
s
⫺ E
F
) , (6.8)
in which 兩
s
(r
o
)兩
2
is the surface local density of states (LDOS) at the
Fermi energy at position r
o
. Therefore, the vertical motion of the tip
under the constant tunneling current mode gives a contour of constant
LDOS at E
F
of the surface. A more rigorous treatment assuming finite
size of the probe tip shows that Eq. (6.8) is still valid.
Intuitively, one would expect the amplitude of variation of the
LDOS at E
F
(corrugation) decreases with increasing distance from the
surface. At sufficiently large distances from the surface, the corrugation
becomes almost zero so that no atomic scale features are discernible.
This indicates that the resolution of the STM is a function of tip position
above the surface.
Q
UESTION FOR
D
ISCUSSION.
Platinum has a much higher density
of states at the Fermi energy than gold. Discuss how one can use STM