Chilingarian G.V. et al. Surface Operations in Petroleum Production, II
Подождите немного. Документ загружается.

345
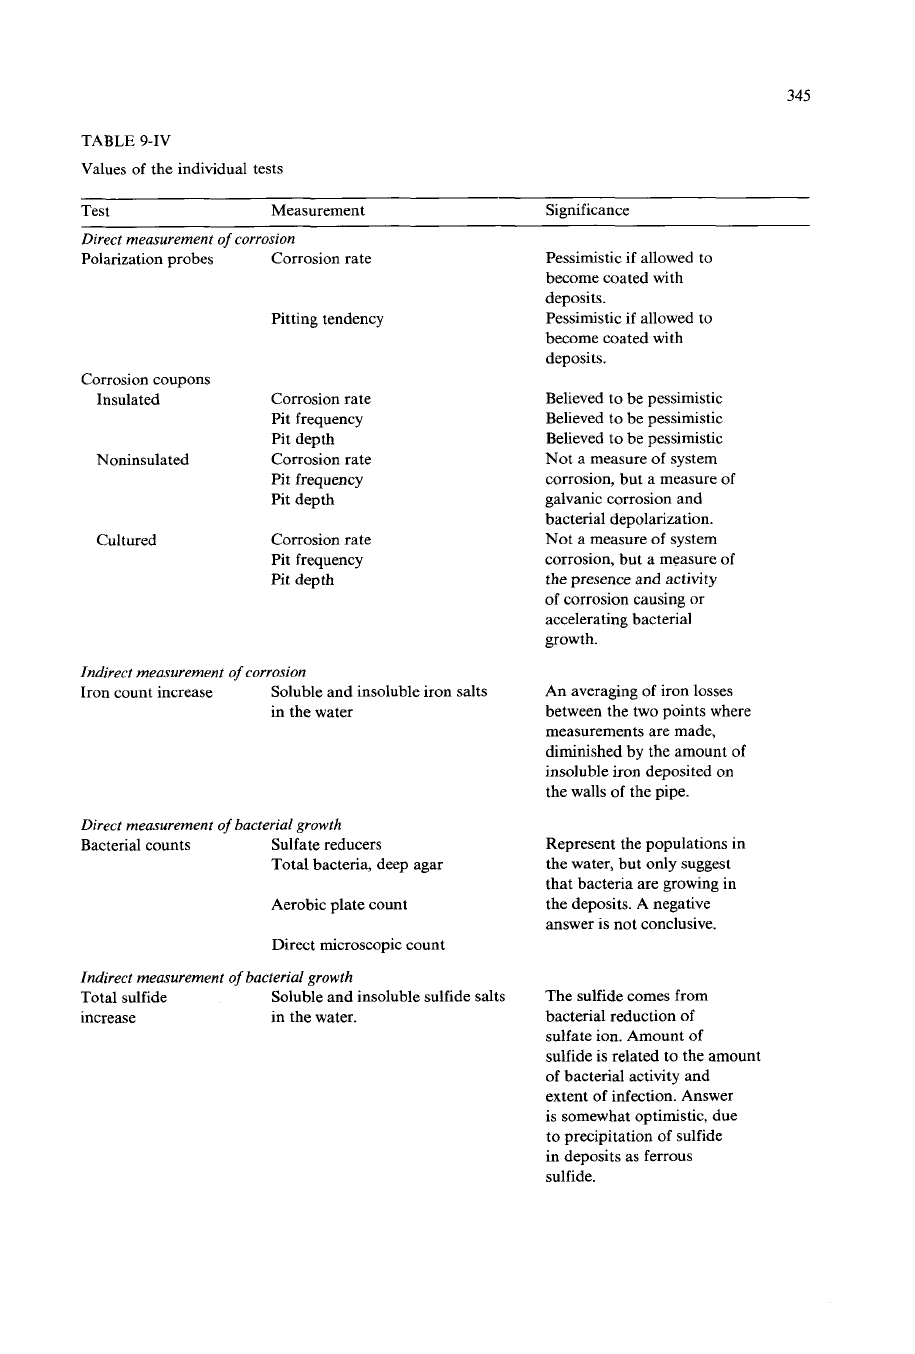
TABLE 9-IV
Values of the individual tests
Test Measurement Significance
Direct measurement
of
corrosion
Polarization probes Corrosion rate
Pitting tendency
Corrosion coupons
Insulated Corrosion rate
Pit frequency
Pit depth
Pit frequency
Pit depth
Noninsulated Corrosion rate
Cultured
Corrosion rate
Pit frequency
Pit
depth
Indirect rneasuremeni
of
corrosion
Iron count increase
Soluble and insoluble iron salts
in
the water
Direct measurement
of
bacterial growth
Bacterial counts Sulfate reducers
Total bacteria, deep agar
Aerobic plate count
Direct microscopic count
Indirect measurement
of
bacterial growth
Total sulfide
increase in the water.
Soluble and insoluble sulfide salts
Pessimistic if allowed to
become coated with
deposits.
Pessimistic if allowed to
become coated with
deposits.
Believed to be pessimistic
Believed to be pessimistic
Believed to be pessimistic
Not a measure
of
system
corrosion, but a measure of
galvanic corrosion and
bacterial depolarization.
Not a measure of system
corrosion, but a measure of
the presence and activity
of
corrosion causing or
accelerating bacterial
growth.
An averaging of iron losses
between the two points where
measurements are made,
diminished by the amount of
insoluble iron deposited on
the walls of the pipe.
Represent the populations in
the water, but only suggest
that bacteria are growing in
the deposits. A negative
answer is not conclusive.
The sulfide comes from
bacterial reduction
of
sulfate ion. Amount
of
sulfide is related to the amount
of bacterial activity and
extent
of
infection. Answer
is somewhat optimistic, due
to precipitation
of
sulfide
in deposits as ferrous
sulfide.
346
TABLE 9-IV (continued)
Test Measurement Significance
Redox potential Eh
change
Tests relating to the environment
Dissolved oxygen Oxygen
Membrane filter
test
Slope
Amount of solids
Composition of
solids
Test is an averaging
of
sulfide generated between
the two points sampled.
Average measurement
of
all
bacterial activity between
the two points sampled. It is
influenced by all bacteria,
not just sulfate-reducers.
Detects air entry in a
closed system.
Determines the oxygen content
to 0.01 ppm in the water at
the point of sampling.
Determines amount of solids
and their probable tendency
to cause deposits.
Water tests, to be meaningful, must measure the changes that have occurred in
the water. The assumption that the water source is uniform and uncontaminated can
be dangerous. The values of the various tests can be summarized as shown in Table
Originally, the iron count was expressed solely as parts per million
of
iron found
in the water. Later, one looked at the increase in iron count across the system.
This
method was better, but needed to be improved. Then iron count increases were
expressed as pounds per day per
1000
sq
ft of metal surface exposed to the water.
This
permitted one to make direct comparison between portions
of
a system and
between systems.
A
better way of expressing the rating, however,
is
as mils/year
9-IV.
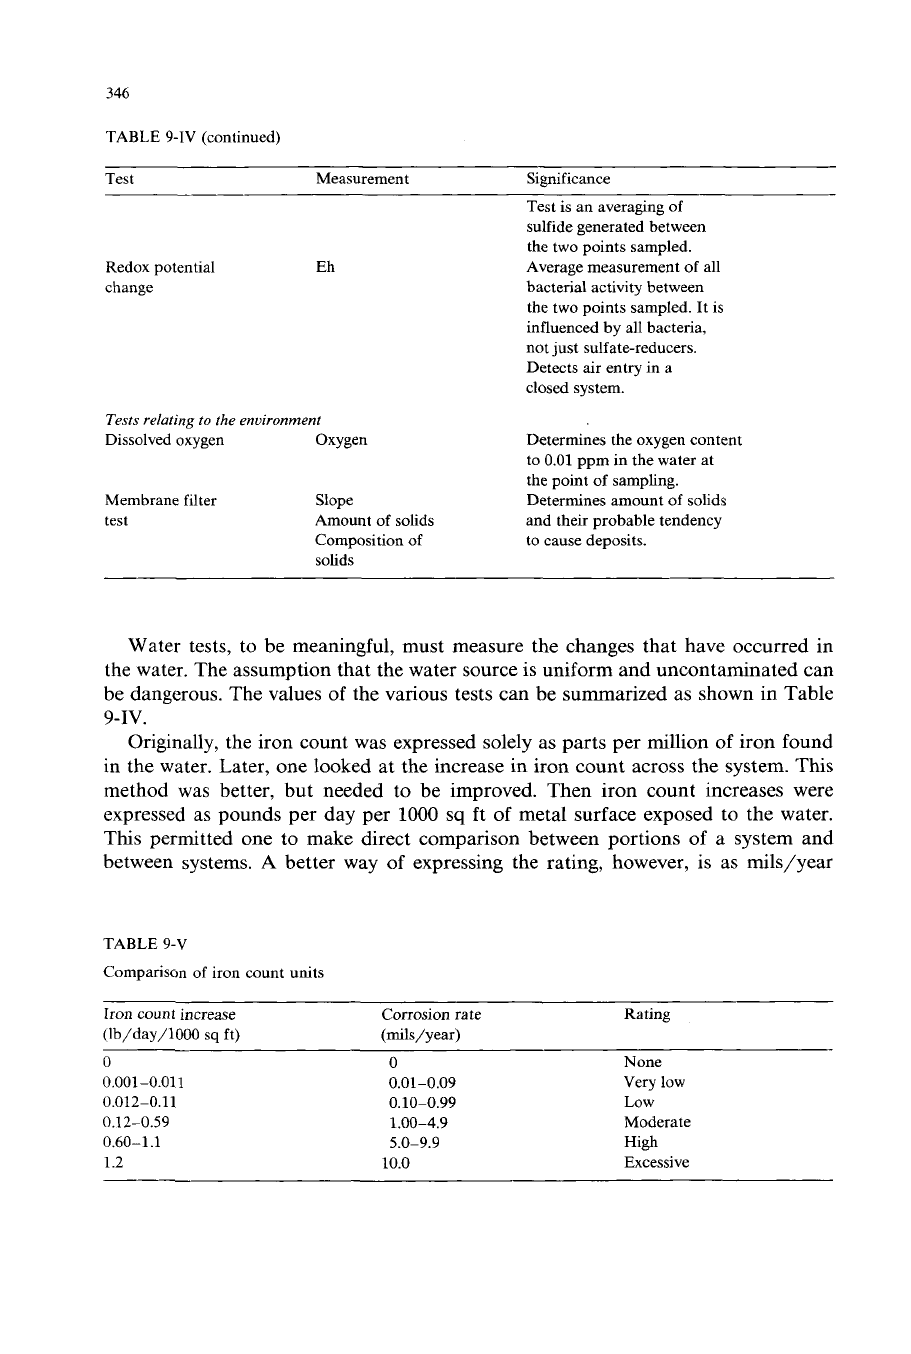
TABLE 9-V
Comparison
of
iron count units
Iron count increase Corrosion rate Rating
(lb/day/1000
sq
ft) (mils/year)
0
0.001-0.017
0.012-0.11
0.12-0.59
0.60-1.1
1.2
0
0.01-0.09
0.10-0.99
1.00-4.9
5.0-9.9
10.0
None
Very low
Low
Moderate
High
Excessive
347
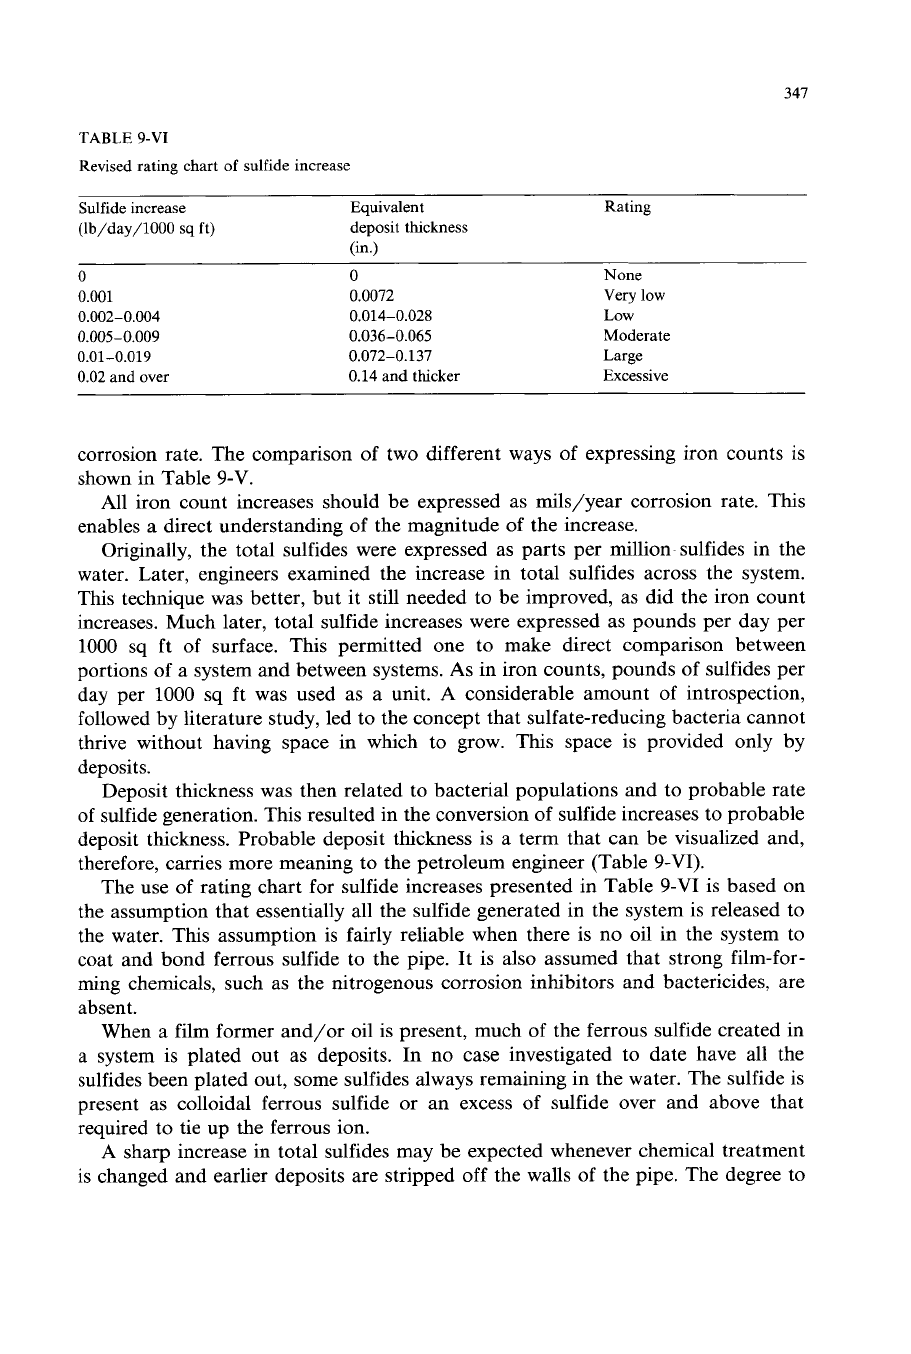
TABLE
9-VI
Revised rating chart
of
sulfide increase
Sulfide increase
(lb/day/1000 sq ft)
Equivalent
deposit thickness
(in.)
Rating
0
0.001
0.002-0.004
0.005-0.009
0.01-0.019
0.02
and over
0
0.0072
0.014-0.028
0.036-0.065
0.072-0.137
0.14
and thicker
None
Very
low
Low
Moderate
Large
Excessive
corrosion rate. The comparison of two different ways of expressing iron counts is
shown in Table
9-V.
All iron count increases should be expressed as mils/year corrosion rate. This
enables a direct understanding of the magnitude of the increase.
Originally, the total sulfides were expressed as parts per million sulfides in the
water. Later, engineers examined the increase in total sulfides across the system.
This technique was better, but it still needed to be improved, as did the iron count
increases. Much later, total sulfide increases were expressed as pounds per day per
1000
sq
ft
of surface. Ths permitted one to make direct comparison between
portions of a system and between systems.
As
in iron counts, pounds of sulfides per
day per
1000
sq
ft
was used as a unit.
A
considerable amount of introspection,
followed by literature study, led to the concept that sulfate-reducing bacteria cannot
thrive without having space in which to grow. This space is provided only by
deposits.
Deposit thickness was then related to bacterial populations and to probable rate
of sulfide generation. This resulted in the conversion of sulfide increases to probable
deposit thickness. Probable deposit thickness is a term that can be visualized and,
therefore, carries more meaning to the petroleum engineer (Table
9-VI).
The use of rating chart for sulfide increases presented in Table
9-VI
is based on
the assumption that essentially all the sulfide generated in the system is released to
the water. This assumption is fairly reliable when there
is
no oil in the system to
coat and bond ferrous sulfide to the pipe. It is also assumed that strong film-for-
ming chemicals, such as the nitrogenous corrosion inhibitors and bactericides, are
absent.
When a film former and/or oil is present, much of the ferrous sulfide created in
a system is plated out as deposits. In no case investigated to date have all the
sulfides been plated out, some sulfides always remaining in the water. The sulfide is
present as colloidal ferrous sulfide or an excess of sulfide over and above that
required to tie up the ferrous ion.
A
sharp increase in total sulfides may be expected whenever chemical treatment
is changed and earlier deposits are stripped off the walls of the pipe. The degree to
W
P
a3
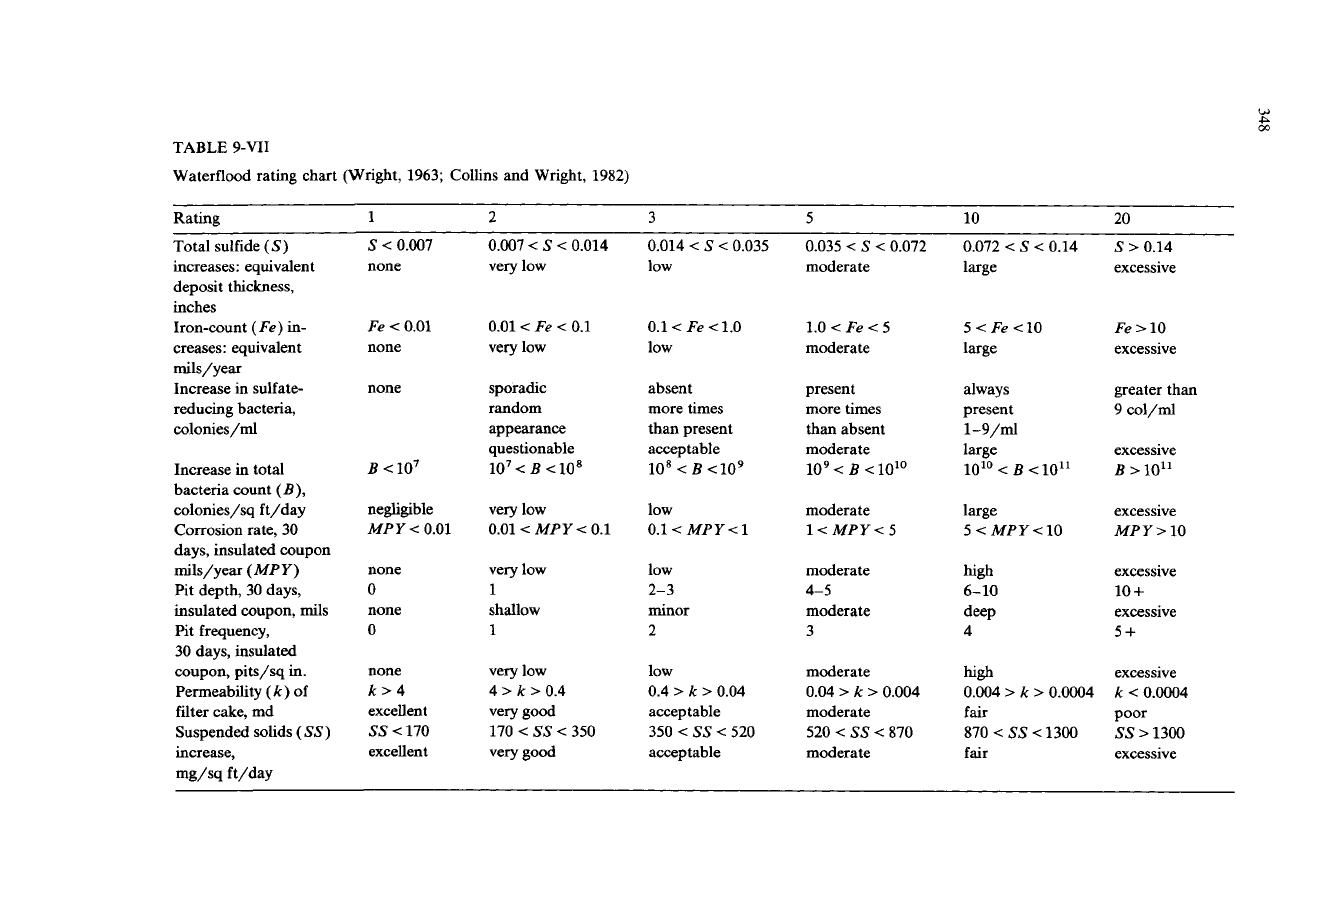
TABLE 9-VII
Waterflood rating chart (Wright, 1963; Collins and Wright, 1982)
Rating
1
2
3 5 10
20
Total sulfide
(S)
increases: equivalent
deposit thickness,
inches
Iron-count (Fe) in-
creases: equivalent
mils/ year
Increase in sulfate-
reducing bacteria,
colonies/ml
Increase in total
bacteria count
(B),
colonies/sq ft/day
Corrosion rate, 30
days, insulated coupon
mils/year
(
MP
Y)
Pit depth, 30 days,
insulated coupon, mils
Pit frequency,
30 days, insulated
coupon, pits/sq in.
Permeability (k)
of
filter cake, md
Suspended solids
(SS)
increase,
mg/sq ft/day
S
<
0.007
none
Fe
<
0.01
none
none
B
<
10'
neghgible
MPY
<
0.01
none
0
none
0
none
k>4
excellent
SS
<
170
excellent
0.007
<
S
<
0.014
very low
0.01
<
Fe
<
0.1
very low
sporadic
random
appearance
questionable
107
<
B
<
108
very low
0.01
<
MPY
<
0.1
very low
1
shallow
1
very low
4
>
k
>
0.4
very good
170
<
SS
<
350
very good
0.014
<
S
<
0.035
low moderate
0.035
<
S
<
0.072
0.1
<
Fe
<
1.0
low moderate
1.0
<
Fe
<
5
absent present
more times more times
than present than absent
acceptable moderate
lo8
<
B
<
lo9
lo9
<
B
<
10"
low moderate
0.1
<
MPY
<
1
1
<
MPY
<
5
low
2-3
minor
moderate
4-5
moderate
...
L
5
low moderate
0.4
>
k
>
0.04
acceptable moderate
350
<
SS
<
520
acceptable moderate
0.04
>
k
>
0.004
520
<
SS
<
870
0.072
<
S
<
0.14
large
5<Fe<10
large
always
present
large
10"
<
B
<
10"
1-9/ml
large
5
<
MPY
<lo
high
6-10
4
high
0.004
>
k
>
0.0004
fair
870
<
SS
<
1300
fair
S
z
0.14
excessive
Fe
>
10
excessive
greater than
9 col/ml
excessive
B
>
10"
excessive
MPY
>
10
excessive
10
+
excessive
5+
excessive
k
<
0.0004
poor
SS
>
1300
excessive

349
which this occurs is a function of the nature
of
the bonding material and the ability
of the new treatment to disrupt the bond.
A similar study was made of total bacteria, because the problem with bacteria
counts is that the number obtained can not be visualized in terms of field
application.
It must be remembered that the bacteria that are counted in a water sample
represent the sum of two components:
(1)
the bacteria entering the system and
traveling through, and
(2)
the bacteria eroded off the walls of the pipe from
actively-growing deposits. Thus, to obtain an insight into the significance of a
bacteria count one must translate the number of colonies per milliliter into a
universally usable number. Increase in the number of colonies per square foot of
interior pipe surface, which is a useful measure, can be expressed as follows:
Increase in number of colonies/sq ft/day
=
(increase in bacteria
colonies/ml)(bbl/day water)(607,
200)
:
(diameter, in.)(length, ft).
The increase in bacteria expressed as number
of
colonies per square foot
of
surface has the same limitations as iron counts and sulfide increases, i.e., assuming
uniform conditions between the two points sampled. Localized hot spot conditions
cannot be detected except by sampling at closer distances along the systems.
High numbers of general bacteria colonies per square foot of surface has the
same significance as a thick average deposit thickness, as determined by using the
sulfide increase test. Simply stated, it means that the system is dirty. Remedial
measures can be the same as those in the case of high sulfide increases.
The rationale for developing the numerical rating for increase in bacteria per sq
ft per day
is
as follows:
The industry yardstick for numbers of general bacteria that do or do not
constitute a problem was developed some twenty years ago. It was determined that
there was no loss of injectivity in a waterflood when the general bacteria counts
were
10,000
colonies per milliliter or lower. When the general bacteria counts
became
100,000
colonies per milliliter or larger, there was loss
of
injectivity. This
observation has become the rule
of
thumb for most oil-field personnel.
In preparing a classification, a flow rate
of
3
ft/sec was assumed in a 6-in.
diameter injection line one mile long. The assumptions are reasonable because the
end result
is
in several orders of magnitude, whereas any errors in the assumptions
would be substantially less than one order
of
magnitude (see Table 9-VII).
The waterflood rating chart (Table 9-VII) was developed to enable interpretation
of the test data, which are usually determined during waterfloods. This chart
appears to be the first attempt to ascribe ratings. Although there has been very little
opposition to the chart in the industry, opinions vary considerably as to the range
under each rating. One can categorize the tests as shown in the following outline:
(1)
Measurement of actual corrosion:
Direct Indirect
(a) Corrosion rate, insulated coupon
(b)
Pit depth, insulated
(c) Pit frequency, insulated
(a) Iron count increase
350
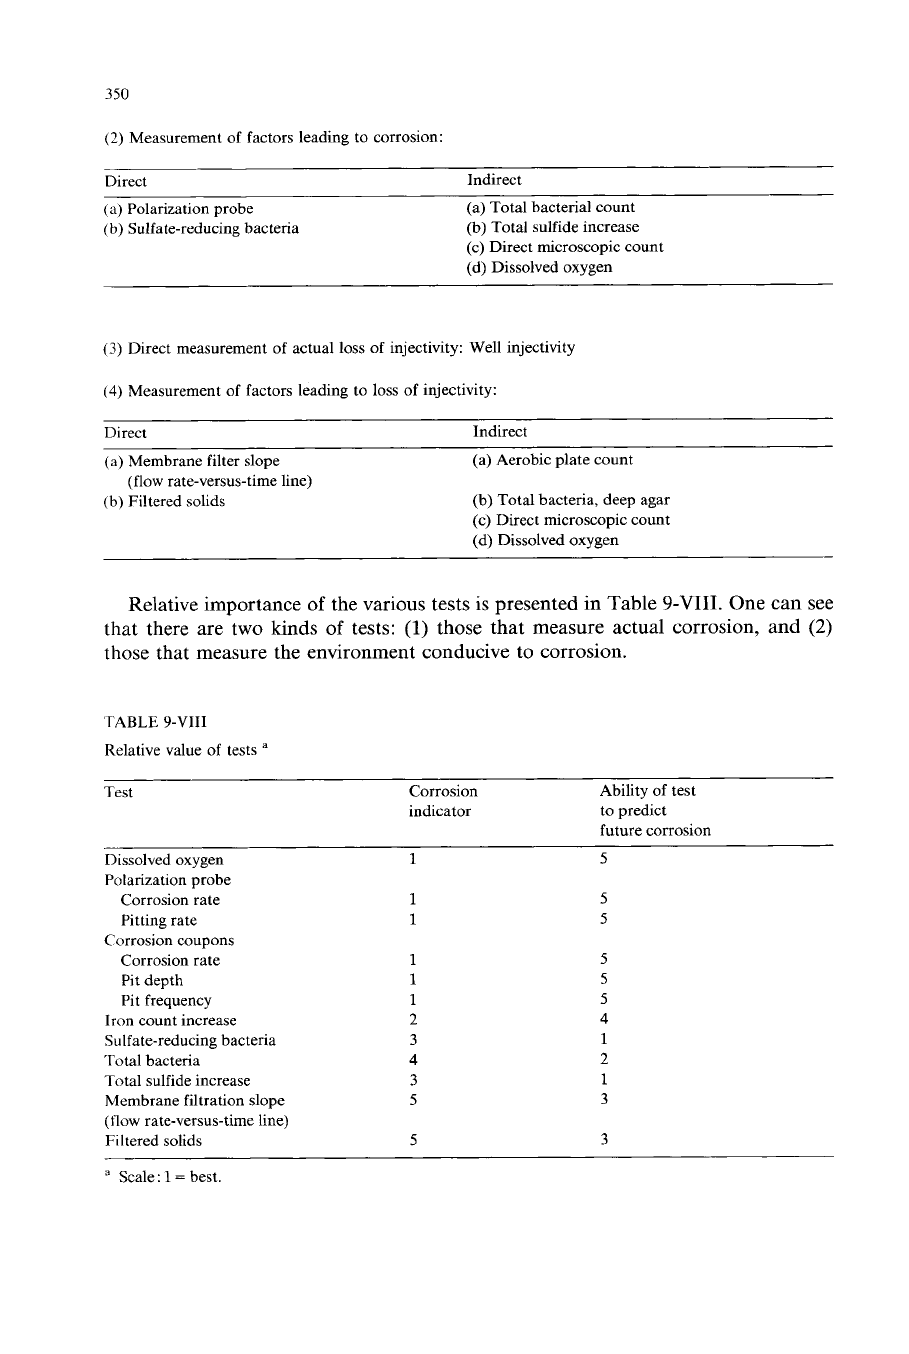
(2)
Measurement of factors leading to corrosion:
Direct Indirect
(a)
Polarization probe
(b) Sulfate-reducing bacteria
(a)
Total bacterial count
(b) Total sulfide increase
(c) Direct microscopic count
(d) Dissolved oxygen
(3)
Direct measurement of actual
loss
of injectivity: Well injectivity
(4)
Measurement of factors leading to
loss
of
injectivity:
Direct Indirect
(a)
Membrane filter slope
(a) Aerobic plate count
(flow
rate-versus-time line)
(b) Filtered solids
(b) Total bacteria, deep agar
(c) Direct microscopic count
(d) Dissolved oxygen
Relative importance
of
the various tests is presented in Table
9-VIII.
One can see
that there are two kinds
of
tests:
(1)
those that measure actual corrosion, and
(2)
those that measure the environment conducive to corrosion.
'TABLE
9-VIII
Relative value of tests
a
Test Corrosion Ability of test
indicator to predict
future corrosion
~
Dissolved oxygen
Polarization probe
Corrosion rate
Pitting rate
Corrosion coupons
Corrosion rate
Pit
depth
Pit frequency
Iron count increase
Sulfate-reducing bacteria
'Total bacteria
Total sulfide increase
Membrane filtration slope
(flow
rate-versus-time line)
Filtered solids
1
1
1
5
5
5
5
3
a
Scale
:
1
=
best.
351
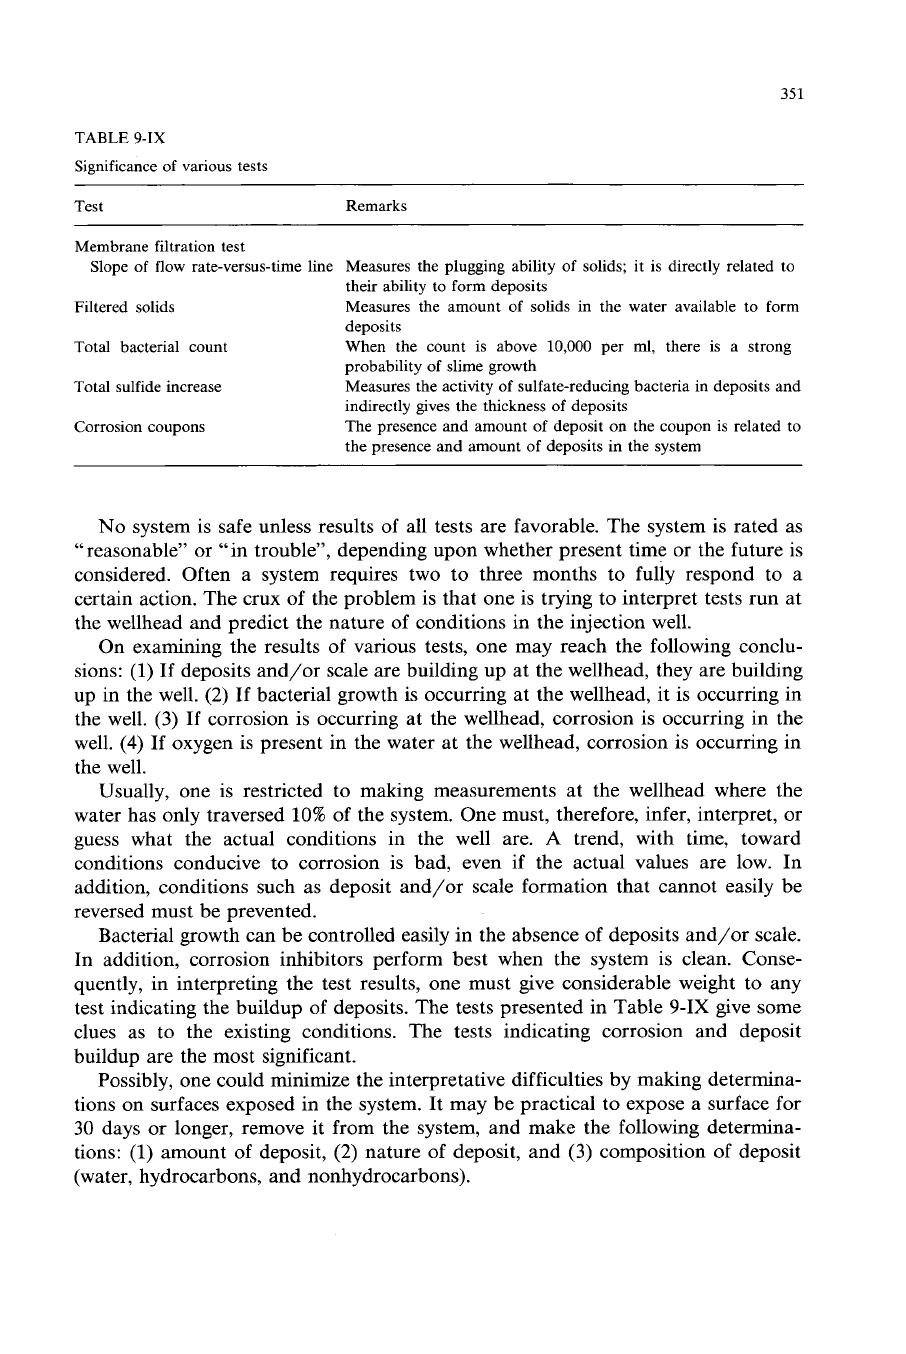
TABLE
9-IX
Significance of various tests
Test Remarks
Membrane filtration test
Slope of flow rate-versus-time line
Filtered solids
Total bacterial count
Total sulfide increase
Corrosion coupons
Measures the plugging ability of solids; it is directly related to
their ability to form deposits
Measures the amount of solids in the water available to form
deposits
When the count is above
10,000
per ml, there is a strong
probability of slime growth
Measures the activity of sulfate-reducing bacteria in deposits and
indirectly gives the thickness
of
deposits
The presence and amount
of
deposit on the coupon is related to
the presence and amount of deposits in the system
No
system is safe unless results of all tests are favorable. The system
is
rated as
“reasonable” or “in trouble”, depending upon whether present time or the future is
considered. Often a system requires two to three months to fudy respond to a
certain action. The crux of the problem is that one is trying to interpret tests run at
the wellhead and predict the nature of conditions in the injection well.
On examining the results of various tests, one may reach the following conclu-
sions:
(1)
If deposits and/or scale are building up at the wellhead, they are building
up in the well.
(2)
If
bacterial growth is occurring at the wellhead, it is occurring in
the well.
(3)
If corrosion is occurring at the wellhead, corrosion is occurring in the
well.
(4)
If oxygen is present in the water at the wellhead, corrosion is occurring in
the well.
Usually, one is restricted to malung measurements at the wellhead where the
water has only traversed
10%
of the system. One must, therefore, infer, interpret, or
guess what the actual conditions in the well are.
A
trend, with time, toward
conditions conducive to corrosion is bad, even if the actual values are low. In
addition, conditions such as deposit and/or scale formation that cannot easily be
reversed must be prevented.
Bacterial growth can be controlled easily in the absence of deposits and/or scale.
In addition, corrosion inhibitors perform best when the system is clean. Conse-
quently, in interpreting the test results, one must give considerable weight to any
test indicating the buildup of deposits. The tests presented in Table
9-IX
give some
clues as to the existing conditions. The tests indicating corrosion and deposit
buildup are the most significant.
Possibly, one could minimize the interpretative difficulties by making determina-
tions on surfaces exposed in the system. It may be practical to expose a surface for
30
days or longer, remove it from the system, and make the following determina-
tions:
(1)
amount
of
deposit,
(2)
nature of deposit, and
(3)
composition of deposit
(water, hydrocarbons, and nonhydrocarbons).
352
Summary
The significance of various tests can be summarized as follows:
(1)
The insulated coupon test directly measures corrosion. The disadvantage of
this test is that it represents only the conditions present at that one location, which
is
an infinitesimal fraction of the surface area of the system.
(2)
Noninsulated and cultured coupons tests elucidate the mechanism of corro-
sion by providing a more favorable environment for corrosion.
(3)
Dissolved oxygen and total sulfide increase tests directly measure factors
which cause or accelerate corrosion. The dissolved oxygen test is direct and realistic.
The sulfide increase test can be optimistic, due to the binding of sulfides in the
deposits as ferrous sulfide.
(4)
Two tests measure bacterial growth in the system. The bacterial counts
represent only those bacteria eroded away from deposits. Thus, a negative answer is
always questionable. The redox potential change is an averaging test, which indi-
rectly indicates the amount of total bacterial activity between two points or
indicates air entry in a closed system. This test is reliable in the presence
of
large
differences, but is not reliable when small differences exist.
(5)
The membrane filter test measures the amount and kind of solids in the water.
Proper interpretation of this test allows the correction of conditions which cause
deposition, before significant deposits are formed.
There are many useful tests, but their quantitative significance is hard to
determine, because most of the tests are indirect measurements of processes taking
place in the system and only partially measure the dynamics at the metal
surface-water interface.
Inasmuch as one is measuring the change that has occurred in the water, it must
be determined where the change took place. Conceivably the following alternatives
are possible:
(1)
The entire system between sampling points contributed uniformly
to
the change.
(2)
Only 10% or less is responsible for the change, and 90% or more
of the system between the sample points did not contribute to the change.
Under these circumstances, a given change can be interpreted as catastrophic or
negligible in nature, depending upon whether one assumes that 10% or less of the
system or the entire system caused the change. Interpretation of water tests,
therefore, is fraught with many apparent contradictions between predictions and
actual field results.
Reporting
of
test
data
An immediate verbal report of test data is made whenever conditions warrant
correction. A written report
of
the findings, together with recommendations, is
made as soon as the laboratory phase
of
the testing is completed, except the test for
sulfate-reducing bacteria. The latter report includes preliminary bacterial counts
after one or two weeks of incubation. Final bacterial counts are made at the
conclusion
of
four weeks of incubation, as prescribed in API
RP
38
(1965).
353
Test data are plotted on time series graphs. This graphical presentation is
examined monthly and enables a quick detection of trends. This is very valuable,
because if water is sampled only once a month, erroneous conclusions can be
reached
if
judgement is based on analysis of a single sample.
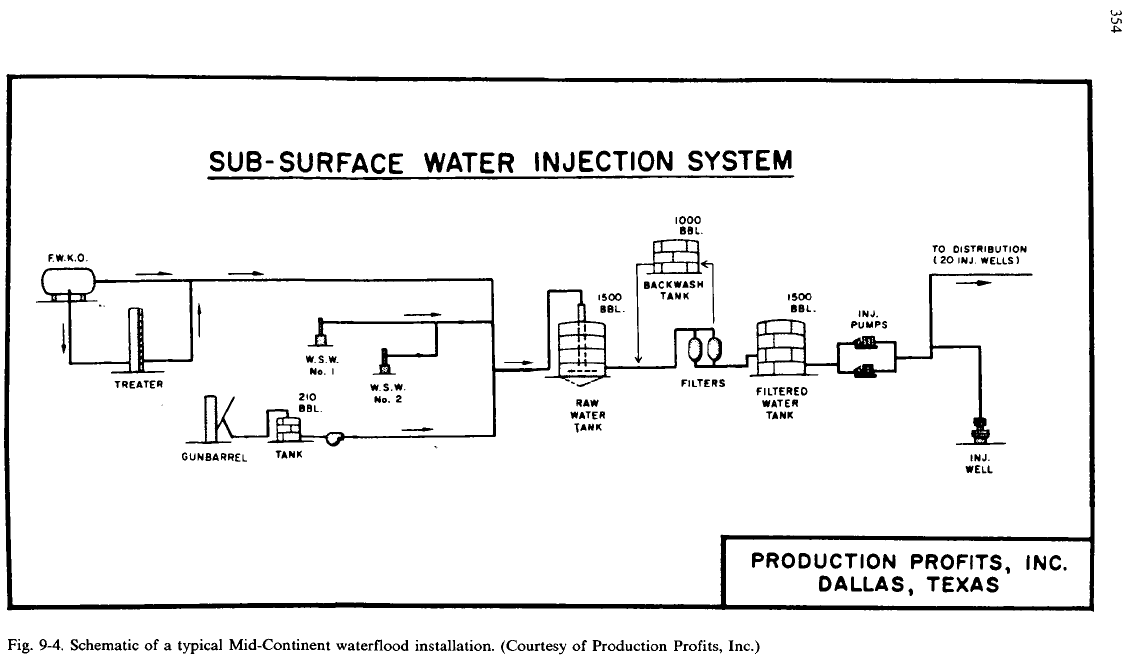
PREPARATION OF WATER FOR SUBSURFACE INJECTION
There is a limited choice in deciding how to prepare a water for subsurface
injection, because the nature of the effluent has a decided bearing on the problem.
The choice is very limited in specific instances. Some treatment processes (see
Wright and Davies, 1966) are common to all sources of water, whereas others are
peculiar to one or more sources. Figure 9-4 is a schematic of a typical Mid-Conti-
nent waterflood installation. The major treatment processes for water injection are
as follows: (1) oil removal,
(2)
gas removal, and
(3)
solids removal. All other
treatment processes are subsidiary to these main processes.
Oil
removal
Oil removal is basic to all treatment processes involving oil field water, although
the necessary completeness of oil removal may vary widely. There is an economic
limit or dividing line for each lease when the amount of oil removal for the value of
the oil recovered ceases to be profitable.
The ease of removing oil from water is greatly influenced by chemical treatment
and the physical handling of the oil-water mixture before it reaches the injection
water system. Frequently, the operator may make a minor change in the chemical
treatment or the physical handling of the oil-water mixture before it reaches the
injection water facility. This change may result in a considerable increase in the cost
of operating the injection water facility.
The treatment and handling of oil and water from the point where they leave the
formation to the ultimate injection of the water must be viewed as an integrated
process. All changes, mechanical or chemical, must be reviewed for their total effect
on the system, not just the immediate problem at hand. The following examples
illustrate the need for integrated approach:
(1) Overtreatment of producing wells with certain types of scale inhibitors will
stabilize the dispersion of oil in water, malung oil removal in the injection water
system more difficult.
(2)
Certain types of corrosion inhibitors act as oil-in-water emulsifying agents
and will cause oil-in-water emulsions to appear in the injection water facility when
used in slug treatments.
(3)
Some emulsion breakers used today, which give rise to very clean oil, produce
very stable oil-in-water emulsions in the injection water facility.
There are three practical methods of removing oil from water, each one having its
distinct place in water treatment: gravity separation, flotation, and filtration.
W
v,
P
FW.K.0.
TT
TREATER
SUB-SURFACE WATER INJECTION
SYSTEM
w.s
57-
w.
w
s.w
No.
2
-
-___
--EL
-
RAW
WATER
TANK
1000
439
BACKWASU
I
TANK
I500
TO DISTRIBUTION
I20
INJ WELLS)
TANK
INJ
WELL
PRODUCTION PROFITS, INC.
I
DALLAS,
TEXAS
Fig.
9-4.
Schematic
of
a typical Mid-Continent waterflood installation. (Courtesy of Production Profits, Inc.)