Brealey, Myers. Principles of Corporate Finance. 7th edition
Подождите немного. Документ загружается.


Brealey−Meyers:
Principles of Corporate
Finance, Seventh Edition
VII. Debt Financing 24. Valuing Debt
© The McGraw−Hill
Companies, 2003
totally unrelated to other events in the economy. In this case the default risk is
wholly diversifiable, and the beta of the notes is zero. The notes would sell for
An investor who purchased these notes for $800 would receive a promised yield of
about 36 percent:
That is, an investor who purchased the notes for $800 would earn a 36.3 percent
rate of return if Backwoods does not default. Bond traders therefore might say that
the Backwoods notes “yield 36 percent.” But the smart investor would realize that
the notes’ expected yield is only 9 percent, the same as on risk-free bonds.
This of course assumes that risk of default with these notes is wholly diversifiable,
so that they have no market risk. In general, risky bonds do have market risk (that is,
positive betas) because default is more likely to occur in recessions when all busi-
nesses are doing poorly. Suppose that investors demand a 2 percent risk premium
and an 11 percent expected rate of return. Then the Backwoods notes will sell for
and offer a promised yield of , or
about 39 percent.
You rarely see traded bonds offering 39 percent yields, although we will soon en-
counter an example of one company’s bonds that had a promised yield of 50 percent.
Bond Ratings
The relative quality of most traded bonds can be judged from bond ratings given by
Moody’s and Standard and Poor’s. Table 24.4 summarizes these ratings. For example,
the highest quality bonds are rated triple-A (Aaa) by Moody’s, then come double-A
(Aa) bonds, and so on. Bonds rated Baa or above are known as investment-grade bonds.
Commercial banks, many pension funds, and other financial institutions are not al-
lowed to invest in bonds unless they are investment-grade.
24
11, 090/785.592⫺ 1 ⫽ .388872/1.11 ⫽ $785.59
Promised yield ⫽
$1, 090
$800
⫺ 1 ⫽ .363
PV of notes ⫽
$872
1.09
⫽ $800
684 PART VII
Debt Financing
Moody’s Ratings Standard and Poor’s Ratings
Investment-grade:
Aaa AAA
Aa AA
AA
Baa BBB
Junk bonds:
Ba BB
BB
Caa CCC
Ca CC
CC
TABLE 24.4
Key to Moody’s and Standard and Poor’s bond
ratings. The highest quality bonds are rated triple-A.
Then come double-A bonds, and so on. Investment-
grade bonds have to be Baa or higher. Bonds that
don’t make this cut are called junk bonds.
24
Investment-grade bonds can usually be entered at face value on the books of banks and life insurance
companies.

Brealey−Meyers:
Principles of Corporate
Finance, Seventh Edition
VII. Debt Financing 24. Valuing Debt
© The McGraw−Hill
Companies, 2003
Bond ratings are judgments about firms’ financial and business prospects. There
is no fixed formula by which ratings are calculated. Nevertheless, investment
bankers, bond portfolio managers, and others who follow the bond market closely
can get a fairly good idea of how a bond will be rated by looking at a few key num-
bers such as the firm’s debt–equity ratio, the ratio of earnings to interest, and the
return on assets.
Table 24.5 shows that bond ratings do reflect the probability of default. Since
1971 no bond that was initially rated triple-A by Standard and Poor’s has defaulted
in the year after issue and fewer than one in a thousand has defaulted within 10
years of issue. At the other extreme, over 2 percent of CCC bonds have defaulted
in their first year and by year 10 almost half have done so. Of course, bonds rarely
fall suddenly from grace. As time passes and the company becomes progressively
more shaky, the agencies revise downward the bond’s rating to reflect the increas-
ing probability of default.
Since bond ratings reflect the probability of default, it is not surprising that there
is also a close correspondence between a bond’s rating and its promised yield. For
example, in the postwar period the promised yield on Moody’s Baa corporate
bonds has been on average about .9 percent more than on Aaa’s.
Firms and governments, having noticed the link between bond ratings and
yields, worry that a reduction in rating will result in higher interest charges.
25
When the Asian currency crisis in 1998 led Moody’s to downgrade the Malaysian
government’s risk rating, the government immediately canceled a much-needed
$2 billion bond issue. Investors have a different concern; they worry that the rating
agencies are slow to react when businesses are in trouble. When Enron went belly
up in 2001, investors protested that only two months earlier the company’s debt
had an investment-grade rating.
Junk Bonds
Bonds rated below Baa are known as junk bonds. Most junk bonds used to be fallen
angels, that is, bonds of companies that had fallen on hard times. But during the
1980s new issues of junk bonds multiplied tenfold as more and more companies is-
sued large quantities of low-grade debt to finance takeovers or to defend them-
selves against being taken over.
CHAPTER 24
Valuing Debt 685
Percentage Defaulting within
Rating at 1 Year 5 Years 10 Years
Time of Issue after Issue after Issue after Issue
AAA .0 .1 .1
AA .0 .7 .7
A.0.2.6
BBB .0 1.6 2.8
BB .4 8.3 16.4
B 1.5 22.0 33.0
CCC 2.3 35.4 47.5
TABLE 24.5
Default rates of corporate bonds
1971–1997 by Standard and Poor’s
rating at date of issue.
Source: R. A. Waldman, E. I. Altman, and
A. R. Ginsberg, “Defaults and Returns on
High Yield Bonds: Analysis through 1997,”
Salomon Smith Barney, New York, January
30, 1998.
25
They almost certainly exaggerate the influence of the rating agencies, which are as much following in-
vestor opinion as leading it.
Brealey−Meyers:
Principles of Corporate
Finance, Seventh Edition
VII. Debt Financing 24. Valuing Debt
© The McGraw−Hill
Companies, 2003
The development of this market for low-grade corporate bonds was largely the
brainchild of the investment banking firm Drexel Burnham Lambert. The result was
that for the first time corporate midgets were able to take control of corporate giants,
because they could finance this activity by issues of debt. However, issuers of junk
bonds often had debt ratios of 90 or 95 percent. Many worried that these high levels
of leverage resulted in undue risk and pressed for legislation to ban junk bonds.
One of the largest issuers of junk bonds was Campeau Corporation. Between
1986 and 1988 Campeau amassed a huge retailing empire by acquiring major de-
partment store chains such as Federated Department Stores and Allied Stores. Un-
fortunately, it also amassed $10.9 billion in debt, which was supported by just $.9
billion of book equity. So when in September 1989 Campeau announced that it was
having difficulties meeting the interest payments on its debt, the junk bond mar-
ket took a nosedive and worries about the riskiness of junk bonds intensified.
Campeau’s own bonds fell to the point at which they offered a promised yield of
nearly 50 percent. Campeau eventually filed for bankruptcy, and investors with
holdings of junk bonds took large losses.
In 1990 and 1991 the default rate for junk bonds climbed to over 10 percent and
the market for new issues of these bonds dried up. But later in the decade the mar-
ket began to boom again and with increasing economic prosperity the annual de-
fault rate fell to below 2 percent before rising again in the new millenium.
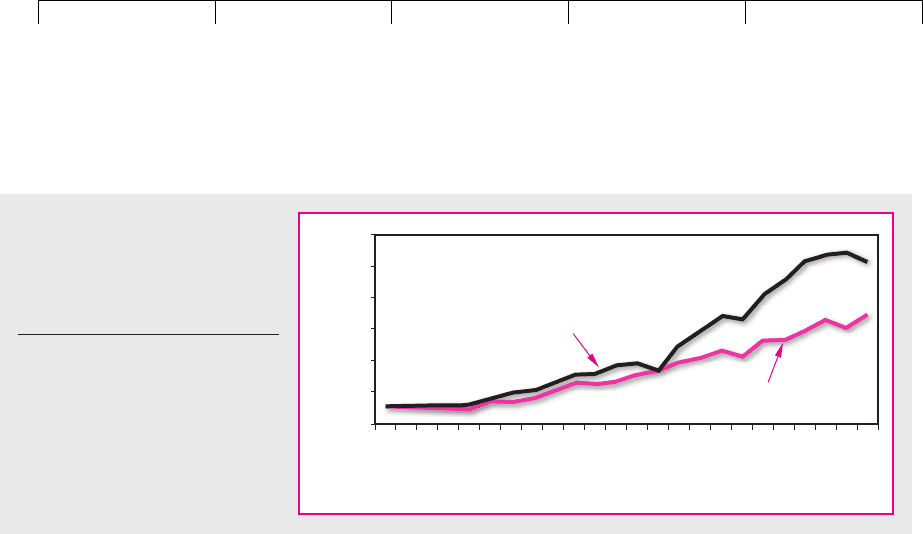
Junk bonds promise a higher yield than U.S. Treasuries. When junk bonds were
out of favor, their yields reached more than 9 percent above that of Treasuries, but
the gap has since narrowed. Of course, companies can’t always keep their prom-
ises. Many junk bonds have defaulted, while some of the more successful issuers
have called their bonds, thus depriving their holders of the prospect of a continu-
ing stream of high coupon payments. Figure 24.8 shows the performance since
1977 of a portfolio of junk bonds and 10-year Treasury bonds. On average, the
promised yield on junk bonds was 4.8 percent higher than that on Treasuries, but the
annual realized return was only 1.9 percent higher.
Option Pricing and Risky Debt
In Section 20.2 we showed that holding a corporate bond is equivalent to lending
money with no chance of default but at the same time giving stockholders a put
option on the firm’s assets. When a firm defaults, its stockholders are in effect ex-
686 PART VII
Debt Financing
0
2
4
6
8
10
12
1977
1979
1981
1983
1985
1987
1989
1991
1993
1995
1997
1999
Year
Cumulative value, dollars
U.S. Treasury bonds
Junk bonds
FIGURE 24.8
Cumulative value of investments in
junk and Treasury bonds,
1978–2000. The plot assumes
investment of $1 in 1977.
Source: E. I. Altman, “High Yield Bond
and Default Study,” Salomon Smith
Barney, July 19, 2001.

Brealey−Meyers:
Principles of Corporate
Finance, Seventh Edition
VII. Debt Financing 24. Valuing Debt
© The McGraw−Hill
Companies, 2003
ercising their put. The put’s value is the value of limited liability—the value of
stockholders’ right to walk away from their firm’s debts in exchange for handing
over the firm’s assets to its creditors. Thus, valuing bonds should be a two-step
process:
The first step is easy: Calculate the bond’s value assuming no default risk. (Dis-
count promised interest and principal payments at the rates offered by Treasury is-
sues.) Second, calculate the value of a put written on the firm’s assets, where the
maturity of the put equals the maturity of the bond and the exercise price of the
put equals the promised payments to bondholders.
Owning a corporate bond is also equivalent to owning the firm’s assets but giv-
ing a call option on these assets to the firm’s stockholders:
Thus you can also calculate a bond’s value, given the value of the firm’s assets, by
valuing a call option on these assets and subtracting the call value from the asset
value. (The call value is just the value of the firm’s common stock.) Therefore, if you
can value puts and calls on a firm’s assets, you can value its debt.
26
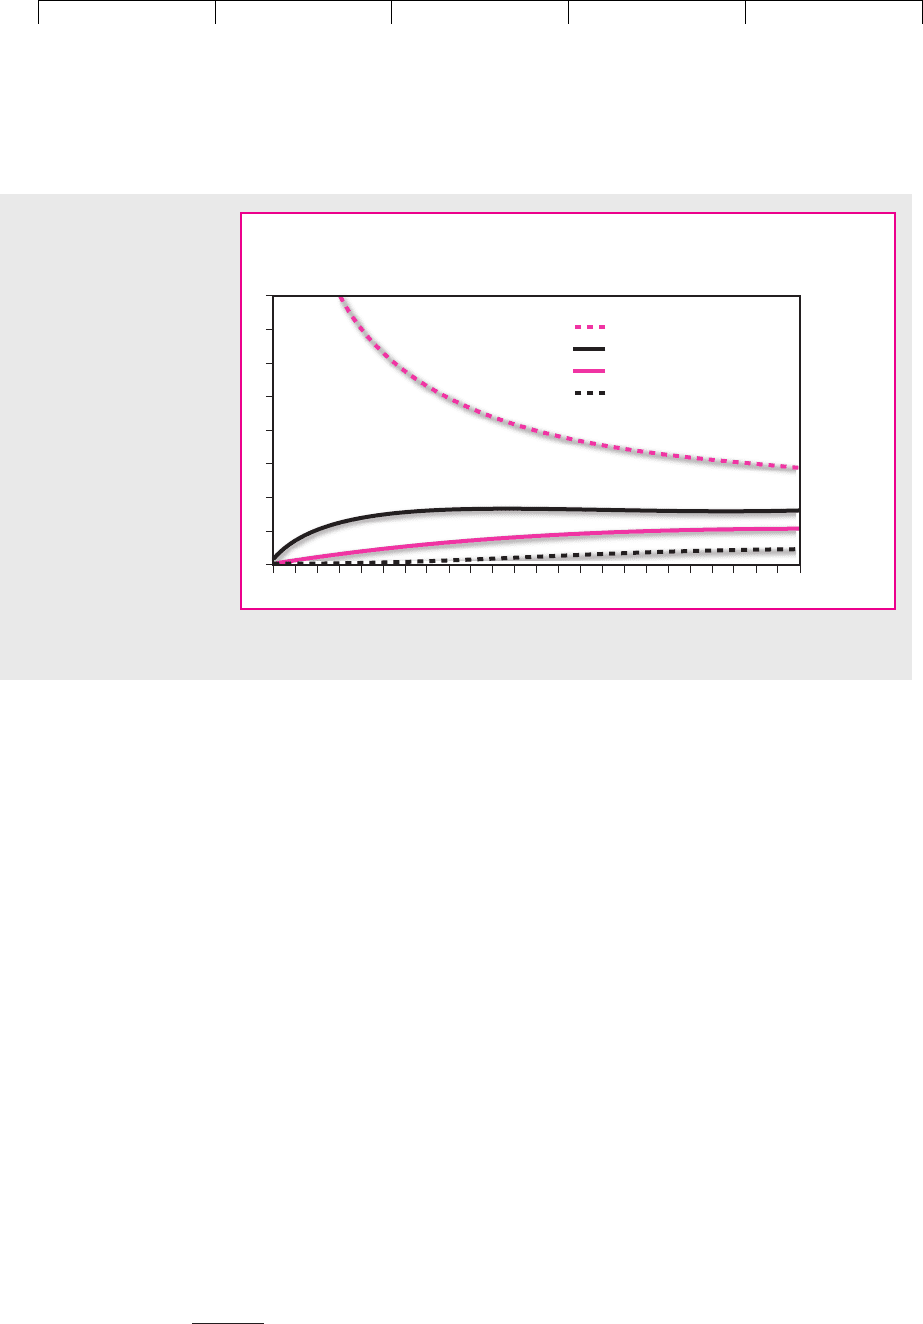
Figure 24.9 shows a simple application of option theory to pricing corporate
debt. It takes a company with average operating risk and shows how the promised
interest rate on its debt should vary with its leverage and the maturity of the debt.
For example, if the company has a 20 percent debt ratio and all its debt matures in
25 years, then it should pay about one-half percentage point above the government
borrowing rate to compensate for default risk. Companies with more leverage
ought to pay higher premiums. Notice that at relatively modest levels of leverage,
promised yields increase with maturity. This makes sense, for the longer you have
to wait for repayment, the greater is the chance that things will go wrong. How-
ever, if the company is already in distress and its assets are worth less than the face
value of the debt, then promised yields are higher at low maturities. (In our exam-
ple, they run off the top of the graph for maturities of less than four years.) This
also makes sense, for in these cases the longer that you wait, the greater is the
chance that the company will recover and avoid default.
27
Notice that in constructing Figure 24.9 we made several artificial assumptions.
One assumption is that the company does not pay dividends. If it does regularly
pay out part of its assets to stockholders, there may be substantially fewer assets to
protect the bondholder in the event of trouble. In this case, the market may be jus-
tified in requiring a higher yield on the company’s bonds.
There are other complications that make the valuation of corporate debt and eq-
uity a good bit more difficult than it sounds. For example, in constructing Figure 24.9
Bond value ⫽ asset value ⫺ value of call option on assets
bond value value
Bond value ⫽ assuming no chance ⫺ of put
of default option
CHAPTER 24 Valuing Debt 687
26
However, option-valuation procedures cannot value the assets of the firm. Puts and calls must be val-
ued as a proportion of asset value. For example, note that the Black–Scholes formula (Section 21.3) re-
quires stock price in order to compute the value of a call option.
27
Sarig and Warga plot the difference between corporate bond yields and the yield on U.S. Treasuries.
They confirm that the yield difference increases with maturity for high-grade bonds and declines for
low-grade bonds. See O. Sarig and A. Warga, “Bond Price Data and Bond Market Liquidity,” Journal of
Financial and Quantitative Analysis 44 (1989), pp. 1351–1360. Incidentally, the shape of the curves in Fig-
ure 24.9 depends on how leverage is defined. If we had plotted curves for constant ratios of the market
value of debt to debt plus equity, the curves would all have started at zero.
Brealey−Meyers:
Principles of Corporate
Finance, Seventh Edition
VII. Debt Financing 24. Valuing Debt
© The McGraw−Hill
Companies, 2003
we assumed that the company made only a single issue of zero-coupon debt. But
suppose instead that it issues a 10-year bond which pays interest annually. We can
still think of the company’s stock as a call option that can be exercised by making the
promised payments. But in this case there are 10 payments rather than just 1. To
value the stock, we would have to value 10 sequential call options. The first option
can be exercised by making the first interest payment when it comes due. By exer-
cise the stockholders obtain a second call option, which can be exercised by making
the second interest payment. The reward to exercising is that the stockholders get a
third call option, and so on. Finally, in year 10 the stockholders can exercise the tenth
option. By paying off both the principal and the last year’s interest, the stockholders
regain unencumbered ownership of the company’s assets.
Of course, if the firm does not make any of these payments when due, bond-
holders take over and stockholders are left with nothing. In other words, by not ex-
ercising one call option, stockholders give up all subsequent call options.
Valuing the equity when the 10-year bond is issued is equivalent to valuing the
first of the 10 call options. But you cannot value the first option without valuing
the nine that follow.
28
Even this example understates the practical difficulties, be-
cause large firms may have dozens of outstanding debt issues with different inter-
est rates and maturities, and before the current debt matures they may make fur-
ther issues. But do not lose heart. Computers can solve these problems, more or less
by brute force, even in the absence of simple, exact valuation formulas.
In practice, interest rate differentials tend to be greater than those shown in Fig-
ure 24.9. High-grade corporate bonds typically offer promised yields about 1 per-
centage point greater than U.S. Treasury bonds. It is very difficult to justify yield
688 PART VII
Debt Financing
0
1
2
3
4
5
6
7
8
13
5 7 9 11 13 15 17 19 21 23 25
Maturity,
years
Leverage = 120%
Leverage = 60%
Leverage = 40%
Leverage = 20%
Difference between
promised yield on bond
and risk-free rate, percent
FIGURE 24.9
How the interest rate on
risky corporate debt
changes with leverage and
maturity. These curves are
calculated using option
pricing theory under the
following simplifying
assumptions: (1) the risk-free
interest rate is constant for
all maturities; (2) the
standard deviation of the
returns on the company’s
assets is 25 percent per
annum; (3) debt is in the
form of zero-coupon bonds;
and (4) leverage is the ratio
, where E is the
market value of equity and
D is the face value of the
debt discounted at the risk-
free interest rate.
D/1 D ⫹ E2
28
The other approach to valuing the company’s debt (subtracting the value of a put option from risk-
free bond value) is no easier. The analyst would be confronted by not one simple put but a package of
10 sequential puts.

Brealey−Meyers:
Principles of Corporate
Finance, Seventh Edition
VII. Debt Financing 24. Valuing Debt
© The McGraw−Hill
Companies, 2003
differentials of this magnitude simply in terms of default risk.
29
So what is going
on here? One possibility is that companies are paying too much for their debt, but
it seems likely that the high yields on corporate bonds stem in part from some other
drawback. One possibility is that investors demand additional yield to compensate
for the illiquidity of corporate bonds. There is little doubt that investors prefer
bonds that are easily bought and sold. We can even see small yield differences in
the Treasury bond market, where the latest bonds to have been issued (known as
“on-the-run” bonds) are traded much more heavily and typically yield a few basis
points less than more seasoned issues.
Valuing Government Loan Guarantees
In the summer of 1971 Lockheed Corporation was in trouble. It was nearly out of
cash after absorbing heavy cost overruns on military contracts and, at the same
time, committing more than $800 million
30
to the development of the L1O11 Tri-
Star airliner. After months of suspense and controversy, the U.S. government res-
cued Lockheed by agreeing to guarantee up to $250 million of new bank loans. If
Lockheed had defaulted on these loans, the banks could have gotten their money
back directly from the government.
From the banks’ point of view, these loans were as safe as Treasury notes. Thus,
Lockheed was assured of being able to borrow up to $250 million at a favorable
rate.
31
This assurance in turn gave Lockheed’s banks the confidence to advance the
rest of the money the firm needed.
The loan guarantee was a helping hand—a subsidy—to bring Lockheed
through a difficult period. What was it worth? What did it cost the government?
This loan guarantee did not turn out to cost the government anything, because
Lockheed survived, recovered, and paid off the loans that the government had
guaranteed. Does that mean that the value of the guarantee to Lockheed was also
zero? Does it mean the government absorbed no risks when it gave the guarantee
in 1971, when Lockheed’s survival was still uncertain? Of course not. The govern-
ment absorbed the risk of default. Obviously the banks’ loans to Lockheed were
worth more with the guarantee than they would have been without it.
The present value of a loan guarantee is the amount lenders would be willing to
pay to relieve themselves of all risk of default on an otherwise equivalent unguar-
anteed loan. It is the difference between the present value of the loan with the guar-
antee and its present value without the guarantee. A guarantee can clearly have
substantial value on a large loan when the chance of default by the firm is high.
It turns out that a loan guarantee can be valued as a put on the firm’s assets,
where the put’s maturity equals the loan’s maturity and its exercise price equals
the interest and principal payments promised to lenders. We can easily show the
equivalence by starting with the definition of the value of the guarantee.
Value of
⫽
value of
⫺
loan value without the
guarantee guaranteed loan guarantee
CHAPTER 24
Valuing Debt 689
29
See, for example, J. Huang and M. Huang, “How Much of the Corporate-Treasury Yield is Due to
Credit Risk? Results from a New Calibration Approach,” working paper, Pennsylvania State Univer-
sity, August 2000.
30
See U. Reinhardt, “Break-Even Analysis for Lockheed’s TriStar: An Application of Financial Theory,”
Journal of Finance 28 (September 1973), pp. 821–838.
31
Lockheed paid the current Treasury bill rate plus a fee of roughly 2 percent to the government.
Brealey−Meyers:
Principles of Corporate
Finance, Seventh Edition
VII. Debt Financing 24. Valuing Debt
© The McGraw−Hill
Companies, 2003
Without a guarantee, the loan becomes an ordinary debt obligation of the firm. We
know from Section 20.2 that
The loan’s value, assuming no chance of default, is exactly its guaranteed value;
thus, the put value equals the difference between the values of a guaranteed and
an ordinary loan. This is the value of the loan guarantee.
Thus, option pricing theory should lead to a way of calculating the actual cost
of the government’s many loan guarantee programs. This will be a healthy thing.
The government’s possible liability under existing guarantee programs has been
enormous. In 1987, for example, $4 billion in loans to shipowners had been guar-
anteed under the so-called Title IX program to support shipyards in the United
States.
32
This program was one of dozens. Yet the true cost of these programs is
not widely recognized. Because loan guarantees involve no immediate outlay,
they do not appear in the federal budget. Members of Congress sponsoring loan
guarantee programs do not, as far as we know, present careful estimates of the
value of the programs to business and the present value of the programs’ cost to
the public.
Calculating the Probability of Default
Banks and other financial institutions not only want to know the value of the
loans that they have made but they also need to know the risk that they are in-
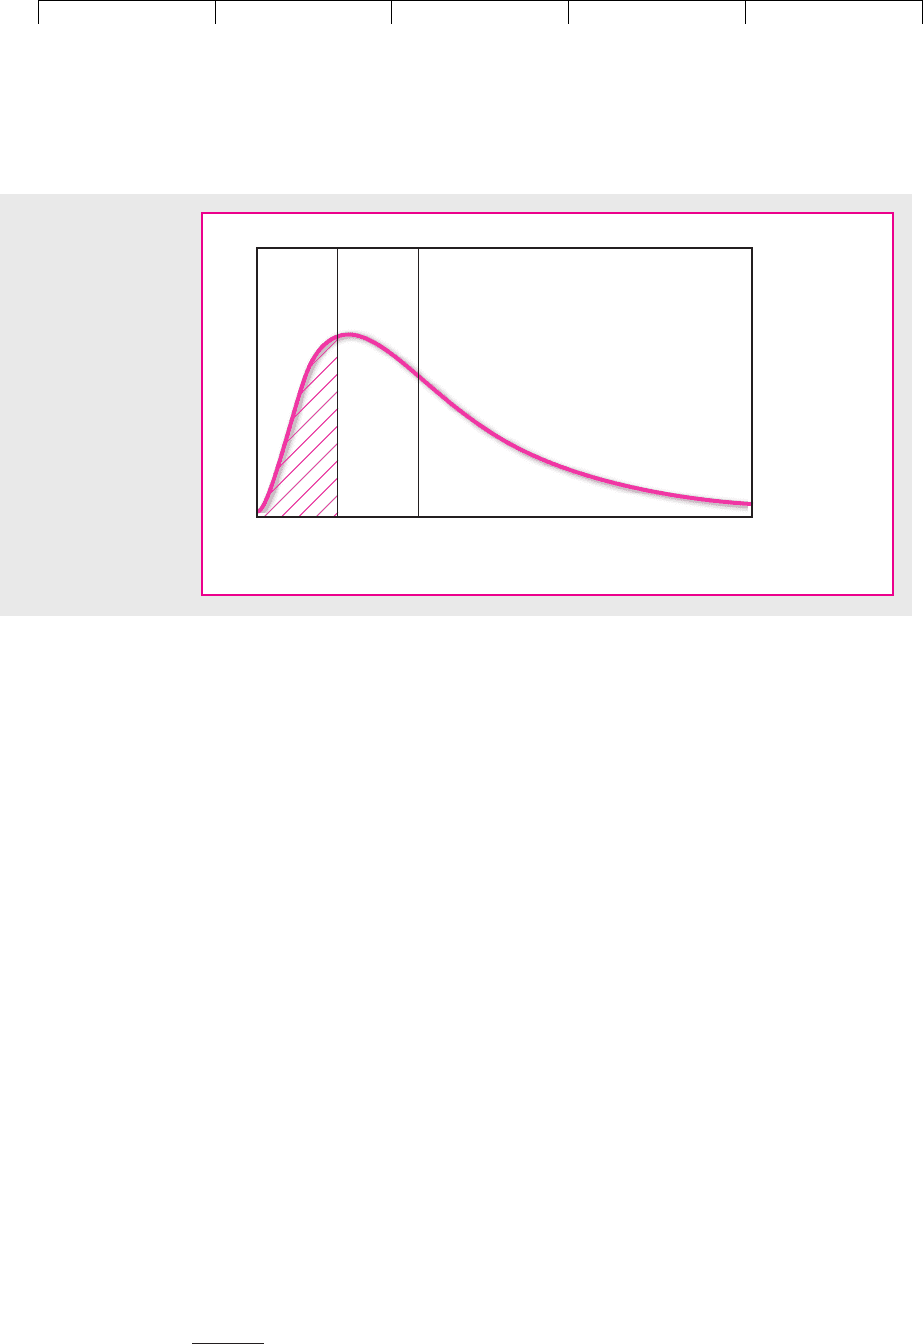
curring. Suppose that the assets of Backwoods Chemical have a current market
value of $100 and its debt has a face value of $60 (i.e., 60 percent leverage), all of
which is due to be repaid at the end of five years. Figure 24.10 shows the range
Value of value assuming
ordinary ⫽ no chance of ⫺ value of put option
loan default
690 PART VII
Debt Financing
32
The actual figure on March 31, 1987, was $4,497,365,297.98. Since 1987 these government guarantees
to shipowners have been substantially reduced.
Default
point
= $60
Expected
value
= $120
Value of assets
Probability
FIGURE 24.10
Backwoods Chemical
has issued five-year
debt with a face value
of $60. The shaded
area shows that there
is a 20 percent proba-
bility that the value of
the company’s assets
in year 5 will be less
than $60, in which
case the company will
choose to default.
Brealey−Meyers:
Principles of Corporate
Finance, Seventh Edition
VII. Debt Financing 24. Valuing Debt
© The McGraw−Hill
Companies, 2003
of possible values of Backwoods’s assets when the loan becomes due. The ex-
pected value of the assets is $120, but this value is by no means certain. There is
a probability of 20 percent that the asset value could fall below $60, in which case
the company will default on its debt. This probability is shown by the shaded
area in Figure 24.10.
To calculate the probability that Backwoods will default, we need to know the
expected growth in the market value of its assets, the face value and maturity of
the debt, and the variability of future asset values. Real-world cases are likely to be
more complex than our Backwoods example. For example, firms may have several
classes of debt maturing on different dates. If so, shareholders have an option on
an option. It may be worth their while to put up more money to pay off the short-
term debt and thus keep alive the chance that the firm’s fortunes will recover be-
fore the rest of the debt becomes due.
However, banks and consulting firms are now finding that they can use
these ideas to measure the risk of actual loans.
33
For example, by mid-2001 the
fiber-optics company, Metromedia Fiber Network, was a company in difficul-
ties. Revenues had expanded rapidly, but so had losses. By 2000 the company
was making operating losses of $329 million on revenues of $188 million. The
stock price had fallen from a high of $50 to under $2, while the company’s
8-year 10 percent notes were priced at 44 percent and offered a yield to matu-
rity of 27 percent.
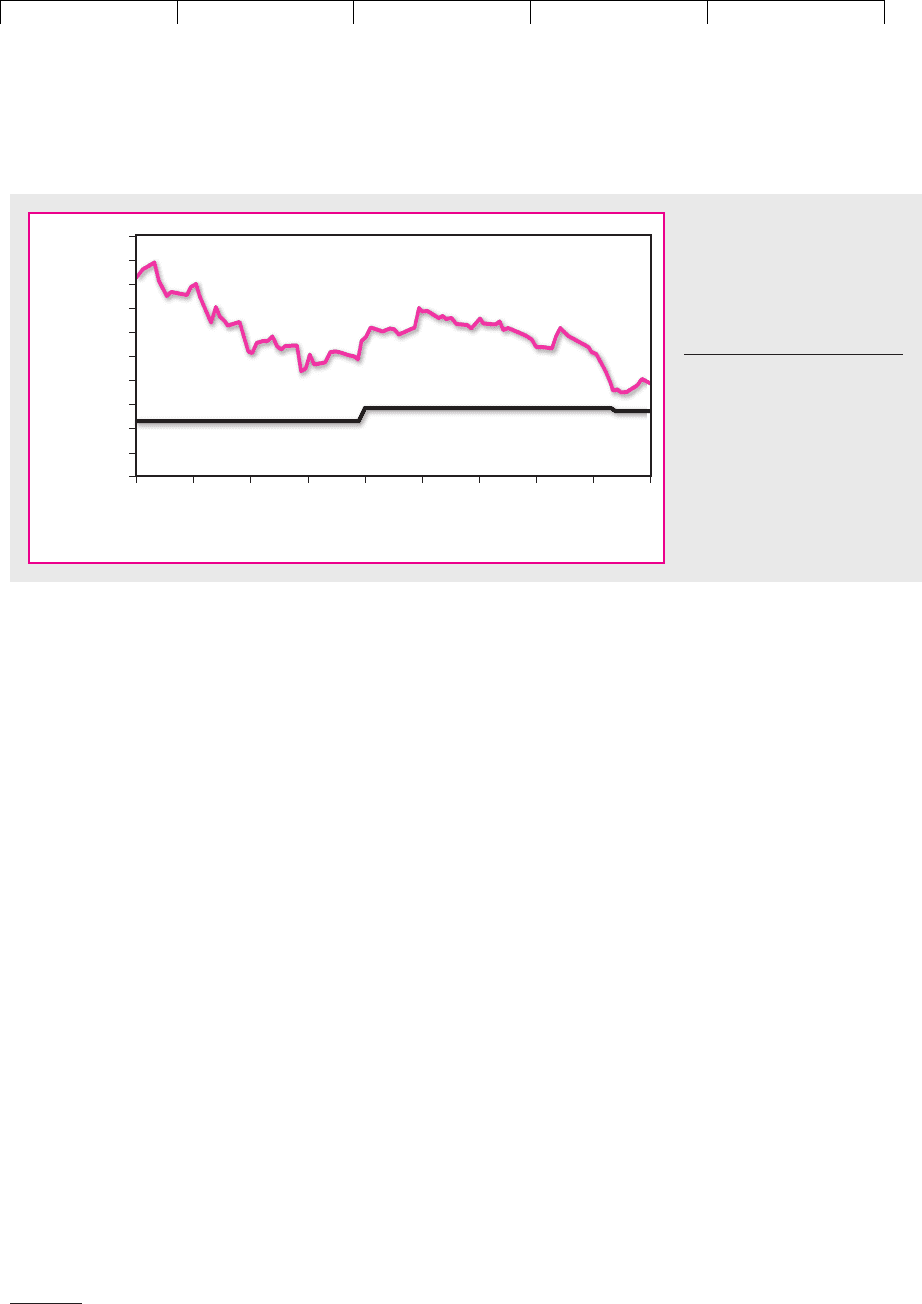
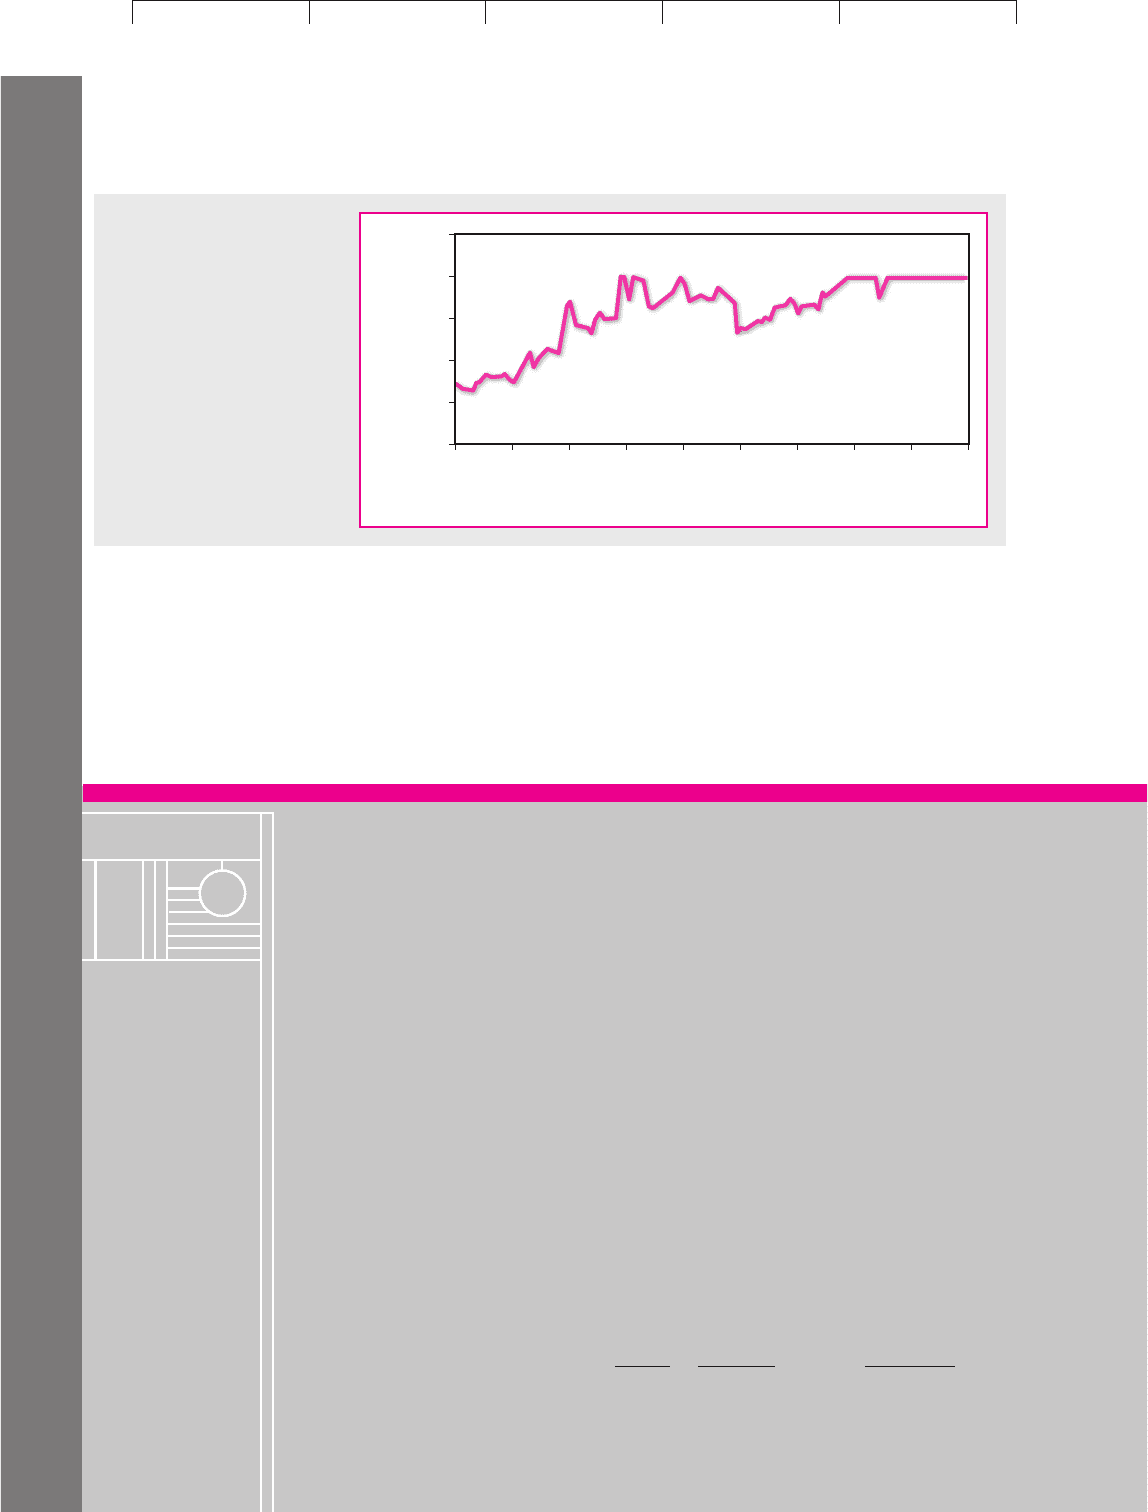
How close was Metromedia to default? Figure 24.11 provides an answer. The
burgundy line shows the market value of Metromedia’s assets, and the blue line
shows the asset value at which the company would choose to default on its debts.
You can see that during the first half of 2001 the value of the company’s assets crept
closer and closer to the default point.
CHAPTER 24
Valuing Debt 691
33
Banks are not just interested in the risk of individual loans; they would also like to know the risk of
their entire portfolio. Therefore, specialists in credit risk also need to recognize the correlation between
the outcomes. A portfolio of loans, all of which are to factory outlets in suburban Hicksville, is likely to
be more risky than a portfolio with a wide variety of different borrowers.
0
1000
2000
3000
4000
5000
6000
7000
8000
9000
10000
Value, $ millions
Market value of assets
Default point
22/02/01
08/03/01
22/03/01
05/04/01
19/04/01
03/05/01
17/05/01
31/05/01
14/06/01
28/06/01
FIGURE 24.11
The market value of the
assets of Metromedia Fiber
Network crept closer to the
point at which the firm would
choose to default.
Source: KMV Credit Monitor.
Brealey−Meyers:
Principles of Corporate
Finance, Seventh Edition
VII. Debt Financing 24. Valuing Debt
© The McGraw−Hill
Companies, 2003
692 PART VII Debt Financing
Of course, nobody had a crystal ball that could foresee what would happen to
Metromedia, but KMV, a consulting firm specializing in the assessment of credit
risk, estimated the probability at each point that the company would default in the
next year. Figure 24.12 shows how KMV progressively increased its assessment of
the probability of default.
0
5
10
15
20
25
Probability of default over
next year, percent
22/02/01
08/03/01
22/03/01
05/04/01
19/04/01
03/05/01
17/05/01
31/05/01
14/06/01
28/06/01
FIGURE 24.12
Estimates by KMV Credit
Monitor of the probability that
Metromedia Fiber Network
would default on its debt
within a year.
SUMMARY
Visit us at www.mhhe.com/bm7e
Efficient debt management presupposes that you understand how bonds are val-
ued. That means you need to consider three problems:
1. What determines the general level of interest rates?
2. What determines the difference between long-term and short-term rates?
3. What determines the difference between the interest rates on company and gov-
ernment debt?
Here are some things to remember. The rate of interest depends on the demand
for savings and the supply. The demand comes from firms who wish to invest in
new plant and equipment. The supply of savings comes from individuals who are
willing to consume tomorrow rather than today. The equilibrium interest rate is the
rate that produces a balance between the demand and supply.
The best-known theory about the effect of inflation on interest rates was sug-
gested by Irving Fisher. He argued that the nominal, or money, rate of interest is
equal to the expected real rate plus the expected inflation rate. If the expected in-
flation rate increases by 1 percent, so too will the money rate of interest. During the
past 50 years Fisher’s simple theory has not done a bad job of explaining changes
in short-term interest rates in the United States.
The value of any bond is equal to the cash payments discounted at the spot
rates of interest. For example, the value of a 10-year bond with a 5 percent
coupon equals
PV1percent of face value2⫽
5
1 ⫹ r
1
⫹
5
11 ⫹ r
2
2
2
⫹
…
⫹
105
11 ⫹ r
10
2
10

Brealey−Meyers:
Principles of Corporate
Finance, Seventh Edition
VII. Debt Financing 24. Valuing Debt
© The McGraw−Hill
Companies, 2003
CHAPTER 24 Valuing Debt 693
Bond dealers generally look at the yield to maturity on a bond. This is simply
the internal rate of return y, the discount rate at which
The yield to maturity y is a complex average of the spot interest rates r
1
, r
2
, etc.
Like most averages it can be a useful summary measure, but it can also hide a lot
of interesting information. We suggest you refer to yields on stripped bonds as
measures of the spot rates of interest.
When you invest in a bond you usually receive a regular interest payment and
then the final principal payment. Duration measures the average time to each pay-
ment. It is a useful summary measure of the length of a loan. It is also important
because there is a direct relationship between the duration of a bond and its volatil-
ity. A change in interest rates has a greater effect on the price of a bond with a longer
duration.
The one-period spot rate may be very different from the two-period spot rate
. In other words, investors often want a different annual rate of interest for lend-
ing for one year than for two years. Why is this? The expectations theory says that
bonds are priced so that the expected rate of return from investing in bonds over
any period is independent of the maturity of the bonds held by the investor. The
expectations theory predicts that will exceed only if next year’s one-period in-
terest rate is expected to rise.
The expectations theory cannot be a complete explanation of the term structure
if investors are worried about risk. Long bonds may be a safe haven for investors
with long-term fixed liabilities. But other investors may not like the extra volatility
of long-term bonds and may be concerned that a sudden burst in inflation could
largely wipe out the real value of these bonds. Such investors will be prepared to
hold long-term bonds only if they offer a liquidity premium—that is, a higher rate
of interest.
Finally, we come to our third question: What determines the difference between
interest rates on company and government debt? Company debt sells at a lower
price than government debt. This discount represents the value of the company’s
option to default. We showed you how the value of this option varies with the de-
gree of leverage and the time to maturity.
Ratings are widely used as a guide to the risk of loans. However, banks and con-
sulting firms also recognize that the option to default is a put option and they have
been developing models to estimate the probability that the borrower will exercise
its option to default.
r
1
r
2
r
2
r
1
Bond price ⫽
5
1 ⫹ y
⫹
5
11 ⫹ y2
2
⫹
…
⫹
105
11 ⫹ y2
10
FURTHER
READING
A good general text on debt markets is:
A. Sundaresan and S. Sundaresan: Fixed Income Markets and Their Derivatives, South-Western
College Publishing, Cincinnati, Ohio, 2nd ed., 2001.
Nelson provides a useful review of some of the standard theories of the term structure literature:
C. R. Nelson: “The Term Structure of Interest Rates: Theories and Evidence,” in J. L. Bick-
sler (ed.), Handbook of Financial Economics, North-Holland Publishing Company, Ams-
terdam, 1980.
Visit us at www.mhhe.com/bm7e