Brealey, Myers. Principles of Corporate Finance. 7th edition
Подождите немного. Документ загружается.

Brealey−Meyers:
Principles of Corporate
Finance, Seventh Edition
VI. Options 22. Real Options
© The McGraw−Hill
Companies, 2003
rather than to invest, even when project NPV is positive.
6
This explains why man-
agers are sometimes reluctant to commit to positive-NPV projects. This caution is
rational as long as the option to wait is open and sufficiently valuable.
Valuing the Malted Herring Option
Figure 22.2 shows the possible cash flows and end-of-year values for the malted
herring project. If you commit and invest $180 million, you have a project worth
$200 million. If demand turns out to be low in year 1, the cash flow is only $16 mil-
lion and the value of the project falls to $160 million. But if demand is high in year
1, the cash flow is $25 million and value rises to $250 million. Although the project
lasts indefinitely, we assume that investment cannot be postponed beyond the end
of the first year, and therefore we show only the cash flows for the first year and
the possible values at the end of the year. Notice that if you undertake the invest-
ment right away, you capture the first year’s cash flow ($16 million or $25 million);
if you delay, you miss out on this cash flow, but you will have more information on
how the project is likely to work out.
We can use the binomial method to value this option. The first step is to pretend
that investors are risk neutral and to calculate the probabilities of high and low de-
mand in this risk-neutral world. If demand is high in the first year, the malted her-
ring plant has a cash flow of $25 million and a year-end value of $250 million. The
total return is , or 37.5 percent. If demand is low, the
plant has a cash flow of $16 million and a year-end value of $160 million. Total re-
turn is , or percent. In a risk-neutral world, the ex-
pected return would be equal to the interest rate, which we assume is 5 percent:
Therefore the (pretend) probability of high demand is 34.3 percent.
Expected
return
⫽ a
Probability of
high demand
b⫻ 37.5 ⫹ a
1 ⫺ probability of
high demand
b⫻ 1⫺122⫽ 5%
⫺12116 ⫹ 1602/200 ⫺ 1 ⫽⫺.12
125 ⫹ 2502/200 ⫺ 1 ⫽ .375
CHAPTER 22
Real Options 623
6
We have been a bit vague about forecasted project cash flows. If competitors can enter and take away
cash that you could have earned, the meaning is clear. But what about the decision to, say, develop an
oil well? Here delay doesn’t waste barrels of oil in the ground; it simply postpones production and the
associated cash flow. The cost of waiting is the decline in today’s present value of revenues from pro-
duction. Present value declines if the future rate of increase in oil prices is not sufficiently high, that is,
if the discounted price of oil is less than the current price.
Now 200 (NPV = 200 – 180 = 20)
Year 1 160
= 25
Cash flow
(0)
250
(250 – 180 = 70)
(?)
Cash flow
= 16
FIGURE 22.2
Possible cash flows and end-of-period values for the malted
herring project are shown in blue. The project costs $180
million, either now or later. The burgundy figures in paren-
theses show payoffs from the option to wait and to invest
later if the project is positive-NPV at year 1. Waiting means
loss of the first year’s cash flows. The problem is to figure
out the current value of the option.

Brealey−Meyers:
Principles of Corporate
Finance, Seventh Edition
VI. Options 22. Real Options
© The McGraw−Hill
Companies, 2003
We want to value a call option on the malted herring project with an exercise price
of $180 million. We begin as usual at the end and work backward. The bottom row
of Figure 22.2 shows the possible values of this option at the end of the year. If proj-
ect value is $160 million, the option to invest is worthless. At the other extreme, if
project value is $250 million, option value is million.
To calculate the value of the option today, we work out the expected payoffs in
a risk-neutral world and discount at the interest rate of 5 percent. Thus, the value
of your option to invest in the malted herring plant is
But here is where we need to recognize the opportunity to exercise the option im-
mediately. The option is worth $22.9 million if you keep it open, and it is worth the
project’s immediate NPV if exercised now. Thus the fact
that the malted herring project has a positive NPV is not sufficient reason for in-
vesting. There is a still better strategy: Wait and see.
Optimal Timing for Real Estate Development
Sometimes it pays to wait for a long time, even for projects with large positive NPVs.
Suppose you own a plot of vacant land in the suburbs.
7
The land can be used for a
hotel or an office building, but not for both. A hotel could be later converted to an of-
fice building, or an office building to a hotel, but only at significant cost. You are
therefore reluctant to invest, even if both investments have positive NPVs.
In this case you have two options to invest, but only one can be exercised. You
therefore learn two things by waiting. First, you learn about the general level of
cash flows from development, for example, by observing changes in the value of
developed properties near your land. Second, you can update your estimates of the
relative size of the hotel’s future cash flows versus the office building’s.
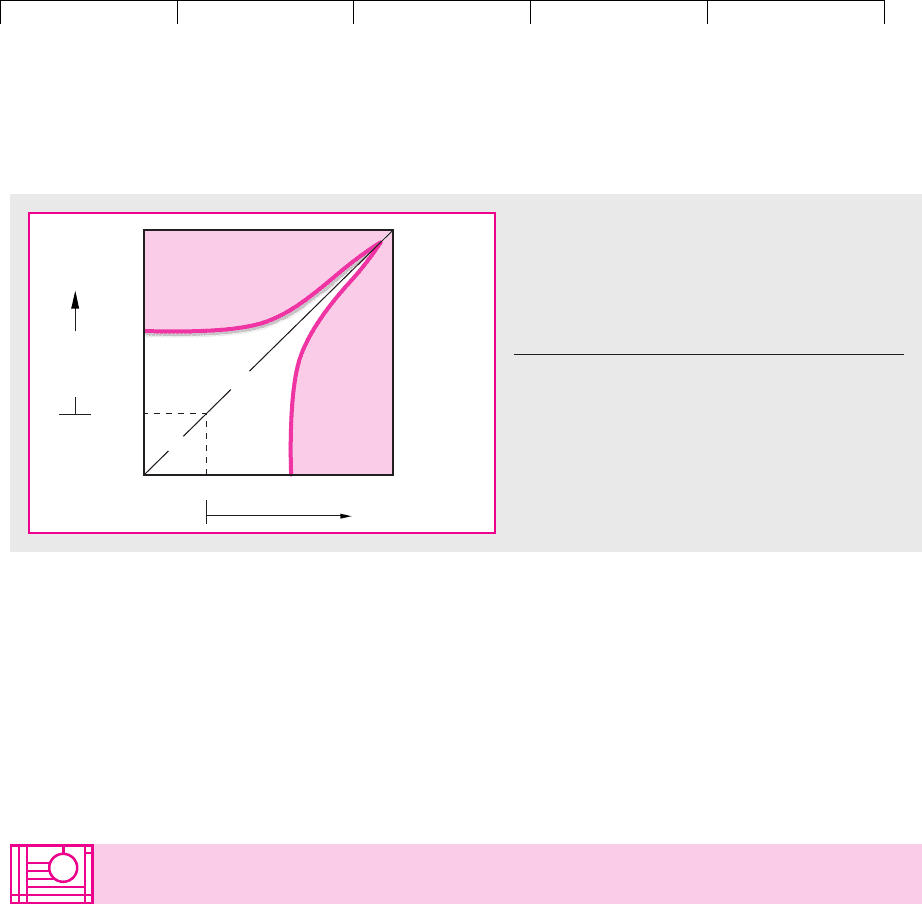
Figure 22.3 shows the conditions in which you would finally commit to build ei-
ther the hotel or the office building. The horizontal axis shows the current cash
flows that a hotel would generate. The vertical axis shows current cash flows for
an office building. For simplicity, we will assume that each investment would have
NPV of exactly zero at current cash flow of 100. Thus, if you were forced to invest
today, you would choose the building with the higher cash flow, assuming the cash
flow is greater than 100. (What if you were forced to decide today and each build-
ing could generate the same cash flow, say, 150? You would flip a coin.)
If the two buildings’ cash flows plot in the colored area at the lower right of Fig-
ure 22.3, you build the hotel. To fall in this area, the hotel’s cash flows have to beat
two hurdles. First, they must exceed a minimum level of about 240. Second, they
must exceed the office building’s cash flows by a sufficient amount. If the situation
is reversed, with office building cash flows above the minimum level of 240, and
also sufficiently above the hotel’s, then you build the office building. In this case,
the cash flows plot in the colored area at the top left of the figure.
Notice how the “Delay development” region extends upward along the 45-
degree line in Figure 22.3. When the cash flows from the hotel and office building
are nearly the same, you become very cautious before choosing one over the other.
1200 ⫺ 180 ⫽ $20
million2
1.343 ⫻ 702⫹ 1.657 ⫻ 02
1.05
⫽ $22.9 million
250 ⫺ 180 ⫽ $70
624 PART VI Options
7
The following example is based on P. D. Childs, T. J. Riddiough, and A. J. Triantis, “Mixed Uses and
the Redevelopment Option,” Real Estate Economics 24 (Fall 1996), pp. 317–339.
Brealey−Meyers:
Principles of Corporate
Finance, Seventh Edition
VI. Options 22. Real Options
© The McGraw−Hill
Companies, 2003
You may be surprised at how high cash flows have to be in Figure 22.3 to justify
investment. There are three reasons. First, building the office building means not
building the hotel, and vice versa. Second, the calculations underlying Figure 22.3
assumed cash flows that were small, but growing; therefore, the costs of waiting to
invest were small. Third, the calculations did not consider the threat that someone
might build a competing hotel or office building right next door. In that case the
“relax and wait” area of Figure 22.3 would shrink dramatically.
CHAPTER 22
Real Options 625
100 240
Wait
NPV<0
100
240
Office
Building's
NPV>0
Cash flow
from office
building
Build office
building
Build
hotel
Cash flow
from hotel
Hotel's NPV>0
FIGURE 22.3
Development option for vacant land, assuming two
mutually exclusive uses, either hotel or office
building. The developer should “wait and see” unless
the hotel’s and office building’s cash flows end up in
one of the shaded areas.
Source: Adapted from Figure 1 in P. D. Childs, T. J.
Riddiough, and A. J. Triantis, “Mixed Uses and the Redevel-
opment Option,” Real Estate Economics 24 (Fall 1996),
pp. 317–339.
22.3 THE ABANDONMENT OPTION
Expansion value is important. When investments turn out well, the quicker and
easier the business can be expanded, the better. But suppose bad news arrives, and
cash flows are far below expectations. In that case it is useful to have the option to
bail out and recover the value of the project’s plant, equipment, or other assets. The
option to abandon is equivalent to a put option. You exercise that abandonment op-
tion if the value recovered from the project’s assets is greater than the present value
of continuing the project for at least one more period.
The binomial method is tailor-made for most abandonment options. Here is an
example.
The Zircon Subductor Project
Dawn East, the chief financial officer of Maine Subductor Corp., has to decide
whether to start production of zircon subductors. The investment required is $12
million— $2 million for roads and site preparation and $10 million for equipment.
The equipment costs $700,000 per year ($.7 million) to operate (a fixed cost). For
simplicity, we will ignore other costs and taxes.
At today’s prices, the project would generate revenues of $1.7 million per year.
Annual output will be constant, so revenue is proportional to price. If the mine
were operating today, cash flow would be million.$1.7 ⫺ .7 ⫽ $1.0

Brealey−Meyers:
Principles of Corporate
Finance, Seventh Edition
VI. Options 22. Real Options
© The McGraw−Hill
Companies, 2003
Calculate the Present Value of the Project The first step in a real options
analysis is to value the underlying asset, that is, the project if it had no options
attached. Usually this is done by discounted cash flow (DCF). In this case the
chief source of uncertainty is the future selling price of zircon subductors. There-
fore Ms. East starts by calculating the present value of future revenues. She
notes a strong upward trend in subductor prices, and ends up forecasting an-
nual growth at 9 percent for the next 10 years. Fixed costs are constant at $.7 mil-
lion. The top panel of Figure 22.4 shows these cash-flow forecasts and calculates
present values: $17 million for revenues, after discounting at a risk-adjusted rate
of 9 percent, and $5.15 million for fixed costs, after discounting at a risk-free rate
of 6 percent.
8
The NPV of the project, assuming no salvage value or abandon-
ment over its 10-year life, is
This NPV is slightly negative, but Ms. East has so far made no provision for
abandonment.
⫽ $17.00 ⫺ 5.15 ⫺ 12.00 ⫽⫺$.15 million
NPV ⫽ PV1revenues2⫺ PV1fixed costs2⫺ investment required
626 PART VI
Options
0
$17.00
$5.15
-0.15
13.84
1
1.85
0.70
1.26
14.91
0.78
10.73
9.00
2
2.02
0.70
1.55
15.83
1.00
11.47
0.59
8.49
8.10
3
2.20
0.70
1.89
16.51
1.26
12.10
0.78
8.83
7.29
4
2.40
0.70
2.27
16.86
1.55
12.51
1.00
9.23
0.59
6.95
6.56
5
2.62
0.70
2.72
16.75
1.89
12.58
1.26
9.43
0.78
7.09
5.90
6
2.85
0.70
3.23
16.07
2.27
12.23
1.55
9.33
1.00
7.14
0.59
5.60
5.31
7
3.11
0.70
3.82
14.62
2.72
11.31
1.89
8.81
1.26
6.92
0.78
5.50
4.78
8
3.39
0.70
4.50
12.22
3.23
9.68
2.27
7.77
1.55
6.32
1.00
5.22
0.59
4.43
4.30
9
3.69
0.70
5.28
8.61
3.82
7.15
2.72
6.05
1.89
5.21
1.26
4.58
0.78
4.11
3.87
10
4.02
0.70
6.18
3.49
4.50
3.49
3.23
3.49
2.27
3.49
1.55
3.49
1.00
3.49
0.59
3.49
3.49
0.27
6.56
0.15
5.90
0.27
5.31
0.03
5.31
0.15
4.78
-0.06
4.78
0.27
4.30
0.03
4.30
-0.14
4.30
0.15
3.87
-0.06
3.87
-0.22
3.87
0.27
3.49
0.03
3.49
-0.14
3.49
-0.28
3.49
Year
Forecasted revenues
Present value
Fixed costs
Present value
NPV
Cash flow
Present value
Salvage value (years 1–10)
0.42
7.29
0.42
5.90
0.42
4.78
0.42
3.87
FIGURE 22.4
Binomial tree for the
Subductor project.
Cash flow (top number)
and end-of-period
present value are
shown for each node in
millions of dollars.
Abandonment occurs if
cash flows drop to $.42
million (lighter shaded
nodes) in years 3, 5, 7,
or 9, and in year 10.
Beginning present
value is $ 13.84 million.
8
Why calculate present values for revenues and fixed costs separately? Because it’s easier to construct
a binomial tree for revenues, which can be assumed to follow a random walk with constant standard
deviation. We will subtract fixed costs after the binomial tree is constructed.

Brealey−Meyers:
Principles of Corporate
Finance, Seventh Edition
VI. Options 22. Real Options
© The McGraw−Hill
Companies, 2003
Build a Binomial Tree Now Ms. East constructs a binomial tree for revenues and
PV(revenues). She notes that subductor prices have followed a random walk with
an annual standard deviation of about 14 percent. She constructs a binomial tree
with one step per year. The “up” values for revenues are 115 percent of the prior
year’s revenues. The “down” values are 87 percent of prior revenues.
9
Thus, the up
and down revenues for year 1 are and
million, respectively.
10
After deduction of fixed costs, the up and down cash flows
are $1.26 and $.78 million, respectively. The first two years of the resulting tree are
shown below (figures in millions of dollars).
$1.70 ⫻ .87 ⫽ $1.48$1.70 ⫻ 1.15 ⫽ $1.96
CHAPTER 22
Real Options 627
9
The formula (given in Section 21.2) for the up percentage is where is the standard deviation
per year and h is the interval as a fraction of a year. In this case, and . The down
value is .
10
We do not build the 9 percent forecasted growth rate into the up and down steps of the tree. However,
the “up” probabilities will be greater than the “down” probabilities, enough greater that the present
value of next period’s revenue will equal this year’s revenue, using a risk-free discount rate of 6 per-
cent. In other words, the tree will assume a 6 percent risk-neutral expected growth rate.
d ⫽ 1/u ⫽ .87
e
⫽ e
.14
⫽ 1.15h ⫽ 1
u ⫽ e
2h
2.25
1.71.7
1.29
1.96
1.48
1.55
1.01.0
.59
1.26
.78
Figure 22.4 shows the whole tree, starting with cash flows in year 1. (Maine Sub-
ductor can’t generate any revenues in year 0 because it hasn’t started production
yet.) The top number at each node is cash flow. The bottom number (in burgundy)
is the end-of-year present value of all subsequent cash flows, including the value of
the production equipment when the project ends or is abandoned. We will see in a
moment how these present values are calculated.
Finally, Ms. East calculates the risk-neutral probabilities of up and down
changes in revenues, p and , respectively. If the risk-free interest rate is 6 per-
cent, and :
Solve for Optimal Abandonment and Project Value Ms. East has assumed a proj-
ect life of 10 years. At that time the production equipment, which normally depre-
ciates by about 10 percent per year, should be worth $3.49 million. This salvage
value represents what the equipment could be sold for, or its value to Maine Sub-
ductor if shifted to another use. Forecasted salvage values are shown year-by-year
at the bottom of Figure 22.4.
Now let’s calculate this project’s value in the binomial tree. We start at the far
right of Figure 22.4 (year 10) and work back to the present. The company will
Probability of down change ⫽ 1 ⫺ p ⫽ .3209
Probability of up change ⫽ p ⫽ .6791
Expected return ⫽ .15p ⫺ .1311 ⫺ p2⫽ .06
1 ⫺ p ⫽ .3209p ⫽ .6791
1 ⫺ p
Revenues Cash Flow (Revenue, less fixed costs)

Brealey−Meyers:
Principles of Corporate
Finance, Seventh Edition
VI. Options 22. Real Options
© The McGraw−Hill
Companies, 2003
abandon for sure in year 10, when the ore body is exhausted. Thus we enter the
ending salvage value ($3.49 million) as the end-of-year value in year 10. Then we
step back to year 9.
Suppose that Maine Subductor ends up in the best possible place in that year,
where cash flow is $5.28 million. The upside payoff if the company does not
abandon is the “up” node in year 10: million. The downside
payoff is million. The present value, using the risk-neutral
probabilities, is
The company could abandon at the end of year 9, realizing salvage value of $3.87
million, but continuing is better. We therefore enter $8.61 million as the end-of-year
value at the top node for year 9 in Figure 22.4.
We can fill in the end-of-period values for the other nodes in year 9 by the same
procedure. But at some point, as we step down to lower and lower cash flows, there
will come a node where it’s better to bail out than continue. This occurs when cash
flow is $.42 million. The present value of continuing is only
The payoff to abandonment is $3.87 million, so that payoff is entered as the value
in year 9 at all nodes with cash flows equal to or less than $.42 million.
The cash flows and end-of-year values for year 9 are the payoffs to continuing
from year 8. We then calculate values in year 8, checking at each node whether to
abandon, for year 7, and so on back to year zero.
11
In this example, Maine Subduc-
tor should abandon the project in any year when cash flows fall to $.42 million. This
means that it never encounters cash flows less than $.42 million.
The present value at year 0 is $13.84 million, so the project is worthwhile:
million.
How much of this NPV is due to abandonment value?
12
The DCF valuation at
the top of Figure 22.4 (which ignores salvage and abandonment) gives NPV of
million, a drop of $1.99 million from the NPV with abandonment. Therefore,
the value of the abandonment put is $1.99 million:
13
The project looks good, although Ms. East may wish to check out the timing op-
tion. She could decide to wait.
⫽⫺.15 ⫹ 1.99 ⫽ $1.84 million
APV ⫽ NPV,
no abandonment ⫹ value of abandonment option
⫺$.15
NPV ⫽ 13.84 ⫺ 12.00 ⫽⫹$1.84
PV ⫽
.6791 ⫻ 1.59 ⫹ 3.492⫹ .3209 ⫻ 1.27 ⫹ 3.492
1.06
⫽ $3.75 million
PV ⫽
1.6791 ⫻ 9.672⫹ 1.3209 ⫻ 7.992
1.06
⫽ $8.61 million
4.50 ⫹ 3.49 ⫽ $7.99
6.18 ⫹ 3.49 ⫽ $9.67
628 PART VI Options
11
We will spare you the calculations. You can check them, however. The spreadsheet for Figure 22.4 is
on this book’s website (www.mhhe.com/bm7e).
12
You could also revalue the binomial tree with all salvage values set to zero. The present value in year
0 then falls to $11.85 million, implying million. You can do this calcu-
lation in the spreadsheet program on the website. Just set “Salvage ” equal to zero.
13
It turns out, however, that the value of early abandonment in this example is relatively small. Sup-
pose that Maine Subductor could recover salvage value of $3.49 million in year 10, but not before. The
present value of this recovery in year 0, using a 6 percent discount rate, is $1.95 million. APV in this
case is million, only slightly less than the APV of $1.85 with early abandonment
allowed.
⫺.15 ⫹ 1.95 ⫽ $1.8
t ⫽ 0
NPV ⫽ $11.85 ⫺ 12.00 ⫽⫺$.15

Brealey−Meyers:
Principles of Corporate
Finance, Seventh Edition
VI. Options 22. Real Options
© The McGraw−Hill
Companies, 2003
Abandonment Value and Project Life
Ms. East assumed that the zircon subductor project had a definite 10 year life. But
most projects’ economic lives are not known at the start. Cash flows from a new
product may last only a year or so if the product fails in the marketplace. But if it
succeeds, that product, or variations or improvements of it, could be produced for
decades.
A project’s economic life can be just as hard to predict as the project’s cash flows.
Yet in standard DCF capital-budgeting analysis, that life is assumed to end at a
fixed future date. Real options analysis allows us to relax that assumption. Here is
the procedure.
14
1. Forecast the range of possible cash flows well beyond your best guess of the
project’s economic life. Suppose, for example, that your guess is 10 years.
You could prepare a binomial tree like Figure 22.4 stretching out 25 years
into the future.
2. Then value the project, including its abandonment value. In the best upside
scenarios, project life will be 25 years—it will never make sense to abandon
before year 25. In the worst downside scenarios, project life will be much
shorter, because the project will be more valuable dead than alive. If your
original guess about project life is right, then in intermediate scenarios,
where actual cash flows match expectations, abandonment will occur
around year 10.
This procedure links project life to the performance of the project. It does not im-
pose an arbitrary ending date, except in the far distant future.
Temporary Abandonment
Companies are often faced with complex options that allow them to abandon a
project temporarily, that is, to mothball it until conditions improve. Suppose you
own an oil tanker operating in the short-term spot market. (In other words, you
charter the tanker voyage by voyage, at whatever short-term charter rates prevail
at the start of the voyage.) The tanker costs $5 million a year to operate and at cur-
rent tanker rates it produces charter revenues of $5.25 million per year. The tanker
is therefore profitable but scarcely cause for celebration. Now tanker rates dip by
about 10 percent, forcing revenues down to $4.7 million. Do you immediately lay
off the crew and mothball the tanker until prices recover? The answer is clearly yes
if the tanker business can be turned on and off like a faucet. But that is unrealistic.
There is a fixed cost to mothballing the tanker. You don’t want to incur this cost
only to regret your decision next month if rates rebound to their earlier level. The
higher the costs of mothballing and the more variable the level of charter rates, the
greater the loss that you will be prepared to bear before you call it quits and lay up
the boat.
Suppose that eventually you do decide to take the boat off the market. You lay
up the tanker temporarily.
15
Two years later your faith is rewarded; charter rates
rise, and the revenues from operating the tanker creep above the operating cost of
CHAPTER 22
Real Options 629
14
See S. C. Myers and S. Majd, “Abandonment Value and Project Life,” in F. J. Fabozzi (ed.), Advances in
Futures and Options Research, JAI Press, 1990.
15
We assume it makes sense to keep the tanker in mothballs. If rates fall sufficiently, it will pay to scrap
the tanker.
Brealey−Meyers:
Principles of Corporate
Finance, Seventh Edition
VI. Options 22. Real Options
© The McGraw−Hill
Companies, 2003
$5 million. Do you reactivate immediately? Not if there are costs to doing so. It
makes more sense to wait until the project is well in the black and you can be fairly
confident that you will not regret the cost of bringing the tanker back into operation.
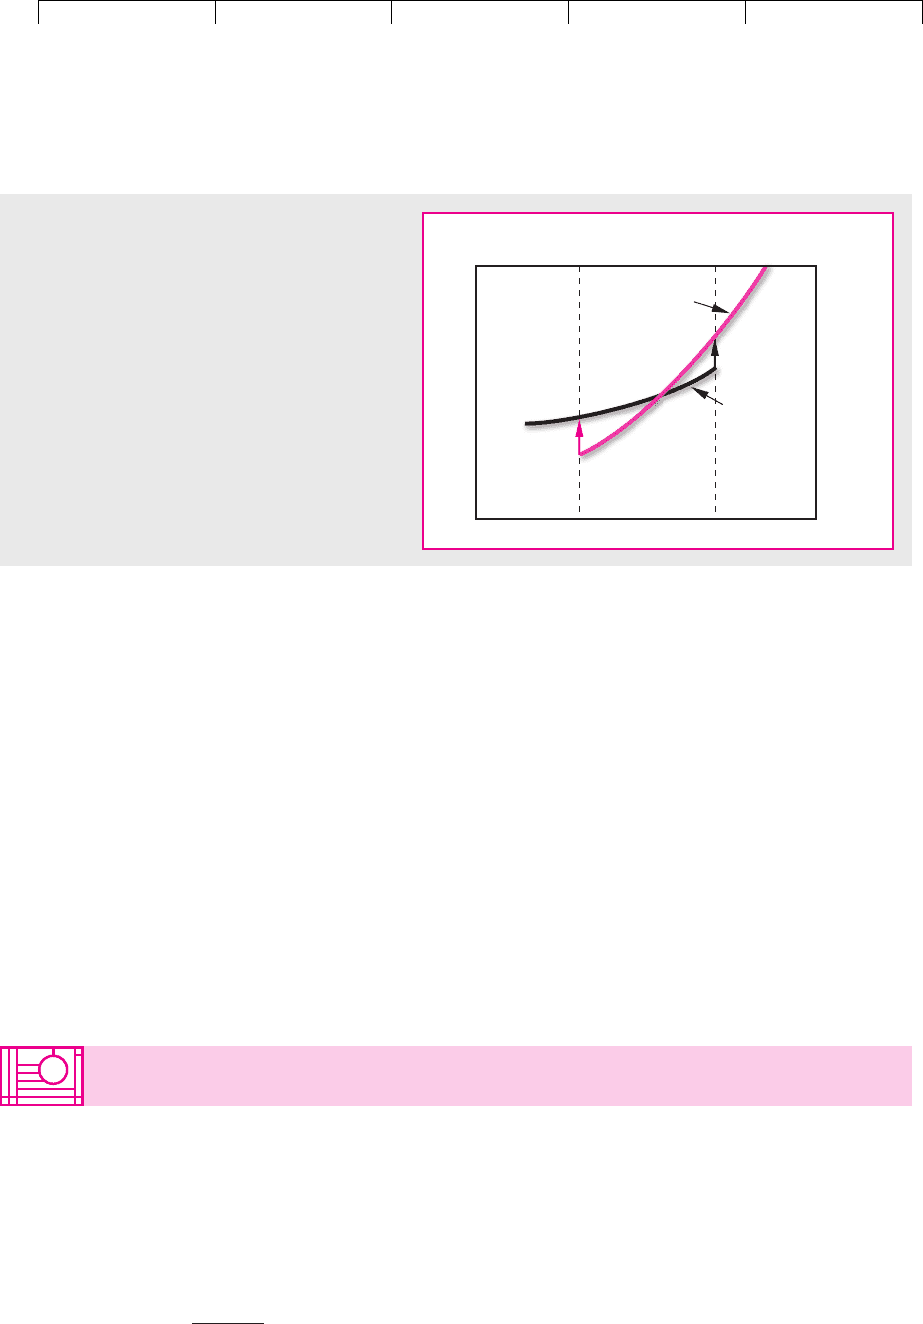
These choices are illustrated in Figure 22.5. The colored line shows how the
value of an operating tanker varies with the level of charter rates. The black line
shows the value of the tanker when mothballed.
16
The level of rates at which it
pays to mothball is given by M and the level at which it pays to reactivate is given
by R. The higher the costs of mothballing and reactivating and the greater the vari-
ability in tanker rates, the further apart these points will be. You can see that it will
pay for you to mothball as soon as the value of a mothballed tanker reaches the
value of an operating tanker plus the costs of mothballing. It will pay to reactivate
as soon as the value of a tanker that is operating in the spot market reaches the
value of a mothballed tanker plus the costs of reactivating. If the level of rates falls
below M, the value of the tanker is given by the black line; if the level is greater
than R, value is given by the colored line. If rates lie between M and R, the tanker’s
value depends on whether it happens to be mothballed or operating.
630 PART VI
Options
16
Dixit and Pindyck estimate these thresholds for a medium-sized tanker and show how they depend
on costs and the volatility of freight rates. See A. K. Dixit and R. S. Pindyck, Investment under Uncertainty,
Princeton University Press, Princeton, NJ, 1994, Chapter 7.
Value in
operation
Cost of
reactivating
Value if
mothballed
Mothballing
costs
Value
of tanker
Tanker
rates
MR
FIGURE 22.5
An oil tanker should be mothballed when tanker
rates fall to M, where the tanker’s value if moth-
balled is enough above its value in operation to
cover mothballing costs. The tanker is reactivated
when rates recover to R.
22.4 FLEXIBLE PRODUCTION—AND ANOTHER LOOK
AT AIRCRAFT PURCHASE OPTIONS
Companies often have an option to vary either the inputs in the production process
or the outputs. For example, an electric utility plant may be designed to operate on
either oil or natural gas. Or a manufacturer may invest in computer-integrated
manufacturing (CIM) systems that allow it to vary the production mix.
In such cases the firm has the option to acquire one asset in exchange for an-
other. Consider the electric utility’s decision to build an oil-fired generating plant
that can be converted to run on natural gas. You can think of the utility as having

Brealey−Meyers:
Principles of Corporate
Finance, Seventh Edition
VI. Options 22. Real Options
© The McGraw−Hill
Companies, 2003
an option to “buy” a gas-fired plant in exchange for the oil-fired plant. If oil prices
were certain, this would be a simple call option on a gas-fired plant with a fixed ex-
ercise price (the value of an oil-fired plant plus the cost of conversion). If the price
of gas is sufficiently low, it pays to exercise the option and switch to gas.
In practice both oil and gas prices are likely to vary. This means that the exercise
price of the utility’s call option changes as the price of oil changes. Uncertainty
about this exercise price could reduce or enhance the value of the option, depend-
ing on the correlation between the prices of the two fuels. If oil prices and gas prices
moved together dollar for dollar, your option to switch fuels would be valueless.
The benefit of a rise in the value of the underlying asset (the gas-fired plant) would
be exactly offset by a rise in the option’s exercise price (the value of the oil-fired
plant). The best of all worlds would occur if the prices of the two fuels were nega-
tively correlated. In this case whenever oil became expensive, the gas would be-
come cheap. In these (unlikely) circumstances the option to switch between the
two fuels would be particularly valuable.
In this example, the output is the same (electricity); option value comes from
flexibility in raw materials (gas or oil). In other cases, option value comes from the
flexibility to switch from product to product using the same production facilities.
For example, textile firms have invested heavily in computer-controlled knitting
machines, which allow production to shift from product to product, or from design
to design, as demand and fashion dictate.
Flexibility in procurement can also have option value. For example, a computer
manufacturer planning next year’s production must also plan to buy components,
such as disc drives and microprocessors, in large quantities. Should it strike a deal
today with the component manufacturer? This locks in the quantity, price, and de-
livery dates. But it also gives up flexibility, for example, the ability to switch sup-
pliers next year or buy at a “spot” price if next year’s prices are lower.
The Finance in the News box features another example of the value of flexibil-
ity in production or procurement.
Another Look at Aircraft Purchase Options
For our final example, we return to the problem confronting airlines that order new
airplanes for future use. In this industry “lead times” between an order and deliv-
ery can extend to several years. Long lead times mean that airlines which order
planes today may end up not needing them. You can see why an airline might ne-
gotiate for an aircraft purchase option.
In Section 10.3, we used aircraft purchase options to illustrate the option to ex-
pand. That’s true, but not the whole truth. Let’s take another look. Suppose an air-
line forecasts a need for a new Airbus A320 four years hence.
17
It has at least three
choices.
• Commit now. It can commit now to buy the plane, in exchange for Airbus’s
offer of locked-in price and delivery date.
• Acquire option. It can seek a purchase option from Airbus, allowing the airline
to decide later whether to buy. A purchase option fixes the price and delivery
date if the option is exercised.
CHAPTER 22
Real Options 631
17
The following example is based on J. E. Stonier, “What is an Aircraft Purchase Option Worth? Quan-
tifying Asset Flexibility Created through Manufacturer Lead-Time Reductions and Product Common-
ality,” in G. F. Butler and M. R. Keller (eds.), Handbook of Airline Finance, Aviation Week Books, 1999.
Brealey−Meyers:
Principles of Corporate
Finance, Seventh Edition
VI. Options 22. Real Options
© The McGraw−Hill
Companies, 2003
• Wait and decide later. Airbus will be happy to sell another A320 at any time in
the future if the airline wants to buy one. However, the airline may have to
pay a higher price and wait longer for delivery, especially if the airline
industry is flying high and many planes are on order.
The top half of Figure 22.6 shows the terms of a typical purchase option for an
Airbus A320. The option must be exercised at year 3, when final assembly of the
plane will begin. The option fixes the purchase price and the delivery date in year
4. The bottom half of the figure shows the consequences of “wait and decide later.”
We assume that the decision will come at year 3. If the decision is “buy,” the airline
pays the year-3 price and joins the queue for delivery in year 5 or later.
The payoffs from “wait and decide later” can never be better than the payoffs from
an aircraft purchase option, since the airline can discard the option and negotiate
afresh with Airbus if it wishes. In most cases the airline will be better off in the future
with the option than without it; the airline is at least guaranteed a place in the pro-
duction line, and it may have locked in a favorable purchase price. But how much
are these advantages worth today, compared to the wait-and-see strategy?
Figure 22.7 illustrates Airbus’s answers to this problem. It assumes a three-year
purchase option with an exercise price equal to the current A320 price of $45 mil-
lion. The present value of the purchase option depends on both the NPV of pur-
chasing an A320 at that price and on the forecasted wait for delivery if the airline
does not have a purchase option but nevertheless decides to place an order in year
3. The longer the wait in year 3, the more valuable it is to have the purchase option
today. (Remember that the purchase option holds a place in the A320 production
line and guarantees delivery in year 4.)
632
FINANCE IN THE NEWS
VALUING FLEXIBILITY
With the help of faculty from Stanford University,
Hewlett-Packard has experimented with real op-
tions since the beginning of the 1990s. Example: In
the ‘80s, HP customized inkjet printers for foreign
markets at the factory, then shipped them in fin-
ished form to warehouses. Customizing at the fac-
tory is cheaper than customizing in the field. But
HP kept guessing wrong on demand and ending up
with, say, too many printers configured for French
customers but not enough for Germans.
Executives realized that it would be smarter to
ship partially assembled printers and then cus-
tomize them at the warehouse, once it had firm or-
ders. True, local customization costs more. But
even though production costs rose, HP saved $3
million a month by more effectively matching sup-
ply to demand, says Corey A. Billington, a former
Stanford professor who directs HP’s Strategic Plan-
ning & Modeling group.
Common sense? Sure. But you can also view it
as a neat solution of a real-options problem. In-
creasing the cost of production—anathema to your
average engineer—was in effect the price HP paid
for the option to delay configuration choices until
the optimal time.
Source: P. Coy, “Exploiting Uncertainty,” Business Week,
June 7, 1999.