Berg J.M., Tymoczko J.L., Stryer L. Biochemistry
Подождите немного. Документ загружается.

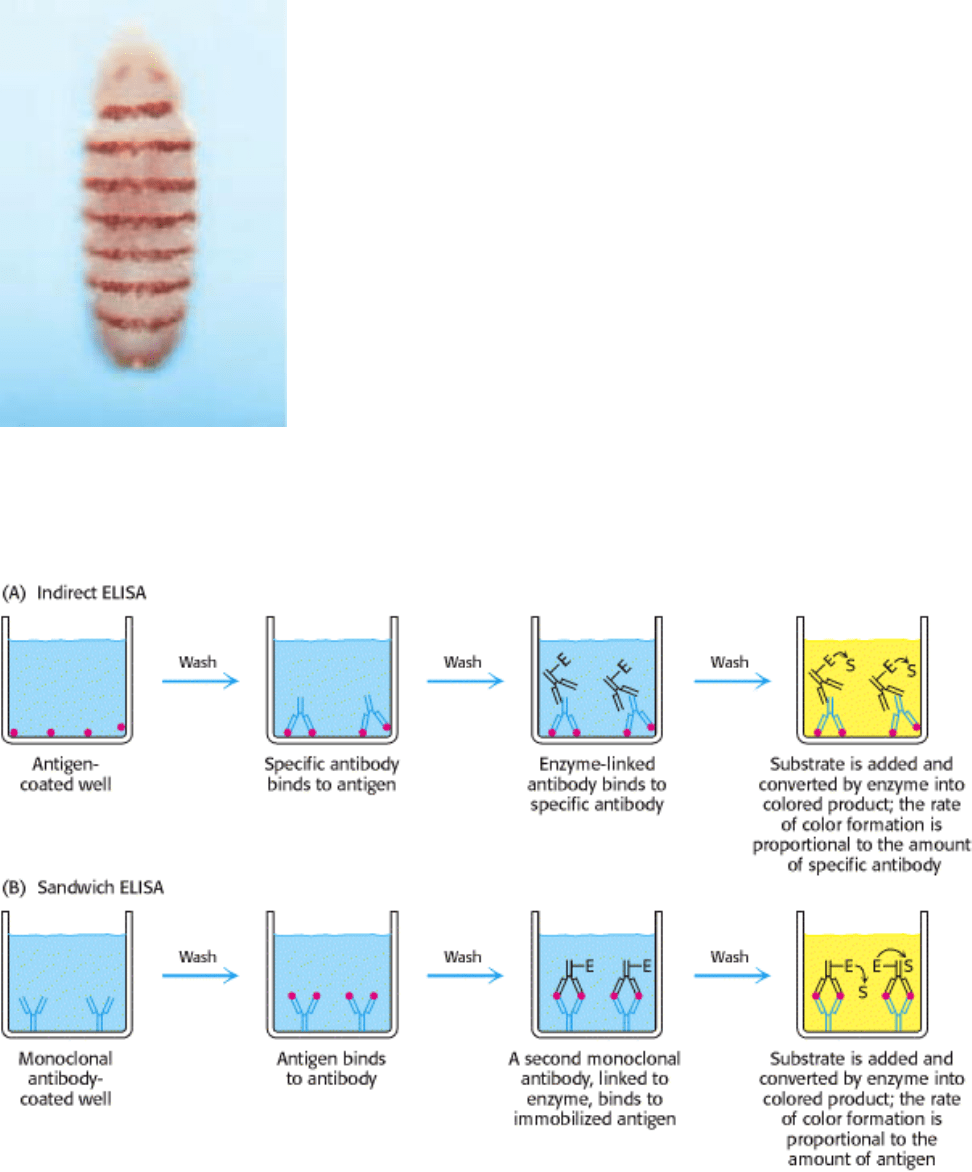
Figure 4.34. Fluorescence Micrograph of a Developing Drosophila Embryo. The embryo was stained with a
fluorescent-labeled monoclonal antibody for the DNA-binding protein encoded by engrailed, an essential gene in
specifying the body plan. [Courtesy of Dr. Nipam Patel and Dr. Corey Goodman.]
I. The Molecular Design of Life 4. Exploring Proteins 4.3. Immunology Provides Important Techniques with Which to Investigate Proteins
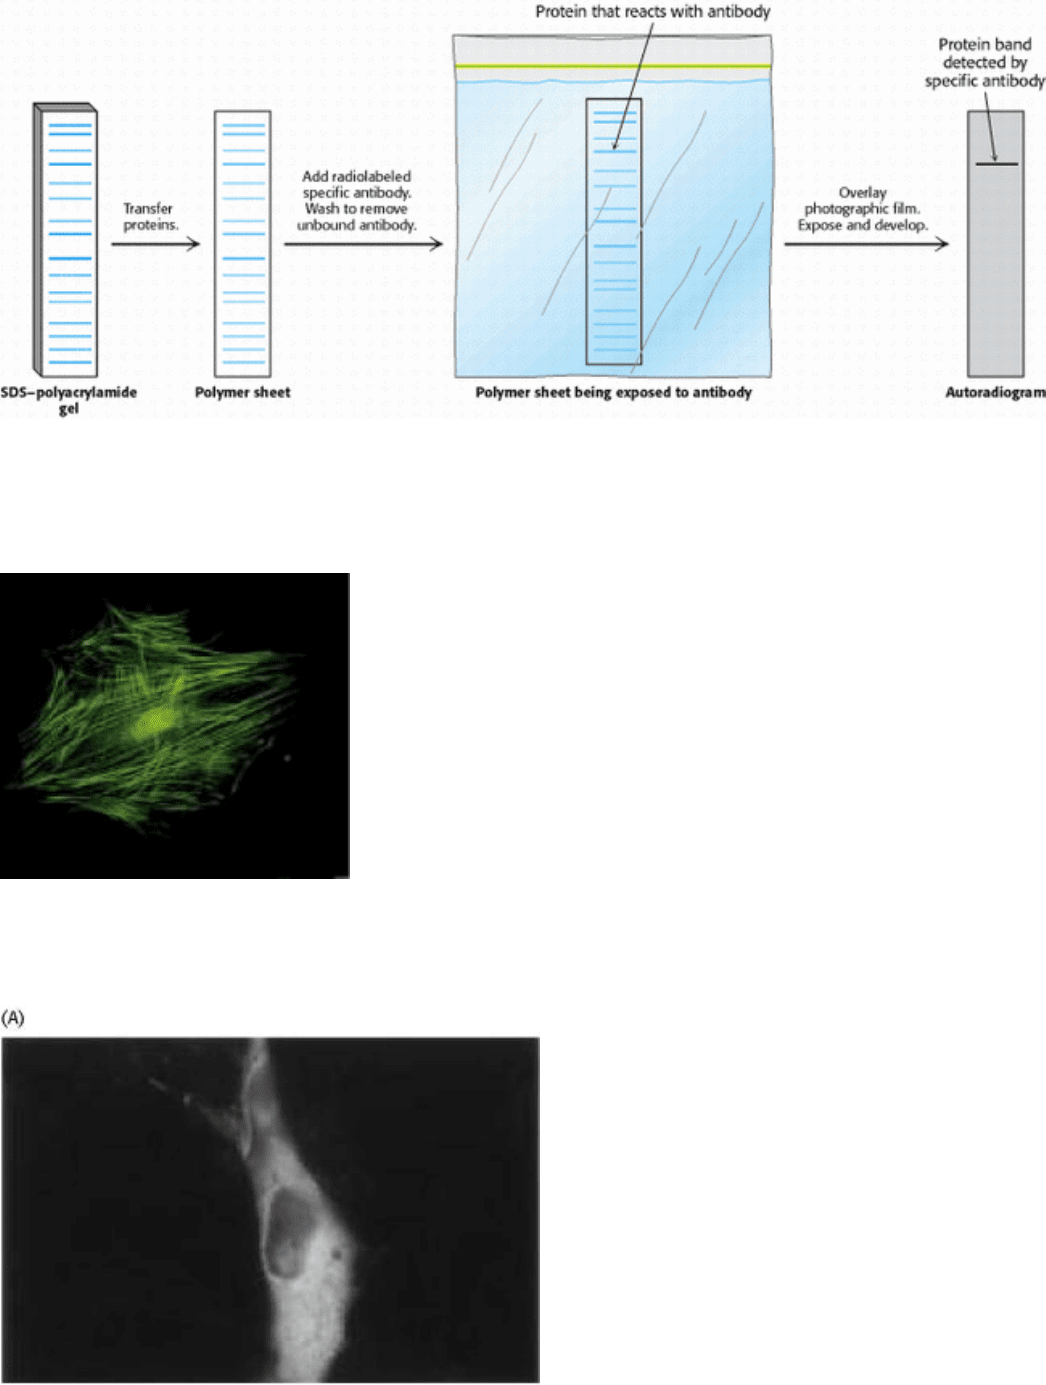
Figure 4.35. Indirect ELISA and Sandwich ELISA (A) In indirect ELISA, the production of color indicates the
amount of an antibody to a specific antigen. (B) In sandwich ELISA, the production of color indicates the quantity of
antigen. [After R. A. Goldsby, T. J. Kindt, B. A. Osborne, Kuby Immunology, 4th ed. (W. H. Freeman and Company,
2000), p. 162.]
I. The Molecular Design of Life 4. Exploring Proteins 4.3. Immunology Provides Important Techniques with Which to Investigate Proteins
Figure 4.36. Western Blotting. Proteins on an SDS-polyacrylamide gel are transferred to a polymer sheet and stained
with radioactive antibody. A band corresponding to the protein to which the antibody binds appears in the
autoradiogram.
I. The Molecular Design of Life 4. Exploring Proteins 4.3. Immunology Provides Important Techniques with Which to Investigate Proteins
Figure 4.37. Actin Filaments. Fluorescence micrograph of actin filaments in a cell stained with an antibody specific to
actin. [Courtesy of Dr. Elias Lazarides.]
I. The Molecular Design of Life 4. Exploring Proteins 4.3. Immunology Provides Important Techniques with Which to Investigate Proteins
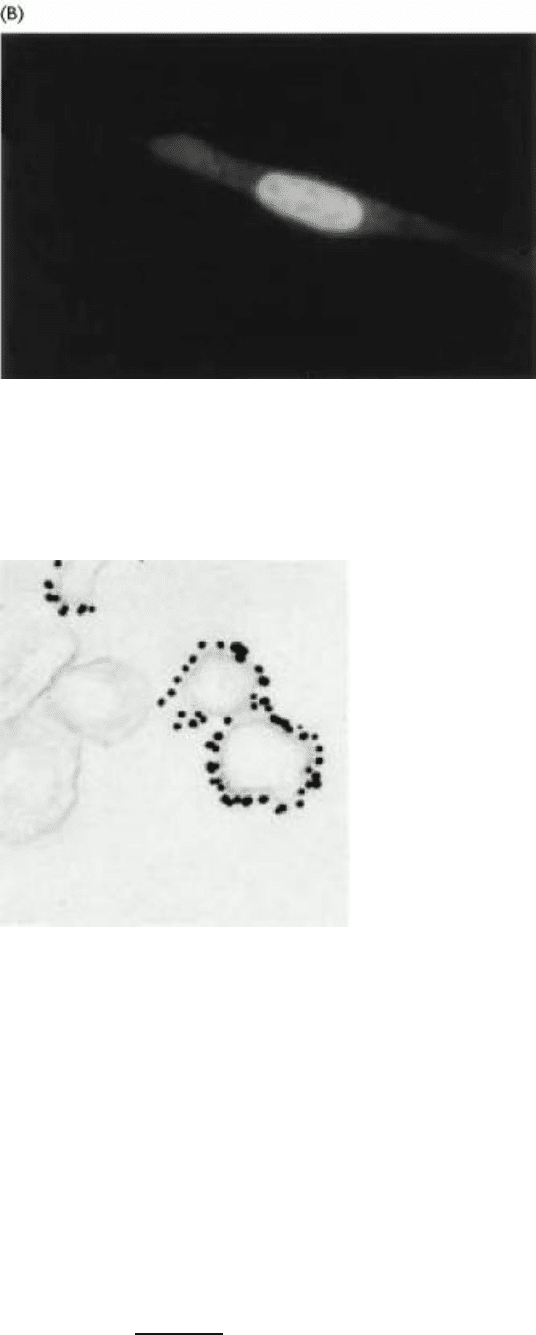
Figure 4.38. Nuclear Localization of a Steroid Receptor. (A) The receptor, made visible by attachment of the green
fluorescent protein, is located predominantly in the cytoplasm of the cultured cell. (B) Subsequent to the addition of
corticosterone (a glucocorticoid steroid), the receptor moves into the nucleus. [Courtesy of Professor William B. Pratt/
Department of Pharmacology, University of Michigan.]
I. The Molecular Design of Life 4. Exploring Proteins 4.3. Immunology Provides Important Techniques with Which to Investigate Proteins
Figure 4.39. Immunoelectron Microscopy. The opaque particles (150-Å, or 15-nm, diameter) in this electron
micrograph are clusters of gold atoms bound to antibody molecules. These membrane vesicles from the synapses of
neurons contain a channel protein that is recognized by the specific antibody. [Courtesy of Dr. Peter Sargent.]
I. The Molecular Design of Life 4. Exploring Proteins
4.4. Peptides Can Be Synthesized by Automated Solid-Phase Methods
The ability to synthesize peptides of defined sequence is a powerful technique for extending biochemical analysis for
several reasons.
1. Synthetic peptides can serve as antigens to stimulate the formation of specific antibodies. For instance, as discussed
earlier, it is often more efficient to obtain a protein sequence from a nucleic acid sequence than by sequencing the protein
itself (see also Chapter 6). Peptides can be synthesized on the basis of the nucleic acid sequence, and antibodies can be
raised that target these peptides. These antibodies can then be used to isolate the intact protein from the cell.
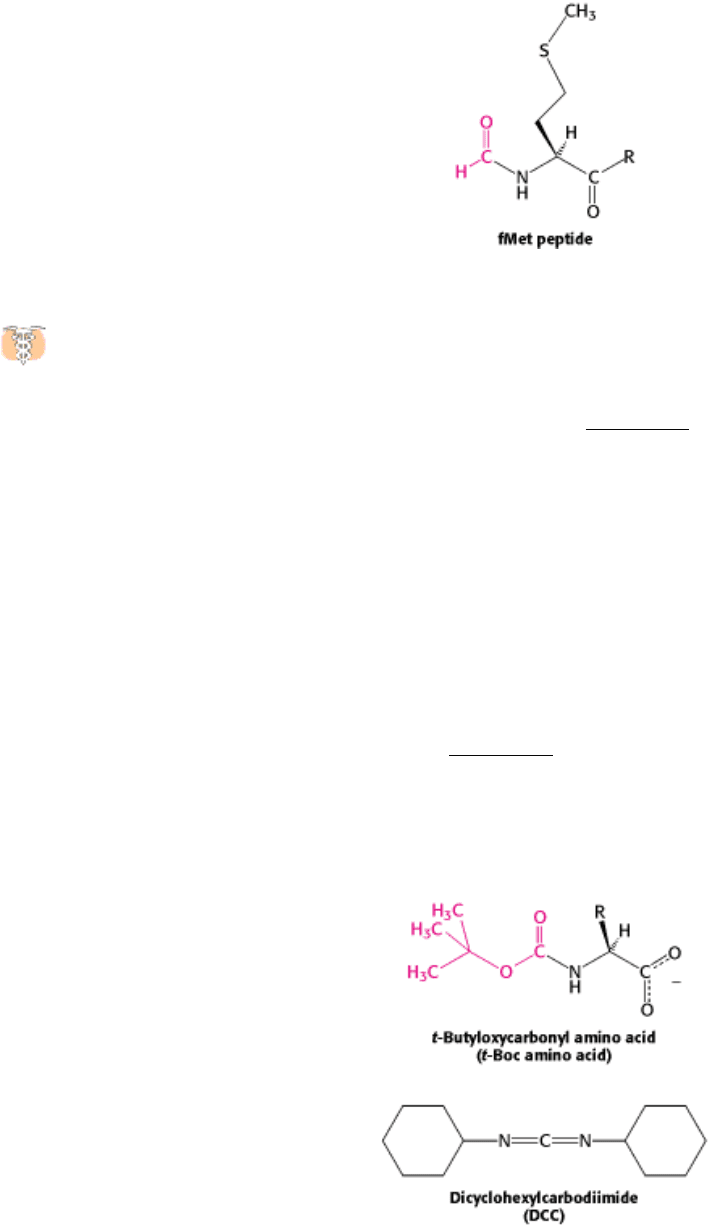
2. Synthetic peptides can be used to isolate receptors for many hormones and other signal molecules. For example, white
blood cells are attracted to bacteria by formylmethionyl (fMet) peptides released in the breakdown of bacterial proteins.
Synthetic formylmethionyl peptides have been useful in identifying the cell-surface receptor for this class of peptide.
Moreover, synthetic peptides can be attached to agarose beads to prepare affinity chromatography columns for the
purification of receptor proteins that specifically recognize the peptides.
3. Synthetic peptides can serve as drugs. Vasopressin is a peptide hormone that stimulates the reabsorption of water in
the distal tubules of the kidney, leading to the formation of more concentrated urine. Patients with diabetes
insipidus are deficient in vasopressin (also called antidiuretic hormone), and so they excrete large volumes of
urine (more than 5 liters per day) and are continually thirsty. This defect can be treated by administering 1-desamino-8-
d-
arginine vasopressin, a synthetic analog of the missing hormone (Figure 4.40). This synthetic peptide is degraded in vivo
much more slowly than vasopressin and, additionally, does not increase the blood pressure.
4. Finally, studying synthetic peptides can help define the rules governing the three-dimensional structure of proteins.
We can ask whether a particular sequence by itself folds into an α helix, β strand, or hairpin turn or behaves as a random
coil.
How are these peptides constructed? The amino group of one amino acid is linked to the carboxyl group of another.
However, a unique product is formed only if a single amino group and a single carboxyl group are available for reaction.
Therefore, it is necessary to block some groups and to activate others to prevent unwanted reactions. The α -amino group
of the first amino acid of the desired peptide is blocked with a tert-butyloxycarbonyl (t-Boc) group, yielding a t-Boc
amino acid. The carboxyl group of this same amino acid is activated by reacting it with a reagent such as
dicyclohexylcarbodiimide (DCC), as illustrated in Figure 4.41. The free amino group of the next amino acid to be linked
attacks the activated carboxyl, leading to the formation of a peptide bond and the release of dicyclohexylurea. The
carboxyl group of the resulting dipeptide is activated with DCC and reacted with the free amino group of the amino acid
that will be the third residue in the peptide. This process is repeated until the desired peptide is synthesized. Exposing the
peptide to dilute acid removes the t-Boc protecting group from the first amino acid while leaving peptide bonds intact.
Peptides containing more than 100 amino acids can be synthesized by sequential repetition of the preceding reactions.
Linking the growing peptide chain to an insoluble matrix, such as polystyrene beads, further enhances efficiency. A
major advantage of this solid-phase method is that the desired product at each stage is bound to beads that can be rapidly
filtered and washed, and so there is no need to purify intermediates. All reactions are carried out in a single vessel,
eliminating losses caused by repeated transfers of products. The carboxyl-terminal amino acid of the desired peptide

sequence is first anchored to the polystyrene beads (Figure 4.42). The t-Boc protecting group of this amino acid is then
removed. The next amino acid (in the protected t-Boc form) and dicyclohexylcarbodiimide, the coupling agent, are
added together. After the peptide bond forms, excess reagents and dicyclohexylurea are washed away, leaving the
desired dipeptide product attached to the beads. Additional amino acids are linked by the same sequence of reactions. At
the end of the synthesis, the peptide is released from the beads by adding hydrofluoric acid (HF), which cleaves the
carboxyl ester anchor without disrupting peptide bonds. Protecting groups on potentially reactive side chains, such as
that of lysine, also are removed at this time. This cycle of reactions can be readily automated, which makes it feasible to
routinely synthesize peptides containing about 50 residues in good yield and purity. In fact, the solid-phase method has
been used to synthesize interferons (155 residues) that have antiviral activity and ribonuclease (124 residues) that is
catalytically active.
I. The Molecular Design of Life 4. Exploring Proteins 4.4. Peptides Can Be Synthesized by Automated Solid-Phase Methods
Figure 4.40. Vasopressin and Synthetic Vasopressin. Structural formulas of (A) vasopressin, a peptide hormone that
stimulates water resorption, and (B) 1-desamino-8-d-arginine vasopressin, a more stable synthetic analog of this
antidiuretic hormone.
I. The Molecular Design of Life 4. Exploring Proteins 4.4. Peptides Can Be Synthesized by Automated Solid-Phase Methods
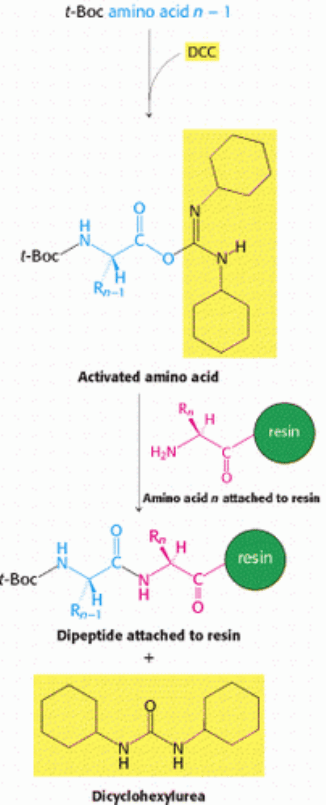
Figure 4.41. Amino Acid Activation. Dicyclohexylcarbodiimide is used to activate carboxyl groups for the formation
of peptide bonds.
I. The Molecular Design of Life 4. Exploring Proteins 4.4. Peptides Can Be Synthesized by Automated Solid-Phase Methods

Figure 4.42. Solid-Phase Peptide Synthesis. The sequence of steps in solid-phase synthesis is: (1) anchoring of the C-
terminal amino acid, (2) deprotection of the amino terminus, and (3) coupling of the next residue. Steps 2 and 3 are
repeated for each added amino acid. Finally, in step 4, the completed peptide is released from the resin.
I. The Molecular Design of Life 4. Exploring Proteins
4.5. Three-Dimensional Protein Structure Can Be Determined by NMR Spectroscopy
and X-Ray Crystallography
A crucial question is, What does the three-dimensional structure of a specific protein look like? Protein structure
determines function, given that the specificity of active sites and binding sites depends on the precise threedimensional
conformation. Nuclear magnetic resonance spectroscopy and x-ray crystallography are two of the most important
techniques for elucidating the conformation of proteins.
4.5.1. Nuclear Magnetic Resonance Spectroscopy Can Reveal the Structures of Proteins
in Solution
Nuclear magnetic resonance (NMR) spectroscopy is unique in being able to reveal the atomic structure of
macromolecules in solution, provided that highly concentrated solutions (~1 mM, or 15 mg ml
-1
for a 15-kd protein) can
be obtained. This technique depends on the fact that certain atomic nuclei are intrinsically magnetic. Only a limited
number of isotopes display this property, called spin, and the ones most important to biochemistry are listed in Table 4.4.
The simplest example is the hydrogen nucleus (
1
H), which is a proton. The spinning of a proton generates a magnetic
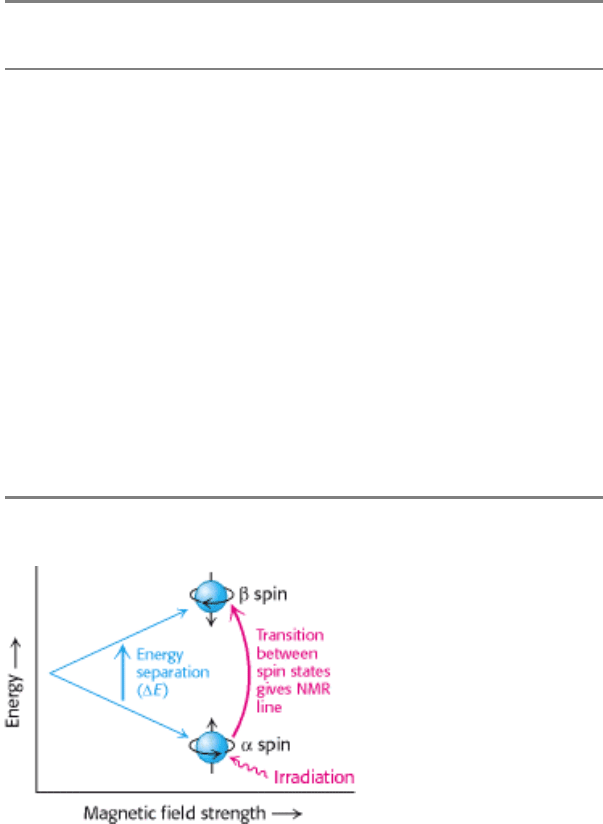
moment. This moment can take either of two orientations, or spin states (called α and β ), when an external magnetic

field is applied (Figure 4.43). The energy difference between these states is proportional to the strength of the imposed
magnetic field. The α state has a slightly lower energy and hence is slightly more populated (by a factor of the order of
1.00001 in a typical experiment) because it is aligned with the field. A spinning proton in an α state can be raised to an
excited state ( β state) by applying a pulse of electromagnetic radiation (a radio-frequency, or RF, pulse), provided the
frequency corresponds to the energy difference between the α and the β states. In these circumstances, the spin will
change from α to β ; in other words, resonance will be obtained. A resonance spectrum for a molecule can be obtained
by varying the magnetic field at a constant frequency of electromagnetic radiation or by keeping the magnetic field
constant and varying electromagnetic radiation.
These properties can be used to examine the chemical surroundings of the hydrogen nucleus. The flow of electrons
around a magnetic nucleus generates a small local magnetic field that opposes the applied field. The degree of such
shielding depends on the surrounding electron density. Consequently, nuclei in different environments will change states,
or resonate, at slightly different field strengths or radiation frequencies. The nuclei of the perturbed sample absorb
electromagnetic radiation at a frequency that can be measured. The different frequencies, termed chemical shifts, are
expressed in fractional units δ (parts per million, or ppm) relative to the shifts of a standard compound, such as a water-
soluble derivative of tetramethysilane, that is added with the sample. For example, a -CH
3
proton typically exhibits a
chemical shift ( δ ) of 1 ppm, compared with a chemical shift of 7 ppm for an aromatic proton. The chemical shifts of
most protons in protein molecules fall between 0 and 9 ppm (Figure 4.44). It is possible to resolve most protons in many
proteins by using this technique of onedimensional NMR. With this information, we can then deduce changes to a
particular chemical group under different conditions, such as the conformational change of a protein from a disordered
structure to an α helix in response to a change in pH.
We can garner even more information by examining how the spins on different protons affect their neighbors. By
inducing a transient magnetization in a sample through the application a radio-frequency pulse, it is possible to alter the
spin on one nucleus and examine the effect on the spin of a neighboring nucleus. Especially revealing is a two-
dimensional spectrum obtained by nuclear Overhauser enhancement spectroscopy (NOESY), which graphically displays
pairs of protons that are in close proximity, even if they are not close together in the primary structure. The basis for this
technique is the nuclear Overhauser effect (NOE), an interaction between nuclei that is proportional to the inverse sixth
power of the distance between them. Magnetization is transferred from an excited nucleus to an unexcited one if they are
less than about 5 Å apart (Figure 4.45A). In other words, the effect provides a means of detecting the location of atoms
relative to one another in the three-dimensional structure of the protein. The diagonal of a NOESY spectrum corresponds
to a one-dimensional spectrum. The offdiagonal peaks provide crucial new information: they identify pairs of protons
that are less than 5 Å apart (Figure 4.45B). A two-dimensional NOESY spectrum for a protein comprising 55 amino
acids is shown in Figure 4.46. The large number of off-diagonal peaks reveals short proton-proton distances. The three-
dimensional structure of a protein can be reconstructed with the use of such proximity relations. Structures are calculated
such that protons that must be separated by less than 5 Å on the basis of NOESY spectra are close to one another in the
three-dimensional structure (Figure 4.47). If a sufficient number of distance constraints are applied, the three-
dimensional structure can be determined nearly uniquely. A family of related structures is generated for three reasons
(Figure 4.48). First, not enough constraints may be experimentally accessible to fully specify the structure. Second, the
distances obtained from analysis of the NOESY spectrum are only approximate. Finally, the experimental observations
are made not on single molecules but on a large number of molecules in solution that may have slightly different
structures at any given moment. Thus, the family of structures generated from NMR structure analysis indicates the
range of conformations for the protein in solution. At present, NMR spectroscopy can determine the structures of only
relatively small proteins (<40 kd), but its resolving power is certain to increase. The power of NMR has been greatly
enhanced by the ability to produce proteins labeled uniformly or at specific sites with
13
C,
15
N, and
2
H with the use of
recombinant DNA technology (Chapter 6).
4.5.2. X-Ray Crystallography Reveals Three-Dimensional Structure in Atomic Detail
X-ray crystallography provides the finest visualization of protein structure currently available. This technique can reveal
the precise three-dimensional positions of most atoms in a protein molecule. The use of x-rays provides the best
resolution because the wavelength of x-rays is about the same length as that of a covalent bond. The three components in

an x-ray crystallographic analysis are a protein crystal, a source of x-rays, and a detector (Figure 4.49).
The technique requires that all molecules be precisely oriented, so the first step is to obtain crystals of the protein of
interest. Slowly adding ammonium sulfate or another salt to a concentrated solution of protein to reduce its solubility
favors the formation of highly ordered crystals. This is the process of salting out discussed in Section 4.1.3. For example,
myoglobin crystallizes in 3 M ammonium sulfate (Figure 4.50). Some proteins crystallize readily, whereas others do so
only after much effort has been expended in identifying the right conditions. Crystallization is an art; the best
practitioners have great perseverance and patience. Increasingly large and complex proteins are being crystallized. For
example, poliovirus, an 8500-kd assembly of 240 protein subunits surrounding an RNA core, has been crystallized and
its structure solved by x-ray methods. Crucially, protein crystals frequently display their biological activity, indicating
that the proteins have crystallized in their biologically active configuration. For instance, enzyme crystals may display
catalytic activity if the crystals are suffused with substrate.
Next, a source of x-rays is required. A beam of x-rays of wavelength 1.54 Å is produced by accelerating electrons
against a copper target. A narrow beam of x-rays strikes the protein crystal. Part of the beam goes straight through the
crystal; the rest is scattered in various directions. Finally, these scattered, or diffracted, x-rays are detected by x-ray film,
the blackening of the emulsion being proportional to the intensity of the scattered x-ray beam, or by a solid-state
electronic detector. The scattering pattern provides abundant information about protein structure. The basic physical
principles underlying the technique are:
1. Electrons scatter x-rays. The amplitude of the wave scattered by an atom is proportional to its number of electrons.
Thus, a carbon atom scatters six times as strongly as a hydrogen atom does.
2. The scattered waves recombine. Each atom contributes to each scattered beam. The scattered waves reinforce one
another at the film or detector if they are in phase (in step) there, and they cancel one another if they are out of phase.
3. The way in which the scattered waves recombine depends only on the atomic arrangement.
The protein crystal is mounted and positioned in a precise orientation with respect to the x-ray beam and the film. The
crystal is rotated so that the beam can strike the crystal from many directions. This rotational motion results in an x-ray
photograph consisting of a regular array of spots called reflections. The x-ray photograph shown in Figure 4.51 is a
twodimensional section through a three-dimensional array of 25,000 spots. The intensity of each spot is measured. These
intensities and their positions are the basic experimental data of an x-ray crystallographic analysis. The next step is to
reconstruct an image of the protein from the observed intensities. In light microscopy or electron microscopy, the
diffracted beams are focused by lenses to directly form an image. However, appropriate lenses for focusing x-rays do not
exist. Instead, the image is formed by applying a mathematical relation called a Fourier transform. For each spot, this
operation yields a wave of electron density whose amplitude is proportional to the square root of the observed intensity
of the spot. Each wave also has a phase that is, the timing of its crests and troughs relative to those of other waves.
The phase of each wave determines whether the wave reinforces or cancels the waves contributed by the other spots.
These phases can be deduced from the well-understood diffraction patterns produced by electron-dense heavy-atom
reference markers such as uranium or mercury at specific sites in the protein.
The stage is then set for the calculation of an electron-density map, which gives the density of electrons at a large
number of regularly spaced points in the crystal. This three-dimensional electron-density distribution is represented by a
series of parallel sections stacked on top of one another. Each section is a transparent plastic sheet (or, more recently, a
layer in a computer image) on which the electron-density distribution is represented by contour lines (Figure 4.52), like
the contour lines used in geological survey maps to depict altitude (Figure 4.53). The next step is to interpret the electron-
density map. A critical factor is the resolution of the x-ray analysis, which is determined by the number of scattered
intensities used in the Fourier synthesis. The fidelity of the image depends on the resolution of the Fourier synthesis, as
shown by the optical analogy in Figure 4.54. A resolution of 6 Å reveals the course of the polypeptide chain but few
other structural details. The reason is that polypeptide chains pack together so that their centers are between 5 Å and 10
Å apart. Maps at higher resolution are needed to delineate groups of atoms, which lie between 2.8 Å and 4.0 Å apart, and
individual atoms, which are between 1.0 Å and 1.5 Å apart. The ultimate resolution of an x-ray analysis is determined by
the degree of perfection of the crystal. For proteins, this limiting resolution is usually about 2 Å.
The structures of more than 10,000 proteins had been elucidated by NMR and x-ray crystallography by mid-2000, and
several new structures are now determined each day. The coordinates are collected at the Protein Data Bank (http://www.
rcsb.org/pdb) and the structures can be accessed for visualization and analysis. Knowledge of the detailed molecular
architecture of proteins has been a source of insight into how proteins recognize and bind other molecules, how they
function as enzymes, how they fold, and how they evolved. This extraordinarily rich harvest is continuing at a rapid pace
and is greatly influencing the entire field of biochemistry.
I. The Molecular Design of Life 4. Exploring Proteins 4.5. Three-Dimensional Protein Structure Can Be Determined by NMR Spectroscopy and X-Ray Crystallography
Table 4.4. Biologically important nuclei giving NMR signals
Nucleus Natural abundance (% by weight Nucleus of the element)
1
H
99.984
2
H
0.016
13
C
1.108
14
N
99.635
15
N
0.365
17
O
0.037
23
Na
100.0
25
Mg
10.05
31
P
100.0
35
Cl
75.4
39
K
93.1
I. The Molecular Design of Life 4. Exploring Proteins 4.5. Three-Dimensional Protein Structure Can Be Determined by NMR Spectroscopy and X-Ray Crystallography
Figure 4.43. Basis of NMR Spectroscopy. The energies of the two orientations of a nucleus of spin
1
/
2
(such as
31
P and
1
H) depend on the strength of the applied magnetic field. Absorption of electromagnetic radiation of appropriate
frequency induces a transition from the lower to the upper level.