Berg J.M., Tymoczko J.L., Stryer L. Biochemistry
Подождите немного. Документ загружается.

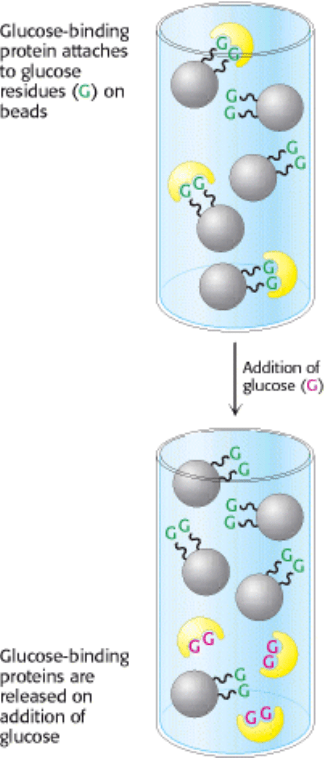
advantage of the high affinity of many proteins for specific chemical groups. For example, the plant protein concanavalin
A can be purified by passing a crude extract through a column of beads containing covalently attached glucose residues.
Concanavalin A binds to such a column because it has affinity for glucose, whereas most other proteins do not. The
bound concanavalin A can then be released from the column by adding a concentrated solution of glucose. The glucose
in solution displaces the column-attached glucose residues from binding sites on concanavalin A (Figure 4.5). Affinity
chromatography is a powerful means of isolating transcription factors, proteins that regulate gene expression by binding
to specific DNA sequences. A protein mixture is percolated through a column containing specific DNA sequences
attached to a matrix; proteins with a high affinity for the sequence will bind and be retained. In this instance, the
transcription factor is released by washing with a solution containing a high concentration of salt. In general, affinity
chromatography can be effectively used to isolate a protein that recognizes group X by (1) covalently attaching X or a
derivative of it to a column, (2) adding a mixture of proteins to this column, which is then washed with buffer to remove
unbound proteins, and (3) eluting the desired protein by adding a high concentration of a soluble form of X or altering
the conditions to decrease binding affinity. Affinity chromatography is most effective when the interaction of the protein
and the molecule that is used as the bait is highly specific.
High-Pressure Liquid Chromatography.
The resolving power of all of the column techniques can be improved substantially through the use of a technique called
high-pressure liquid chromatography (HPLC), which is an enhanced version of the column techniques already
discussed. The column materials themselves are much more finely divided and, as a consequence, there are more
interaction sites and thus greater resolving power. Because the column is made of finer material, pressure must be
applied to the column to obtain adequate flow rates. The net result is high resolution as well as rapid separation (Figure
4.6).
4.1.4. Proteins Can Be Separated by Gel Electrophoresis and Displayed
How can we tell whether a purification scheme is effective? One way is to ascertain that the specific activity rises with
each purification step. Another is to visualize the effectiveness by displaying the proteins present at each step. The
technique of electrophoresis makes the latter method possible.
Gel Electrophoresis.
A molecule with a net charge will move in an electric field. This phenomenon, termed electrophoresis, offers a powerful
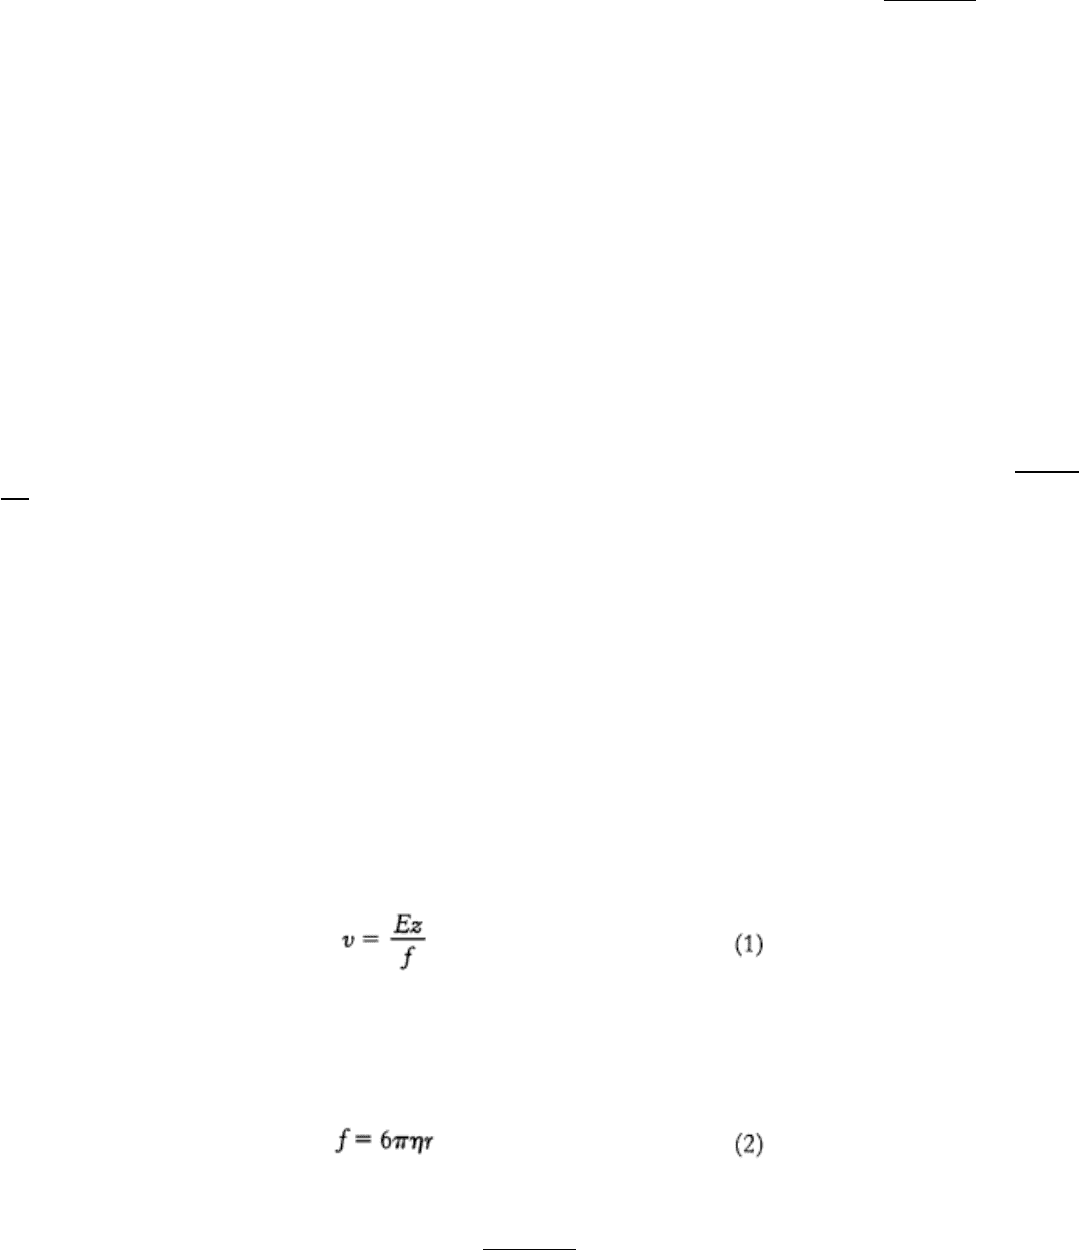
means of separating proteins and other macromolecules, such as DNA and RNA. The velocity of migration (v) of a
protein (or any molecule) in an electric field depends on the electric field strength (E), the net charge on the protein (z),
and the frictional coefficient (f).
The electric force Ez driving the charged molecule toward the oppositely charged electrode is opposed by the viscous
drag fv arising from friction between the moving molecule and the medium. The frictional coefficient f depends on both
the mass and shape of the migrating molecule and the viscosity ( η ) of the medium. For a sphere of radius r,
Electrophoretic separations are nearly always carried out in gels (or on solid supports such as paper) because the gel
serves as a molecular sieve that enhances separation (Figure 4.7). Molecules that are small compared with the pores in
the gel readily move through the gel, whereas molecules much larger than the pores are almost immobile. Intermediate-
size molecules move through the gel with various degrees of facility. Electrophoresis is performed in a thin, vertical slab
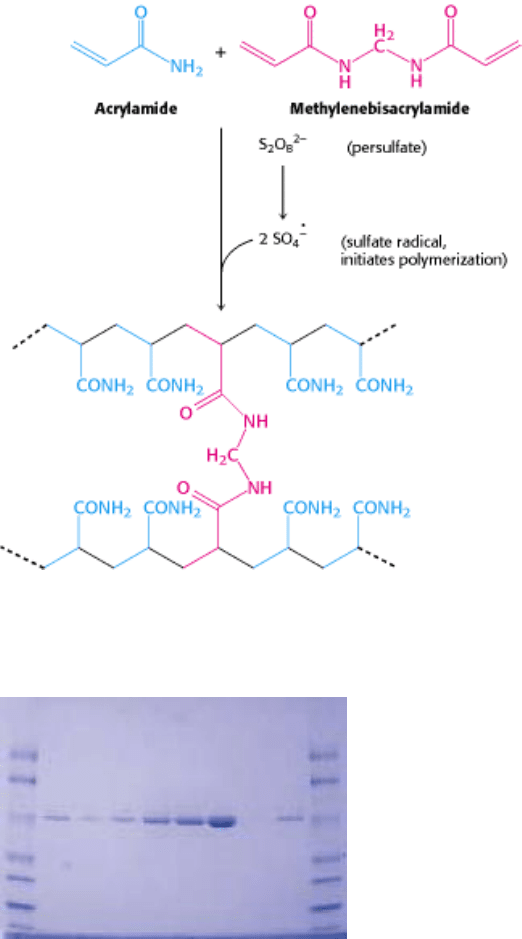
of polyacrylamide. The direction of flow is from top to bottom. Polyacrylamide gels, formed by the polymerization of
acrylamide and cross-linked by methylenebisacrylamide, are choice supporting media for electrophoresis because they
are chemically inert and are readily formed (Figure 4.8). Electrophoresis is the opposite of gel filtration in that all of the
molecules, regardless of size, are forced to move through the same matrix. The gel behaves as one bead of a gel-filtration
column.
Proteins can be separated largely on the basis of mass by electrophoresis in a polyacrylamide gel under denaturing
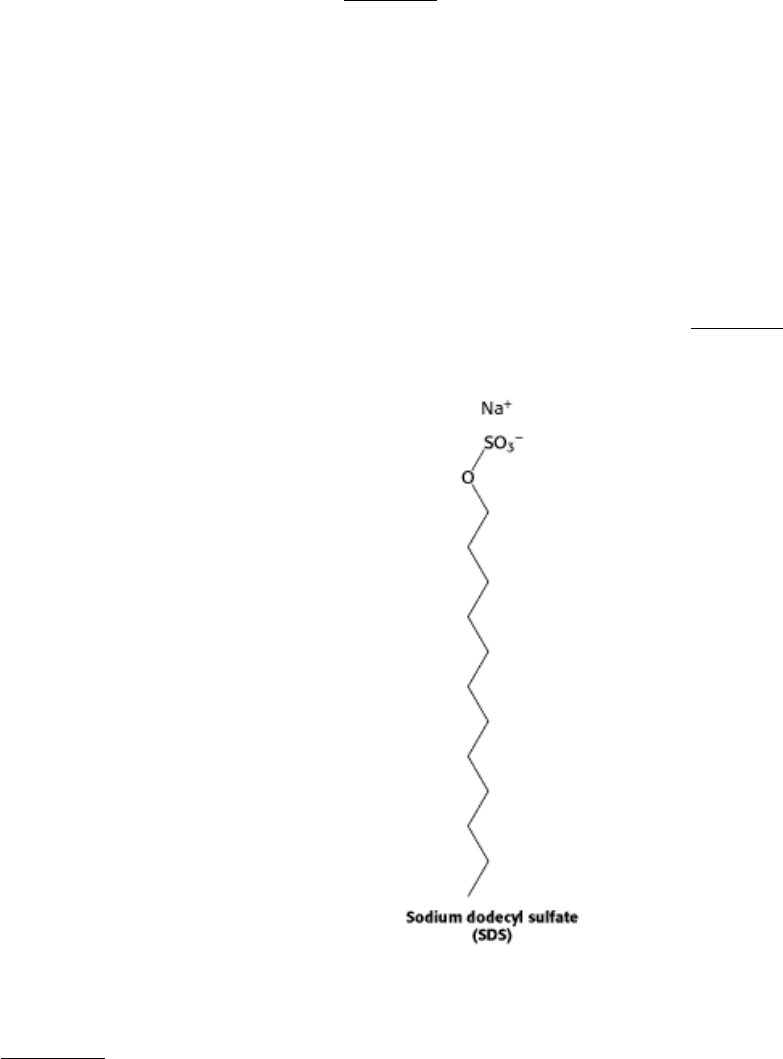
conditions. The mixture of proteins is first dissolved in a solution of sodium dodecyl sulfate (SDS), an anionic detergent
that disrupts nearly all noncovalent interactions in native proteins. Mercaptoethanol (2-thioethanol) or dithiothreitol also
is added to reduce disulfide bonds. Anions of SDS bind to main chains at a ratio of about one SDS anion for every two
amino acid residues. This complex of SDS with a denatured protein has a large net negative charge that is roughly
proportional to the mass of the protein. The negative charge acquired on binding SDS is usually much greater than the
charge on the native protein; this native charge is thus rendered insignificant. The SDS-protein complexes are then
subjected to electrophoresis. When the electrophoresis is complete, the proteins in the gel can be visualized by staining
them with silver or a dye such as Coomassie blue, which reveals a series of bands (Figure 4.9). Radioactive labels can be
detected by placing a sheet of x-ray film over the gel, a procedure called autoradiography.
Small proteins move rapidly through the gel, whereas large proteins stay at the top, near the point of application of the
mixture. The mobility of most polypeptide chains under these conditions is linearly proportional to the logarithm of their
mass (Figure 4.10). Some carbohydrate-rich proteins and membrane proteins do not obey this empirical relation,
however. SDS-polyacrylamide gel electrophoresis (SDS-PAGE) is rapid, sensitive, and capable of a high degree of
resolution. As little as 0.1 µ g (~2 pmol) of a protein gives a distinct band when stained with Coomassie blue, and even
less (~0.02 µ g) can be detected with a silver stain. Proteins that differ in mass by about 2% (e.g., 40 and 41 kd, arising
from a difference of about 10 residues) can usually be distinguished.
We can examine the efficacy of our purification scheme by analyzing a part of each fraction by SDS-PAGE. The initial
fractions will display dozens to hundreds of proteins. As the purification progresses, the number of bands will diminish,
and the prominence of one of the bands should increase. This band will correspond to the protein of interest.
Isoelectric Focusing.
Proteins can also be separated electrophoretically on the basis of their relative contents of acidic and basic residues. The

isoelectric point (pl) of a protein is the pH at which its net charge is zero. At this pH, its electrophoretic mobility is zero
because z in equation 1 is equal to zero. For example, the pI of cytochrome c, a highly basic electron-transport protein, is
10.6, whereas that of serum albumin, an acidic protein in blood, is 4.8. Suppose that a mixture of proteins undergoes
electrophoresis in a pH gradient in a gel in the absence of SDS. Each protein will move until it reaches a position in the
gel at which the pH is equal to the pI of the protein. This method of separating proteins according to their isoelectric
point is called isoelectric focusing. The pH gradient in the gel is formed first by subjecting a mixture of polyampholytes
(small multicharged polymers) having many pI values to electrophoresis. Isoelectric focusing can readily resolve
proteins that differ in pI by as little as 0.01, which means that proteins differing by one net charge can be separated
(Figure 4.11).
Two-Dimensional Electrophoresis.
Isoelectric focusing can be combined with SDS-PAGE to obtain very high resolution separations. A single sample is first
subjected to isoelectric focusing. This single-lane gel is then placed horizontally on top of an SDS-polyacrylamide slab.
The proteins are thus spread across the top of the polyacrylamide gel according to how far they migrated during
isoelectric focusing. They then undergo electrophoresis again in a perpendicular direction (vertically) to yield a
twodimensional pattern of spots. In such a gel, proteins have been separated in the horizontal direction on the basis of
isoelectric point and in the vertical direction on the basis of mass. It is remarkable that more than a thousand different
proteins in the bacterium Escherichia coli can be resolved in a single experiment by two-dimensional electrophoresis
(Figure 4.12).
Proteins isolated from cells under different physiological conditions can be subjected to two-dimensional
electrophoresis, followed by an examination of the intensity of the signals. In this way, particular proteins can be seen to
increase or decrease in concentration in response to the physiological state. How can we tell what protein is being
regulated? A former drawback to the power of the two-dimensional gel is that, although many proteins are displayed,
they are not identified. It is now possible to identify proteins by coupling two-dimensional gel electrophoresis with mass
spectrometric techniques. We will consider these techniques when we examine how the mass of a protein is determined
(Section 4.1.7).
4.1.5. A Protein Purification Scheme Can Be Quantitatively Evaluated
To determine the success of a protein purification scheme, we monitor the procedure at each step by determining specific
activity and by performing an SDS-PAGE analysis. Consider the results for the purification of a fictitious protein,
summarized in Table 4.1 and Figure 4.13. At each step, the following parameters are measured:
Total protein. The quantity of protein present in a fraction is obtained by determining the protein concentration of
a part of each fraction and multiplying by the fraction's total volume.
Total activity. The enzyme activity for the fraction is obtained by measuring the enzyme activity in the volume of
fraction used in the assay and multiplying by the fraction's total volume.
Specific activity. This parameter is obtained by dividing total activity by total protein.
Yield. This parameter is a measure of the activity retained after each purification step as a percentage of the
activity in the crude extract. The amount of activity in the initial extract is taken to be 100%.
Purification level. This parameter is a measure of the increase in purity and is obtained by dividing the specific
activity, calculated after each purification step, by the specific activity of the initial extract.
As we see in Table 4.1, the first purification step, salt fractionation, leads to an increase in purity of only 3-fold, but we
recover nearly all the target protein in the original extract, given that the yield is 92%. After dialysis to lower the high
concentration of salt remaining from the salt fractionation, the fraction is passed through an ion-exchange column. The
purification now increases to 9-fold compared with the original extract, whereas the yield falls to 77%. Molecular
exclusion chromatography brings the level of purification to 100-fold, but the yield is now at 50%. The final step is
affinity chromatography with the use of a ligand specific for the target enzyme. This step, the most powerful of these
purification procedures, results in a purification level of 3000-fold, while lowering the yield to 35%. The SDS-PAGE in
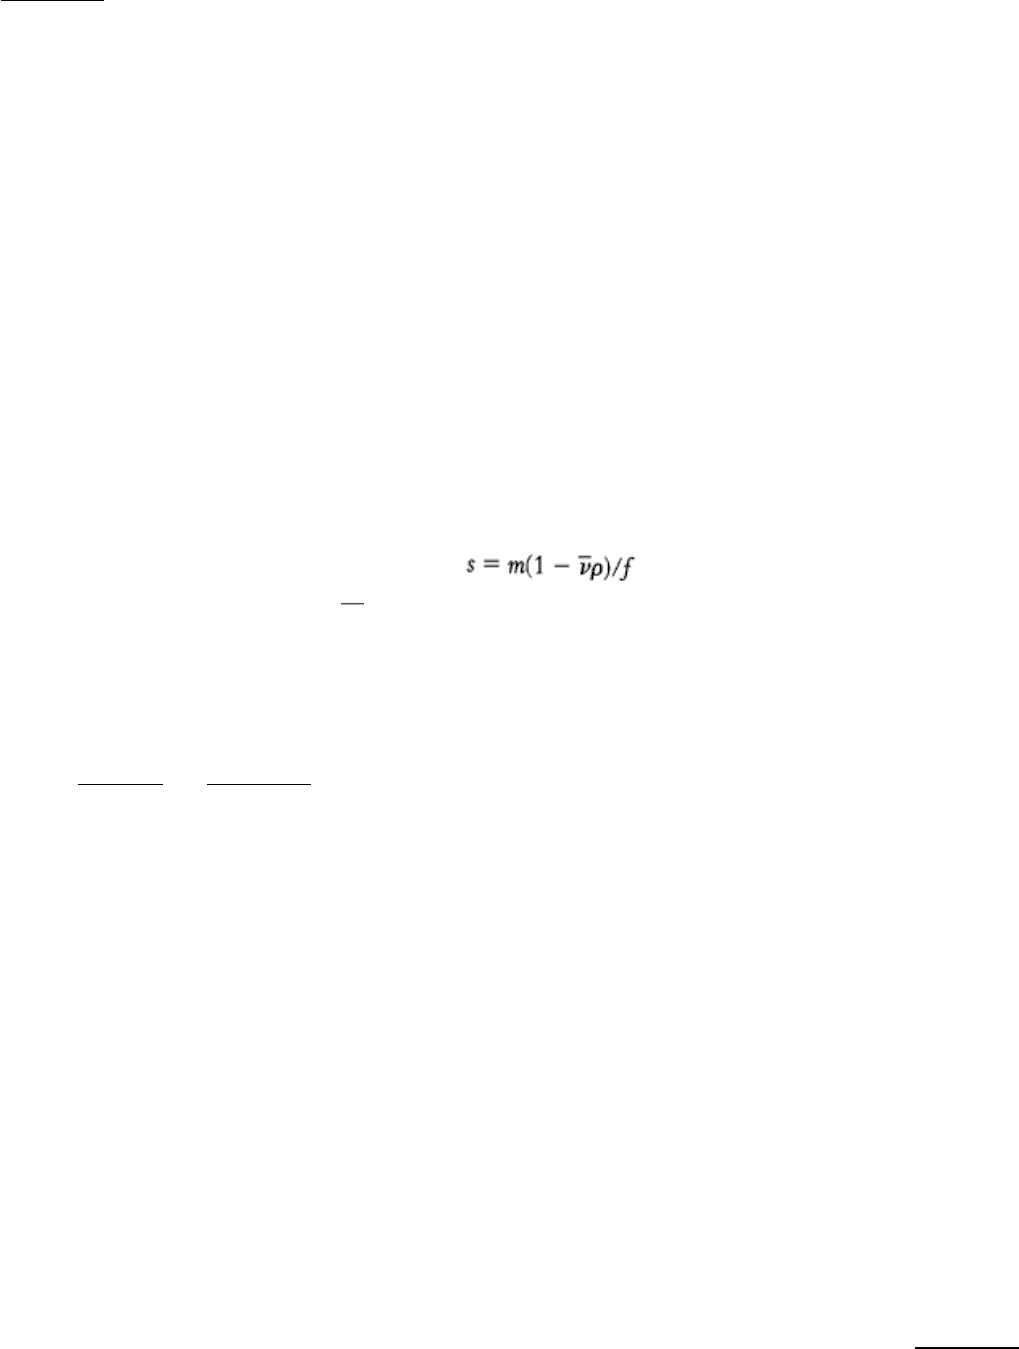
Figure 4.13 shows that, if we load a constant amount of protein onto each lane after each step, the number of bands
decreases in proportion to the level of purification, and the amount of protein of interest increases as a proportion of the
total protein present.
A good purification scheme takes into account both purification levels and yield. A high degree of purification and a
poor yield leave little protein with which to experiment. A high yield with low purification leaves many contaminants
(proteins other than the one of interest) in the fraction and complicates the interpretation of experiments.
4.1.6. Ultracentrifugation Is Valuable for Separating Biomolecules and Determining
Their Masses
We have already seen that centrifugation is a powerful and generally applicable method for separating a crude mixture of
cell components, but it is also useful for separating and analyzing biomolecules themselves. With this technique, we can
determine such parameters as mass and density, learn something about the shape of a molecule, and investigate the
interactions between molecules. To deduce these properties from the centrifugation data, we need a mathematical
description of how a particle behaves in a centrifugal force.
A particle will move through a liquid medium when subjected to a centrifugal force. A convenient means of quantifying
the rate of movement is to calculate the sedimentation coefficient, s, of a particle by using the following equation:
where m is the mass of the particle, ν
is the partial specific volume (the reciprocal of the particle density), ρ is the
density of the medium and f is the frictional coefficient (a measure of the shape of the particle). The (1 - ρ ) term is the
buoyant force exerted by liquid medium.
Sedimentation coefficients are usually expressed in Svedberg units (S), equal to 10
-13
s. The smaller the S value, the
slower a molecule moves in a centrifugal field. The S values for a number of biomolecules and cellular components are
listed in Table 4.2 and Figure 4.14.
Several important conclusions can be drawn from the preceding equation:
1. The sedimentation velocity of a particle depends in part on its mass. A more massive particle sediments more rapidly
than does a less massive particle of the same shape and density.
2. Shape, too, influences the sedimentation velocity because it affects the viscous drag. The frictional coefficient f of a
compact particle is smaller than that of an extended particle of the same mass. Hence, elongated particles sediment more
slowly than do spherical ones of the same mass.
3. A dense particle moves more rapidly than does a less dense one because the opposing buoyant force (1 - ρ ) is smaller
for the denser particle.
4. The sedimentation velocity also depends on the density of the solution. ( ρ ). Particles sink when ρ < 1, float when ρ >
1, and do not move when ρ = 1.
A technique called zonal, band, or most commonly gradient centrifugation can be used to separate proteins with
different sedimentation coefficients. The first step is to form a density gradient in a centrifuge tube. Differing proportions
of a low-density solution (such as 5% sucrose) and a high-density solution (such as 20% sucrose) are mixed to create a
linear gradient of sucrose concentration ranging from 20% at the bottom of the tube to 5% at the top (Figure 4.15). The
role of the gradient is to prevent connective flow. A small volume of a solution containing the mixture of proteins to be
separated is placed on top of the density gradient. When the rotor is spun, proteins move through the gradient and
separate according to their sedimentation coefficients. The time and speed of the centrifugation is determined

empirically. The separated bands, or zones, of protein can be harvested by making a hole in the bottom of the tube and
collecting drops. The drops can be measured for protein content and catalytic activity or another functional property.
This sedimentation-velocity technique readily separates proteins differing in sedimentation coefficient by a factor of two
or more.
The mass of a protein can be directly determined by sedimentation equilibrium, in which a sample is centrifuged at
relatively low speed so that sedimentation is counterbalanced by diffusion. The sedimentation-equilibrium technique for
determining mass is very accurate and can be applied under nondenaturing conditions in which the native quaternary
structure of multimeric proteins is preserved. In contrast, SDS-polyacrylamide gel electrophoresis (Section 4.1.4)
provides an estimate of the mass of dissociated polypeptide chains under denaturing conditions. Note that, if we know
the mass of the dissociated components of a multimeric protein as determined by SDS-polyacrylamide analysis and the
mass of the intact multimeric protein as determined by sedimentation equilibrium analysis, we can determine how many
copies of each polypeptide chain is present in the multimeric protein.
4.1.7. The Mass of a Protein Can Be Precisely Determined by Mass Spectrometry
Mass spectrometry has been an established analytical technique in organic chemistry for many years. Until recently,
however, the very low volatility of proteins made mass spectrometry useless for the investigation of these molecules.
This difficulty has been circumvented by the introduction of techniques for effectively dispersing proteins and other
macromolecules into the gas phase. These methods are called matrix-assisted laser desorption-ionization (MALDI) and
electrospray spectrometry. We will focus on MALDI spectrometry. In this technique, protein ions are generated and then
accelerated through an electrical field (Figure 4.16). They travel through the flight tube, with the smallest traveling
fastest and arriving at the detector first. Thus, the time of flight (TOF) in the electrical field is a measure of the mass (or,
more precisely, the mass/charge ratio). Tiny amounts of biomolecules, as small as a few picomoles (pmol) to femtomoles
(fmol), can be analyzed in this manner. A MALDI-TOF mass spectrum for a mixture of the proteins insulin and β -
lactoglobulin is shown in Figure 4.17. The masses determined by MALDI-TOF are 5733.9 and 18,364, respectively,
compared with calculated values of 5733.5 and 18,388. MALDI-TOF is indeed an accurate means of determining protein
mass.
Mass spectrometry has permitted the development of peptide mass fingerprinting. This technique for identifying peptides
has greatly enhanced the utility of two-dimensional gels. Two-dimensional electrophoresis is performed as described in
Section 4.1.4. The sample of interest is extracted and cleaved specifically by chemical or enzymatic means. The masses
of the protein fragments are then determined with the use of mass spectrometry. Finally, the peptide masses, or
fingerprint, are matched against the fingerprint found in databases of proteins that have been "electronically cleaved" by
a computer simulating the same fragmentation technique used for the experimental sample. This technique has provided
some outstanding results. For example, of 150 yeast proteins analyzed with the use of two-dimensional gels, peptide
mass fingerprinting unambiguously identified 80%. Mass spectrometry has provided name tags for many of the proteins
in twodimensional gels.
I. The Molecular Design of Life 4. Exploring Proteins 4.1. The Purification of Proteins Is an Essential First Step in Understanding Their Function
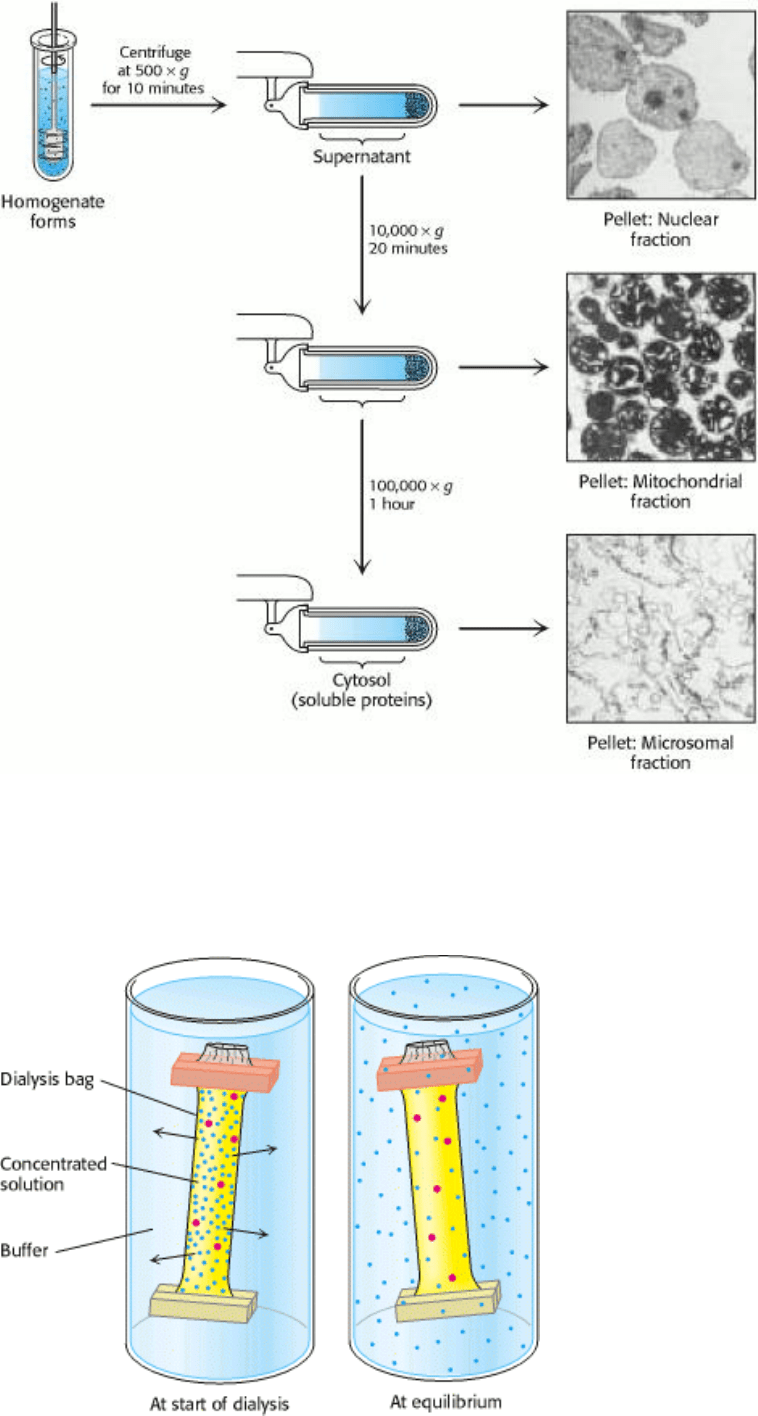
Figure 4.1. Differential Centrifugation. Cells are disrupted in a homogenizer and the resulting mixture, called the
homogenate, is centrifuged in a step-by-step fashion of increasing centrifugal force. The denser material will form a
pellet at lower centrifugal force than will the less-dense material. The isolated fractions can be used for further
purification. [Photographs courtesy of S. Fleischer and B. Fleischer.]
I. The Molecular Design of Life 4. Exploring Proteins 4.1. The Purification of Proteins Is an Essential First Step in Understanding Their Function
Figure 4.2. Dialysis. Protein molecules (red) are retained within the dialysis bag, whereas small molecules (blue) diffuse
into the surrounding medium.
I. The Molecular Design of Life 4. Exploring Proteins 4.1. The Purification of Proteins Is an Essential First Step in Understanding Their Function
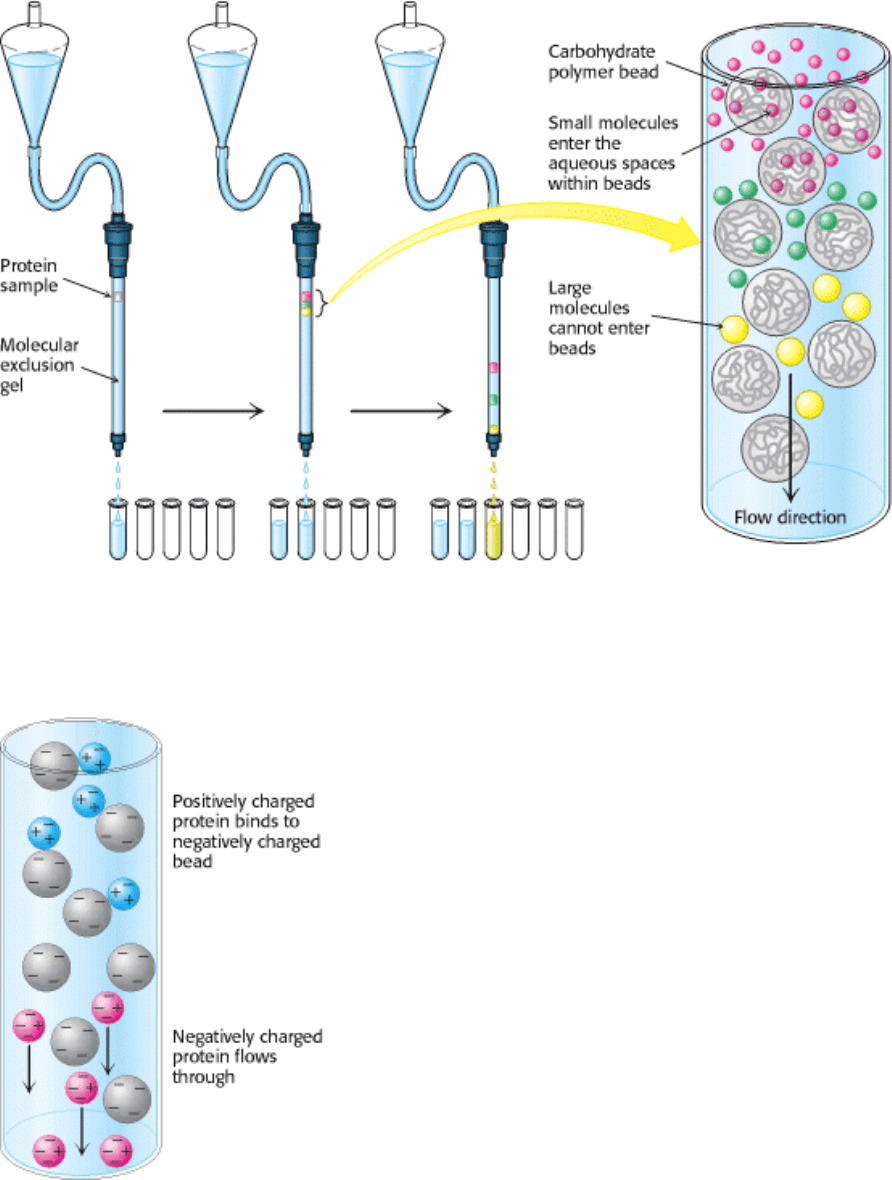
Figure 4.3. Gel Filtration Chromatography. A mixture of proteins in a small volume is applied to a column filled with
porous beads. Because large proteins cannot enter the internal volume of the beads, they emerge sooner than do small
ones.
I. The Molecular Design of Life 4. Exploring Proteins 4.1. The Purification of Proteins Is an Essential First Step in Understanding Their Function
Figure 4.4. Ion-Exchange Chromatography. This technique separates proteins mainly according to their net charge.
I. The Molecular Design of Life 4. Exploring Proteins 4.1. The Purification of Proteins Is an Essential First Step in Understanding Their Function
Figure 4.5. Affinity Chromatography. Affinity chromatography of concanavalin A (shown in yellow) on a solid
support containing covalently attached glucose residues (G).
I. The Molecular Design of Life 4. Exploring Proteins 4.1. The Purification of Proteins Is an Essential First Step in Understanding Their Function
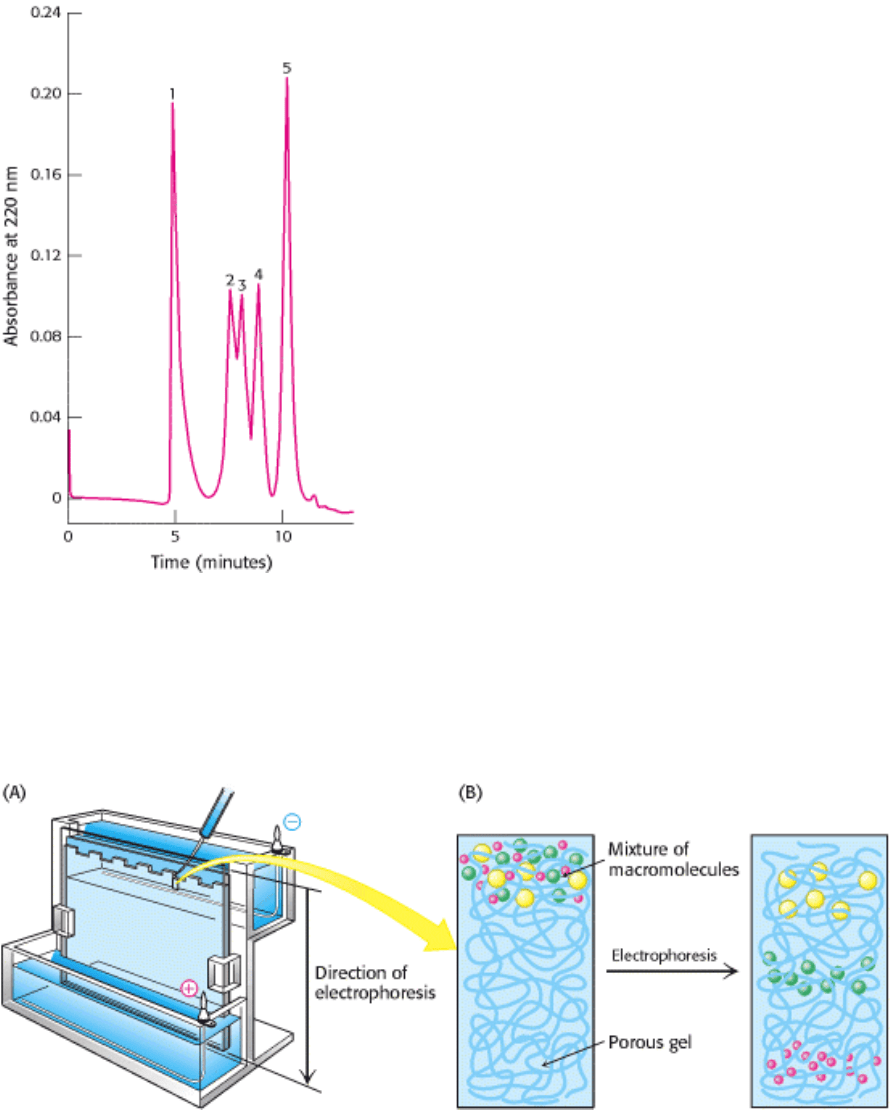
Figure 4.6. High-Pressure Liquid Chromatography (HPLC). Gel filtration by HPLC clearly defines the individual
proteins because of its greater resolving power: (1) thyroglobulin (669 kd), (2) catalase (232 kd), (3) bovine serum
albumin (67 kd), (4) ovalbumin (43 kd), and (5) ribonuclease (13.4 kd). [After K. J. Wilson and T. D. Schlabach. In
Current Protocols in Molecular Biology, vol. 2, suppl. 41, F. M. Ausbel, R. Brent, R. E. Kingston, D. D. Moore, J. G.
Seidman, J. A. Smith, and K. Struhl, Eds. (Wiley, 1998), p. 10.14.1.]
I. The Molecular Design of Life 4. Exploring Proteins 4.1. The Purification of Proteins Is an Essential First Step in Understanding Their Function
Figure 4.7. Polyacrylamide Gel Electrophoresis. (A) Gel electrophoresis apparatus. Typically, several samples
undergo electrophoresis on one flat polyacrylamide gel. A microliter pipette is used to place solutions of proteins in the
wells of the slab. A cover is then placed over the gel chamber and voltage is applied. The negatively charged SDS
(sodium dodecyl sulfate)-protein complexes migrate in the direction of the anode, at the bottom of the gel. (B) The
sieving action of a porous polyacrylamide gel separates proteins according to size, with the smallest moving most
rapidly.
I. The Molecular Design of Life 4. Exploring Proteins 4.1. The Purification of Proteins Is an Essential First Step in Understanding Their Function
Figure 4.8. Formation of a Polyacrylamide Gel. A three-dimensional mesh is formed by co-polymerizing activated
monomer (blue) and cross-linker (red).
I. The Molecular Design of Life 4. Exploring Proteins 4.1. The Purification of Proteins Is an Essential First Step in Understanding Their Function
Figure 4.9. Staining of Proteins After Electrophoresis. Proteins subjected to electrophoresis on an SDS-
polyacrylamide gel can be visualized by staining with Coomassie blue. [Courtesy of Kodak Scientific Imaging Systems.]
I. The Molecular Design of Life 4. Exploring Proteins 4.1. The Purification of Proteins Is an Essential First Step in Understanding Their Function