Armstrong M., et al. Plurigaussian simulations in geosciences
Подождите немного. Документ загружается.

shows the spatial distribution of the oxidi zed and non oxidized facies from east
to west.
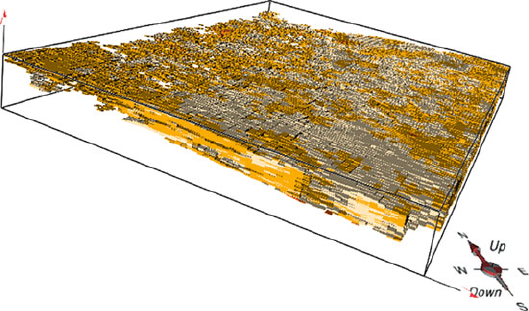
A3Dview of the simulatedshale (Fig. 8.22) illustrates the relative stationarity of
this facies in the field as visible in the vertical proportion matrix while Fig. 8.23
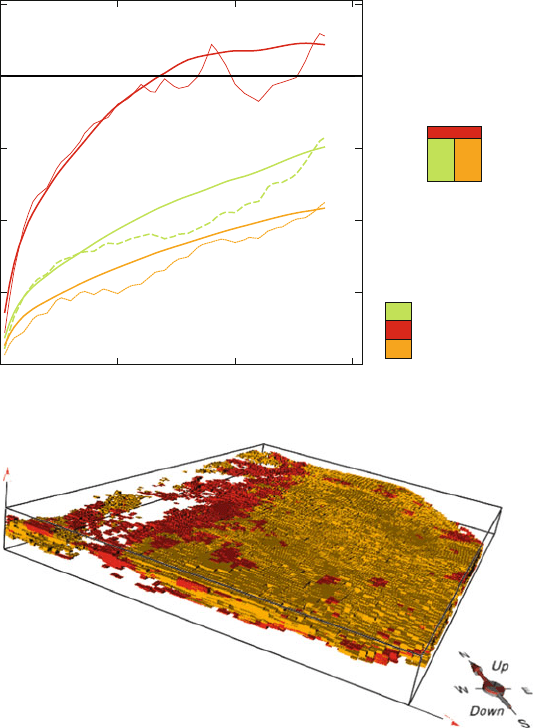
shows a 3D view of the simulated oxidized facies.
Fig. 8.19 Vertical proportion matrix (VPM)
140 8 Case Studies and Practical Examples
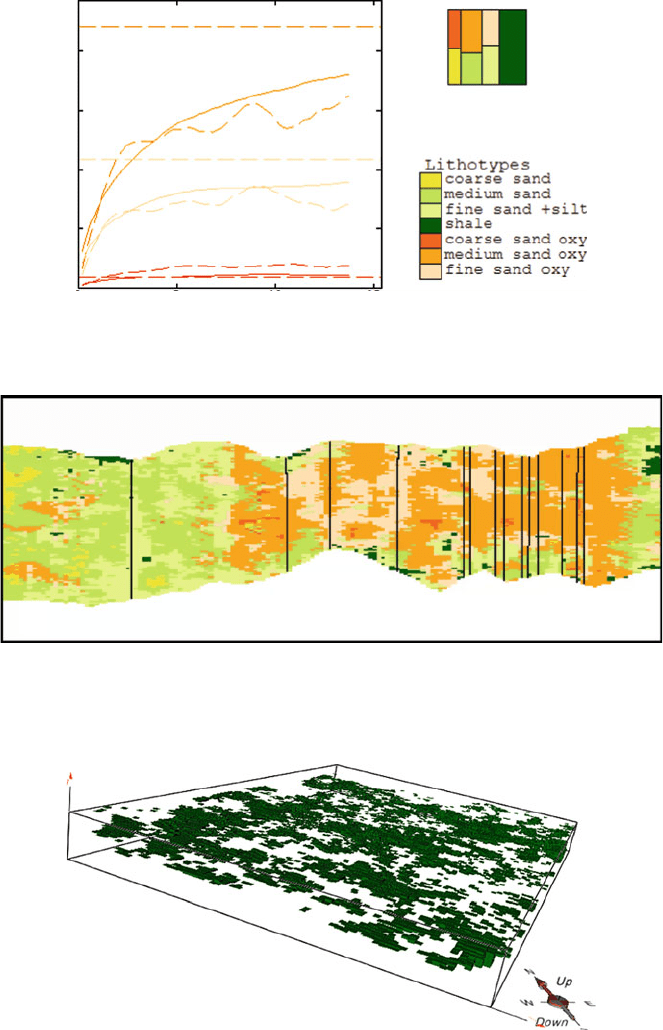
Fig. 8.20 Experimental and fitted vertical variograms for the oxidizing lithotypes
Fig. 8.21 Vertical cross-section on one of the simulations showing the seven lithotypes
Fig. 8.22 3D block model of the simulated shale facies
Mining Applications of the Plurigaussian Approach 141
Second Issue
As a result of t he deposition process, the high grade uranium is located at the
interface bet ween oxidiz ed fac ies and not oxidized ones. The idea i s to define
three domains: the non oxidized area (initial state), the oxidized area (swept by
oxidizing fluids) and area where uranium grade is high. The procedure for
transforming the geological facies and thegradesintoindicatorsisthefollowing:
the high grade indicator is obtained using a threshold on the uranium grade and in
the rest, the initial state and the oxidized one, is distinguished depending on the
oxidation factor.
Globally the high grade ore is more or less constant along the vertical axis
(see VPC Fig. 8.24). In the 3D space it is mainly located in the North West
part along a West south- North east axis (see the 3D view of the high grade
proportion upper than 30% (Fig. 8.25). This is the result of the deposition
process.
The lithotype rule was also defined based on the deposition process: the first
underlying Gaussian is affect ed to the distinction between oxidized and non
oxidized facies while the second one depends on the grade information. This choice
is confirmed by the behaviour of the experimental variograms. In fact, on the
normalized variograms (same variances for the three types equal to 1) the shapes
of oxidized and non oxidized variograms are similar to each other but are differ-
ent from the one for the high grade ore. The fit of the high grade variogram
gives directly the model for the second Gaussian. The fits of the other types is
a combination of this model and the model for the first Gaussian. (Fig. 8.26) The
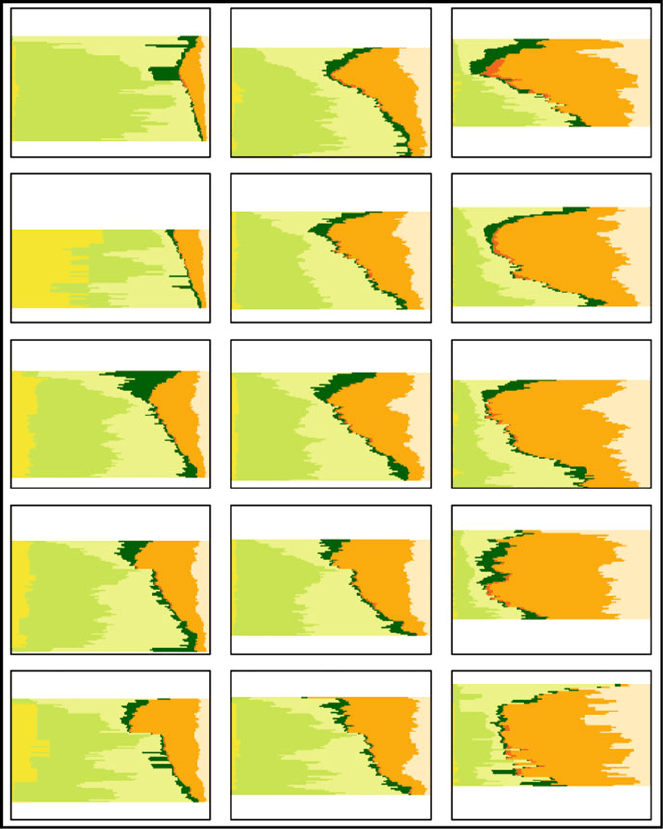
conditional simulations were then performed with all the previous parameters.
A typical simulation is shown in Fig. 8.27.
Fig. 8.23 3D block model of simulated oxidized facies
142 8 Case Studies and Practical Examples
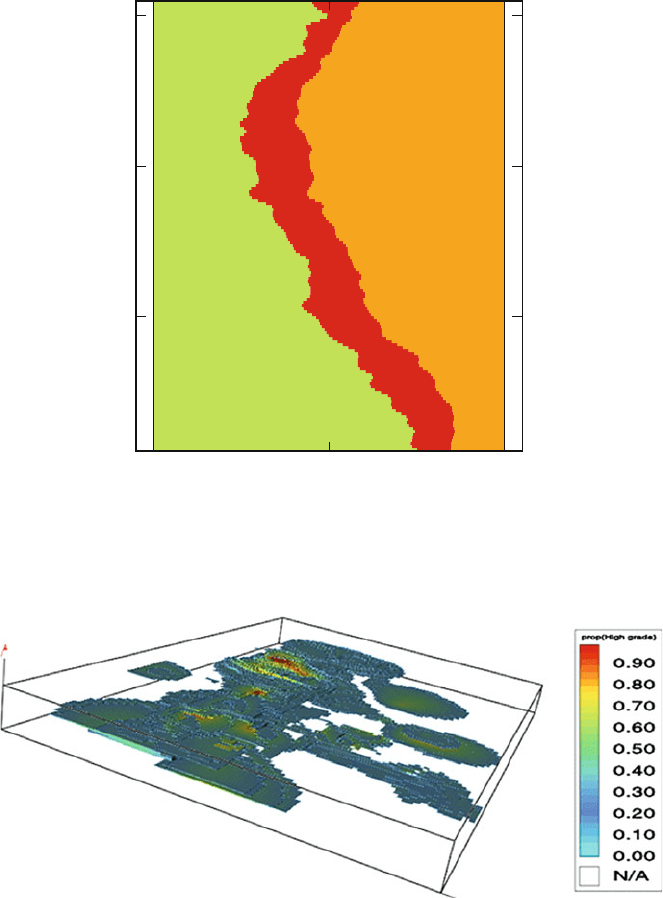
Fig. 8.25 Proportion of high grades above 30%
0.0 0.5 1.0
0.0 0.5 1.0
–50
–40
–30
–50
–40
–30
Fig. 8.24 Global vertical proportion curves for the three types
Mining Applications of the Plurigaussian Approach 143
Simulation of a Porphyry Copper Deposit: Non-sedimentary
Environment
Thiscase-studyhasbeen includedtoshowthatplurigaussiansimulationscan alsobe
used in non sedimentary geological environments. In these cases, there is no longer
any reason to use vertical proportions, as the geology is not guided by the vertical
sedimentation.
The MM copper deposit is a porphyry copper deposit near the Chuquicamata
mine. In this type of deposit, the mineralization is constrained by rising fluids
through a network of faults and joints and by the interactions of these fluids with the
Fig. 8.27 A simulation with only oxidised and high grade facies shown
Lithotypes
Init type
High grade
Oxydation
__ _
_
-----
......
Fig. 8.26 Experimental variograms (dotted lines) and fitted models (solid lines)
144 8 Case Studies and Practical Examples

pre-existing minerals. In this orebody, this network is controlled by a major sub
vertical North-South fault, called the MM fault. As the auxiliary faults and joints
principally follow this fault, the copper mineralization, which controls the working
rock types used for this study has a general North South vertical orientation. Four
rock types have been defined, corresponding to different stages of copper enrich-
ment: breccias (higher grade ore), C5 stockwork (also high grade ore), the low
grade ore C1, and the waste rock. Breccias and C5 are generally in direct contact
with the faults of joints network. The copper concentration of the fluids decreased
as they went further from this network. Their interaction with the pre-existing rocks
created the low grade rock type C1.
Further out, there was not enough copper left in the fluids to lead to mineraliza-
tion and the resulting rock type is waste. Figure 8.28 shows the distribution of the
rock types in an east-west vertical section.
Astherocktype dependsmostlyonthe distancefromthefault, it seemsnatural to
use the fault plane which is oriented in a North-South vertical direction, as the
reference level. The flattening consists in shifting the East-West coordinates to
transform the fault into a perfect North-South vertical plane. Consequently, the
BRECHAS
C5 -STOCKWORK 0.5 % CuT
C1 -ENVOLVENTE 0.1 % CuT
PISO As 2002
L E Y E N D A
CODELCO CHILE - DIVISION NORTE
PROYECTO MM
SECCION 25600
FALLA OESTE
TECHO ROCA
PIT PROYECTADO
PISO As
MODELO 2000
Techo de
Sulfuros
Techo de
Mixtos
Zona de mixtos
Zona de Oxidos
Fig. 8.28 Schematic distribution of the rocktypes. in a vertical east-west vertical section. Repro-
duced from Riquelme et al. (2008) with permission
Mining Applications of the Plurigaussian Approach 145

proportions will be plotted along an East-West direction, perpendicular to the MM
fault in the working grid (Fig. 8.29).
The rock type distribution varies perpendicular to the fault. As was mentioned,
the copper rich rock types, breccias and C5 stockwork are closer to the fault, while
the C1 and waste are more distant, but the rock types also vary in the other
directions. For example, the breccias are wider towards the top. So we decided to
use proportions which vary in all directions, hence to use a proportion matrix.
This matrix has been built from 16 local East-West proportion curves, by kriging
with a linear variogram.
With only four rock types, the rock-type rule is quite simple (Fig.8.30). The first
gaussian separates C1 from the breccias þ C5 group on one side, waste on the other
side, while the second separates Breccia and C5.
Once the rock-type rule has been chosen, the variograms can be fitted and the
orebody can be simulated. Th e goal of this simulation was to propose a block model
Fig. 8.29 Horizontal
projection view of the MM
fault, the breccias (blue) and
the drillholes (pink).
Reproduced from Riquelme
et al. (2008) with permission
Breccia
C5
C1
Waste
Fig. 8.30 Rock-type rule. The first gaussian separates C1 (green) from the richer rock types
(breccias+theC5group)ononeside,andfromthewaste (grey) on the other side, while the second
separates breccia (blue) and C5 (red). Reproduced from Riquelme et al. (2008) with permission
146 8 Case Studies and Practical Examples
without manual smoothing done by the geologis t. the new model compared favour-
ably with the block model previously designed by the mine geologist.
Figure 8.31 compares the block model provided by the geologists (top) with two
simulations. The waste rock has not been represented in the geologists model
whereas it is grey in the simulations. An extended version of this case study can
be found in Riquelme et al. (2008).
26250
8900
8800
8700
9000
9100
9200
9300
8900
8800
8700
9000
9100
9200
9300
24500 24750 25000 25250 25500 25750 26000 26250
24500 24750 25000 25250 25500 25750 26000
Fig. 8.31 Comparison between two simulations (center and below) and the block model given by
the geologist (above). The waste rock (grey on the simulations) has not been represented on the
geologist’s block model. Reproduced from Riquelme et al. (2008) with permission
Mining Applications of the Plurigaussian Approach 147
.
Chapter 9
Freeware
Introduction
In order to demonstrate the power and the flexibility of the truncated plurigaussian
method, three free programs can be downloaded from the following Web site:
http://pluridemo.geosc iences.mines-paristech.fr
PluriDemoSimu makes itpossible to visualise simple plurigaussian simulations
and to see how changes in the input parameters affect the resulting images.
PluriDemoVario illustrates the relationship between the indicator variogr am
and those of the underlying gaussian random functions (RFs for short) that are
truncated to give the indicators.
PluriDemoSet allows the user to build a random set (two facies only) using the
PluriGaussian Truncated method in a non-stationary framework.
For each program the web site also provides a set of graded exercises showing
how to run the program and how the key parameters affect the simulat ed images or
the indicator variogr ams, as the case may be.
Installation
The package is available for the following platforms:
l
Windows (XP, Vista, Windows 7) 32/64 bits
l
Linux x86 32/64 bits. Tests have been madeunder Ubuntu 9, Fedora 8, Redhat 4,
Redhat 5.
Installation Instructions for Windows Users
1. Download the archive file named pluridemo_winnt.zip and save it into a tempo-
rary directory.
M. Armstrong et al., Plurigaussian Simulations in Geosciences,
DOI 10.1007/978-3-642-19607-2_9,
#
Springer-Verlag Berlin Heidelberg 2011
149