Armstrong M., et al. Plurigaussian simulations in geosciences
Подождите немного. Документ загружается.

In this case,
g
F
i
ðx,x þ hÞ¼
1
2
P
F
i
ðxÞþP
F
i
ðx þ hÞ
fg
Pt
i1
(x) Z(x)<t
i
(x),t
i1
(x þ h) Z(x þ h)<t
i
(x þ h)½
Ifthecorrelation functionofthe gaussian functionZis r(h), the indicator variogram
is given by:
g
F
i
ðx,x þ hÞ¼
1
2
P
F
i
ðxÞþP
F
i
ðx+hÞ
no
ð
t
i
ðxþhÞ
t
i1
ðxþhÞ
ð
t
i
ðxÞ
t
i1
ðxÞ
g
rðhÞ
ðu,vÞÞdudv
¼
1
2
P
F
i
ðxÞþP
F
i
ðx þ hÞfg
1
2p
ffiffiffiffiffiffiffiffiffiffiffiffiffiffiffiffiffiffiffi
1 rðhÞ
2
q
ð
t
i
ðxþhÞ
t
i1
ðxþhÞ
ð
t
i
ðxÞ
t
i1
ðxÞ
exp
u
2
þ v
2
2rðhÞuv
2ð1 rð h Þ
2
Þ
!
dudv,
where p
Fi
(x) is the proportion of facies F
i
at point x and g
r(h)
is the bigaussian
density function. The correlation between the two gaussian variables u and v is
r(h). Once we have chosen the variogram for the gaussian function, we know r(h)
and can compute the variogram for each facies using the previous equation.
Cross-Variograms
As the cross-variogram can be written as
g
F
i
F
j
ðx,x þ hÞ¼
1
2
E1
F
i
(x)1
F
j
(x þ h)
þ E1
F
j
(x)1
F
i
(x þ h)
this becomes:
g
F
i
F
j
ðx,x þ hÞ¼
ð
t
j
ðyÞ
t
j1
ðyÞ
ð
t
i
ðxÞ
t
i1
ðxÞ
g
rðhÞ
ðu,vÞdudv
Truncated Plurigaussian Method
Variograms
We will give the equations linking the indicator variogram models to those of the
gaussians for the case with only two gaussian functions. They can easily be
extended to the case where we have more than two gaussians.
90 6 Variograms and Structural Analysis
In this case, as Z(x) is a bivariate gaussian function, C
i
(x) ∈ R
2
. The variogram
can be written:
g
F
i
ðx,x þ hÞ¼
1
2
P Z(x) 2C
i
(x)½þP Z(x þ h) 2C
i
ðx þ hÞ½
fg
P[Z(x) 2C
i
(x); Z(x þ h) 2C
i
ðx þ hÞ
g 1
Fi
(x),1
Fi
(x þ h)½¼
1
2
fP
F
i
ðxÞþP
F
i
ðx þ hÞg
ðð
C
i
ðxþhÞ
ðð
C
j
ðxÞ
g
S
ðu
1
;u
2
;v
1
;v
2
Þdu
1
du
2
dv
1
dv
2
If we let Z
1
and Z
2
be the two gaussian functions, components of the bivariate
gaussian Z, S is the covariance matrix for the four gaussian variables Z
1
(x), Z
2
(x),
Z
1
(x + h) and Z
2
(x + h) and g
S
is the quadrivariate gaussian density.
Let r be the correlation coefficient between Z
1
and Z
2.
Similarly let r
Z1
(h) and
r
Z2
(h) be the covariance functions of the two gaussians Z
1
and Z
2
. With this
information we can compute 12 of the 16 terms in the covariance matrix. The
remaining four terms depend on the cross-covariance function between Z
1
and Z
2
,
r
Z1Z2
(h), which is given by the coregionalization model of Z.
When h represents the vector yx, the matrix S is:
S ¼
1 rr
Z1
hðÞ r
Z1Z2
hðÞ
r 1 r
Z1Z2
hðÞ r
Z2
hðÞ
r
Z1
hðÞ r
Z1Z2
hðÞ 1 r
r
Z1Z2
hðÞ r
Z2
hðÞ r 1
0
B
B
@
1
C
C
A
A wide choice of coregionalization models is available.For example, we canuse the
standard linear coregionalization model where Z
1
and Z
2
are linear combinations of
independent factors. If Y
1
(x) and Y
2
(x) are independent N(0,1) gaussian functions
having the covariances r
Y1
(h) and r
Y2
(h), we can define Z
1
(x) and Z
2
(x) as
Z
1
(x) = Y
1
(x) and Z
2
(x) ¼ rY
1
(x) +
ffiffiffiffiffiffiffiffiffiffiffiffiffiffiffi
1 r
2
p
Y
2
(x)
where
r
Z1
(h) = r
Y1
(h) and r
Z2
(h) = r
2
r
Y1
(h) + ð1 r
2
Þ r
Y2
(h)
or
r
Y1
(h) = r
Z1
(h) and r
Y2
(h) =
r
Z2
ðhÞr
2
r
Z1
ðhÞ
1 r
2
:
Truncated Plurigaussian Method 91
The cross-covariance is then r
Z1Z2
(h) = rr
Z1
(h). It is an even function
r
Z1Z2
(h) ¼ r
Z1Z2
ðh), which is not true in general.
The covariance matrix S is then:
S ¼
1 rr
Z1
hðÞ rr
Z1
hðÞ
r 1 rr
Z1
hðÞ r
Z2
hðÞ
r
Z1
hðÞ rr
Z1
hðÞ 1 r
rr
Z1
hðÞ r
Z2
hðÞ r 1
0
B
B
@
1
C
C
A
Alternatively Z
2
could be the derivative of Z
1
(in a given direction) or it could equal
the first gaussian shifted by a vector “a”. That is,
Z
2
xðÞ¼
@Z
1
xðÞ
@x
i
or Z
2
(x) = Z
1
(x a)
Combinations of these are also possible. For example, one model that covers quite
a wide range of cases is:
Z
1
(x) ¼ Y
1
(x)
Z
2
(x) ¼ l
1
Y
1
(x þ a) þ l
2
Y
2
(x)
(
If we want a specific correlation r between Z
1
and Z
2
, then:
l
1
¼
r
r
Z1
ðaÞ
; l
2
¼
ffiffiffiffiffiffiffiffiffiffiffiffiffiffiffiffiffiffiffiffiffiffiffiffiffi
1
r
2
r
Z1
ðaÞ
2
s
In that case, the covariance matrix S is:
S ¼
1 rr
Z1
hðÞ
rr
Z1
h þ aðÞ
r
Z1
aðÞ
r 1
rr
Z1
h aðÞ
r
Z1
aðÞ
r
Z2
hðÞ
r
Z1
hðÞ
rr
Z1
h aðÞ
r
Z1
aðÞ
1 r
rr
Z1
h þ aðÞ
r
Z1
aðÞ
r
Z2
hðÞ r 1
0
B
B
B
B
B
B
B
B
B
B
@
1
C
C
C
C
C
C
C
C
C
C
A
where
r
Z2
hðÞ¼
r
2
r
2
Z1
aðÞ
r
Z1
ðhÞþ 1
r
2
r
2
Z1
aðÞ
r
Y2
hðÞ
As before, r
Y2
(h) is the covariance function of the second independent
gaussian Y
2.
NowweconsiderthecasewheretheconstraintsC
i
(x) and C
i
(x þ h) are
identical, equal to C
i
. This corresponds to stationary indicator functions with
92 6 Variograms and Structural Analysis

p
Fi
(x) ¼ p
Fi
(x + h) ¼ p
Fi
). If C
i
are defined as a rectangle limited by the thresh-
olds t
i1
and t
i2
for Z
1
,ands
i1
and s
i2
for Z
2
, then the equation becomes:
g 1
Fi
(x),1
Fi
(x + h)½¼P
Fi
ð
S
i2
S
i1
ð
t
i2
t
i1
ð
S
i2
S
i1
ð
t
i2
t
i1
g
S
ðu
1
;u
2
;v
1
;v
2
Þdu
1
du
2
dv
1
dv
2
Knowing the proportions, the thresholds and the covariance matrix of Z
1
and Z
2
,
it is easy to compute (and plot) the indicator variograms.
Cross-Variograms
We saw in Chap. 2 that the cross variogram model can be written as
g
FiFj
ðx,x þ hÞ¼
1
2
E1
Fi
(x)1
Fj
(x þ h)
+E1
Fj
(x)1
Fi
(x þ h)
which gives:
g 1
Fi
xðÞ;1
Fj
x þ hðÞ
¼
1
2
ðð
C
j
xþhðÞ
ðð
C
i
xðÞ
g
S
u
1
;u
2
;v
1
;v
2
ðÞdu
1
du
2
dv
1
dv
2
8
>
<
>
:
þ
ðð
C
i
xþhðÞ
ðð
C
j
xðÞ
g
S
u
1
;u
2
;v
1
;v
2
ðÞdu
1
du
2
dv
1
dv
2
9
>
=
>
;
In the stationary case where C
i
ðxÞ¼C
i
ðyÞ¼C
i
, this becomes:
g 1
Fi
(x),1
Fj
(x þ h)
¼
ðð
C
j
ðð
C
i
g
S
ðu
1
;u
2
;v
1
;v
2
Þdu
1
du
2
dv
1
dv
2
Generalisation to the Non-stationary Case
Experimental Variograms
In the non-stationary case, we can only compute the experimental non-centred
variogram.
g
exp
1
Fi
x
a
ðÞ;1
Fi
x
b
¼
1
2N
X
x
a
x
b
jj
¼h
1
Fi
x
a
ðÞ1
Fi
x
b
2
Generalisation to the Non-stationary Case 93
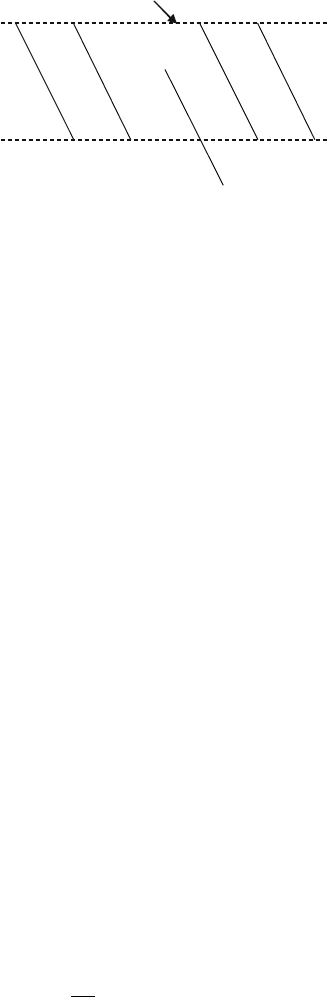
It is no longer equal to the centred variogr am. Nevertheless, if the facies can be
considered as stationaryin the strata plane, the exper imental variogram iscomputed
level by level in the plane of the strata (Fig. 6.1). Although the proportions vary
along the vertical direction (i.e. vertical after flattening), they can often be consid-
ered as constant in the horizont al plane. We call this vertical non-stationarity.
In theory we should fit all these variograms simultaneously (using the same
parameters for the gaussian function), but this has two disa dvantages:
l
In practice, we usually have hundreds of levels, and it takes too much time to
check the fit on all these levels;
l
If the data come from only a few wells, the statistical fluctuations in the
variograms computed level by level are too large, and we cannot fit these
variograms at all.
These are the reasons why we average all the variogram levels rather than fitting
a model to them all directly. It should be kept in mind that this average is no longer
a variogram but a mean variogram. It is still possible to fit it, so we have to find a
model for it.
The experimental variogram in the directions of this plane can then be consid-
ered as an average of centred variograms (with experimental means which change
level by level).
Remarks. In the case of vertical non stationarity, it is necessary to treat the
horizontal variogram (average of centred variograms) and the vertical variogram
(non centred from start) separately.
Anotherpointtonoteisthatwhenallthewellscrossallthe levelsvertically,there
is no difference between this average level by level and the average in the whole
space. Otherwise, these averages are different. We usually compute the average
directlythroughoutthespacewhenthestratacannotbeconsideredashomogeneous.
For the cross variograms, we also compute the non-centred cross variogram
g
exp
1
Fi
xðÞ;1
Fj
x þ hðÞ
¼
1
2N
X
x
a
x
b
jj
¼h
1
Fi
x
a
ðÞ1
Fi
x
b
1
Fj
x
a
ðÞ1
Fj
x
b
x
1
+ hx
2
+ hx
4
+ h
x
3
+ h
x
5
+ h
yes yes yes yesno
Variogram level
x
1
x
2
x
4
x
3
x
5
Fig. 6.1 Variogram level
94 6 Variograms and Structural Analysis
Depending on the type of stationarity (or otherwise), the average is calculated over
the whole space, or level by level, as for the simple variograms.
When the cross variograms are computed level by level, we average them again
to obtain a mean cross variogram.
Indicator Variogram Model (Truncated Gaussian Model)
We now present the variogram model for the non-stationary case. Earlier in the
chapter we saw that for the statio nary case, the variogram for the indicator function
1
Fi
(x) is:
g
Fi
ðx,x þ hÞ¼
1
2
Pt
i1
Z(x)<t
i
½þPt
i1
Z(x þ h)<t
i
½
fg
Pt
i1
Z(x)<t
i
;t
i1
Z(x þ h)<t
i
½
As the thresholds now vary with location, the equivalent equation is:
g 1
Fi
(x),1
Fi
(xþh)½¼
1
2
Pt
i1
(x)Z(x)<t
i
(x)½þPt
i1
(xþh)Z(xþh)<t
i
(xþh)½
2P t
i1
(x)Z(x)<t
i
(x), t
i1
(xþh)Z(xþh)<t
i
(xþh)½
where t
i1
and t
i
are the thresholds for the facies F
i
. This can be written as:
g[1
Fi
(x),1
Fi
(x þ h)] ¼
1
2
P
Fi
ðxÞþP
Fi
ðx þ hÞ
ð
t
i
ðxþhÞ
t
i1
ðxþhÞ
ð
t
i
ðxÞ
t
i1
ðxÞ
g
rðhÞ
ðu,vÞdudv
8
>
<
>
:
9
>
=
>
;
¼
1
2
n
P
Fi
ðxÞþP
Fi
ðx þ hÞ
o
1
2
1
p
ffiffiffiffiffiffiffiffiffiffiffiffiffiffiffiffiffiffiffiffi
1 rðhÞ
2
q
ð
t
i
ðxþhÞ
t
i1
ðxþhÞ
ð
t
i
ðxÞ
t
i1
ðxÞ
exp
u
2
þ v
2
2rðhÞuv
21 rðhÞ
2
!
dudv
where p
Fi
(x) and p
Fi
(x + h) are the proportions of facies F
i
at po ints x and x + h,
and g
r(h)
is the same bigaussian density functi on as in the stationary case. The cross
variogram model is given by:
g 1
Fi
xðÞ;1
Fj
x þ hðÞ
¼
1
2
ð
t
j
xþhðÞ
t
j1
xþhðÞ
ð
t
i
xðÞ
t
i1
xðÞ
g
r hðÞ
u,vðÞdu dv þ
ð
t
i
xþhðÞ
t
i1
xþhðÞ
ð
t
j
xðÞ
t
j1
xðÞ
g
r hðÞ
u,vðÞdu dv
8
>
<
>
:
9
>
=
>
;
Generalisation to the Non-stationary Case 95
Variogram and Cross-Variogram Model (Truncated Plurigaussian
Method, two Gaussian Functions)
We have seen that
g[1
Fi
(x),1
Fi
(x þ h)] ¼
1
2
P
F
i
(x) + P
F
i
(x + h)
fg
ðð
C
i
ðxþhÞ
ðð
C
j
ðxÞ
g
S
ðu
1;
u
2
;v
1
;v
2
Þdu
1
du
2
dv
1
dv
2
where S is the same covariance matrix as in the stationary case (as the gaussian
functions are stationary).
In the case when the constraint C
i
ðxÞ is given by a rectangle in R
2
, which can be
written as:
C
i
xðÞ¼t
i1
xðÞ;t
i2
xðÞ½s
i1
xðÞ;s
i2
xðÞ½
The variogram equation becomes:
g 1
Fi
xðÞ;1
Fi
xþhðÞðÞ¼
1
2
p
Fi
xðÞþp
Fi
xþhðÞ2
ð
s
i2
xþhðÞ
s
i1
xþhðÞ
ð
t
i2
xþhðÞ
t
i1
xþhðÞ
ð
s
i2
xðÞ
s
i1
xðÞ
ð
t
i2
xðÞ
t
i1
xðÞ
g
S
u
1
;u
2
;v
1
;v
2
ðÞdu
1
du
2
dv
1
dv
2
2
6
4
The cross variogram mode l is given by:
g 1
Fi
xðÞ;1
Fj
x þ hðÞ
¼
1
2
ðð
C
j
xþhðÞ
ðð
C
i
xðÞ
g
S
u
1
;u
2
;v
1
;v
2
ðÞ
8
>
<
>
:
du
1
du
2
dv
1
dv
2
þ
ðð
C
i
xþhðÞ
ðð
C
j
xðÞ
g
S
u
1
;u
2
;v
1
;v
2
ðÞdu
1
du
2
dv
1
dv
2
9
>
=
>
;
Comparing Variogram Models for Indicators
and Gaussian Functions
Only the stationary case will be discussed here in detail. In the non stationary case,
the proportions vary and this has various effects on the individual variograms. The
impact on the mean variogram is much more complex as can be seen from the
examples given in the section on “variogram fitting”.
96 6 Variograms and Structural Analysis
Sill of the Indicator Model
In the stationary case, the sill of the indicator variogram for facies F
i
is equal to
p
Fi
(1p
Fi
). As there is no link between the sill of the indicator variograms and that
ofthegaussians, wecan choose any sill forthe latter and the standar d normal N(0,1)
is the simplest choice. In the case of non stationarity, we can no longer speak of a
sill. The variogram shape for long distances can be rather complicated; it need not
stabilize. This often happens for vertical variograms. This long distance shape is
completely controlled by the proportions.
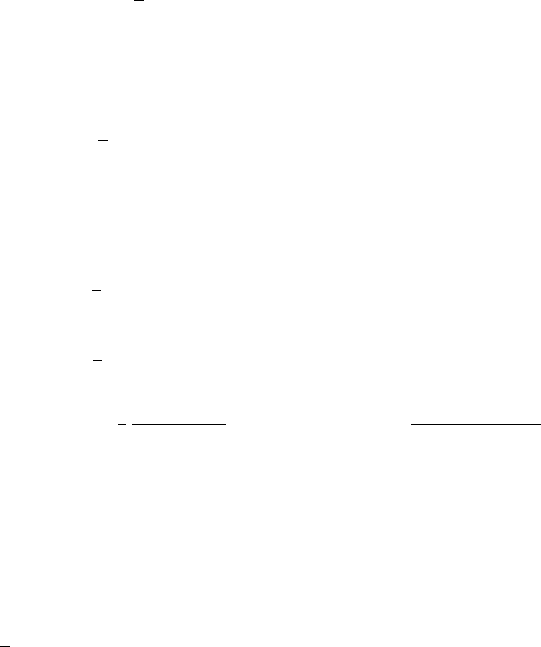
Shape of the Indicator Model
We are now going to see which features of the variogram of the gaussian functions
reappear in the indicator variogr am. Figure 6.2 shows a gaussian variogram with a
range of 50, and the corresponding indicator variogram for the truncated gaussian
model. We already know (see Chap. 3) that the indicator variogram cannot have a
zero derivative at the origin. We see here that the indicator variogram is linear near
the origin. The curvature near the origin which is characteristic of the gaussian
variogram has disappeared.
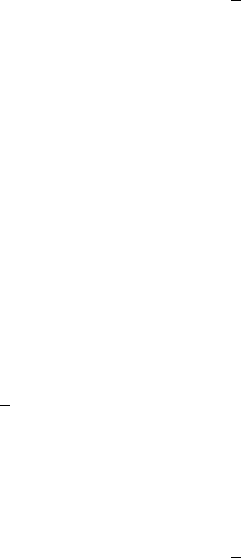
Now look at Fig. 6.3 which shows an exponential variogram with the same
practical range of 50, and the corresponding indicator variogram (same propor-
tion and sam e rock-type rule as in Fig. 6.2). In this case, the overall shape of the
indicator variogram for the exponential is closer to that of the exponential than
for the gaussian variogram in Fig. 6.2. In gene ral, there is less diff erence
between the shapes of the indicator variograms than between those of the
underlying gaussians. So it is not possible to determine the type of model or
its param eters from the indicator variogram. In top of this as will be seen in the
next section, changes in the proportions have are marked impact on their shape.
So the choice between a gaussian variogram and an exponential is made by
studying the consequences of this choice on the resulting simulations, especially
the continuity and regularity of each facies, rather than the shape of the
variogram.
Practical Range of the Indicator Model
The previous figures correspond to the facies F
1
in the rocktype rule given in
Fig. 6.4. Figure 6.5 shows the indicator variogram for facies F
2
using the same
exponential variogram and the same proportion (33%) as in Fig. 6.3. These figures
clearly show that the practical range of the indicator variogram depends on the
position of the corresponding facies in the rocktype rule as well as the practical
range of the gaussian function variogram.
Comparing Variogram Models for Indicators and Gaussian Functions 97
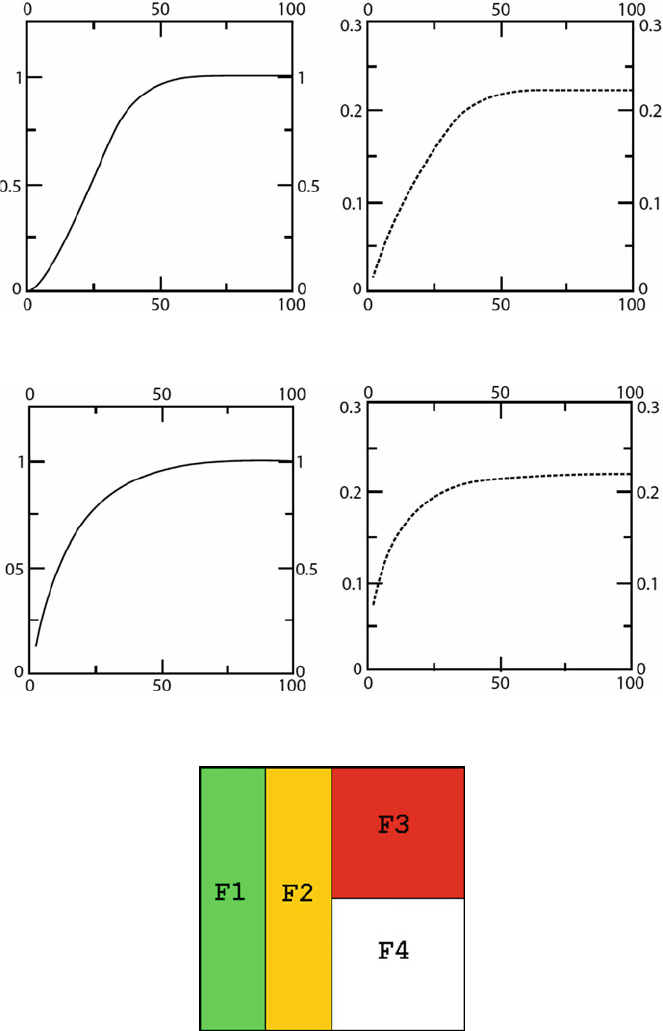
Fig. 6.2 Gaussian variogram (left) and the corresponding indicator variogram ( right )
Fig. 6.4 Rock-type rule
Fig. 6.3 Exponential variogram (left) and the corresponding indicator variogram (right)
98 6 Variograms and Structural Analysis
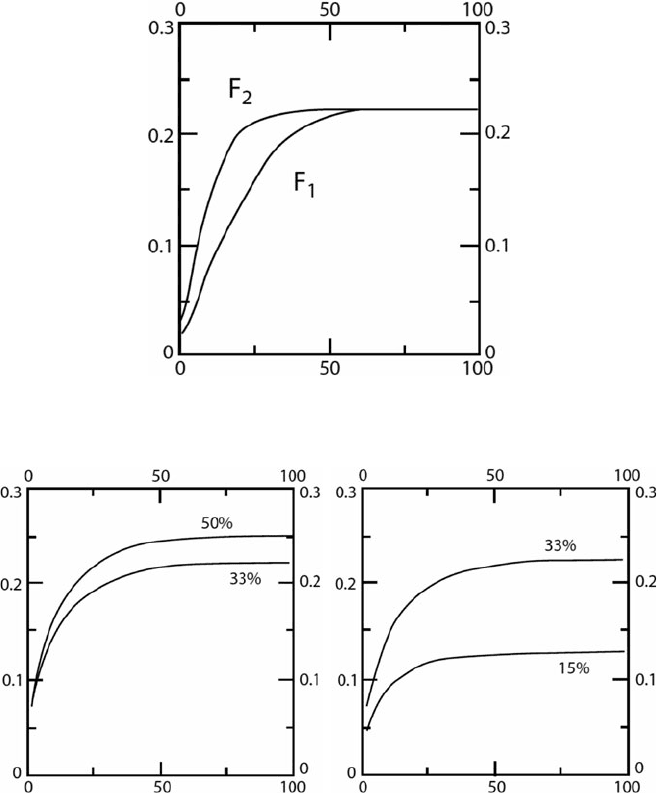
Figure 6.6 shows what happens to this indicator variogram when the proportion
is increased from 33 to 50% or decreased to 15%, respectively. As expected in the
first case, the sill increases (a proportion of 50% gives the maximum sill in the
stationary case). We see that the practical range has increased too. Inthe latter case,
the practical range decreases as does the sill. This shows that in the same way that
we cannot choose the variogram model for the gaussian function just by looking at
the shape of the indicator variogram, we cannot deduce its range directly from that
of the indicator variogram.
Fig. 6.5 Comparison of the indicator variograms for facies F
1
and F
2
Fig. 6.6 Comparison of the indicator variograms for facies F
2
when the proportion is increased
from 33% to 50% (left) and decreased from 33% to 15% (right)
Comparing Variogram Models for Indicators and Gaussian Functions 99