Armstrong M., et al. Plurigaussian simulations in geosciences
Подождите немного. Документ загружается.

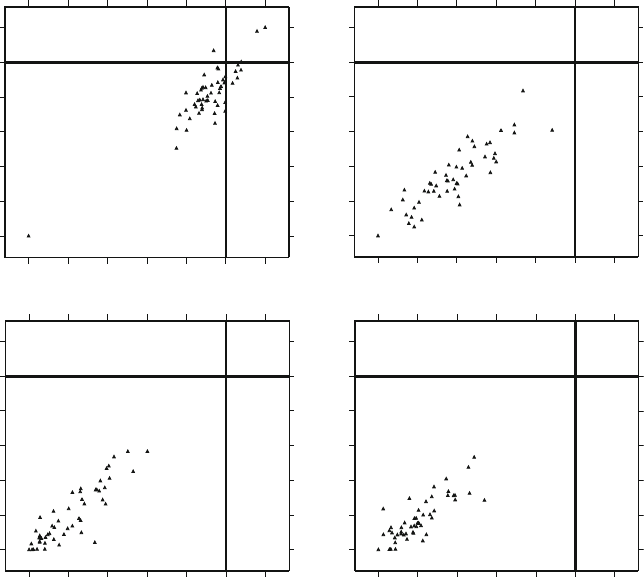
many Gibbs samplers in parallel and study the results after a certain number of
iterations. Figure 7.8 plots the first and second components for 50 parallel runs.
Figure 7.8a shows their locations after a single iteration; both started out from an
initial value of þ5. Figures 7.8b–d give the output after 5, 10 and 50 iterations.
As expected, the centre of the cloud moves downwards and disperses outward
from this. Initially the distribution is far from the target cloud but as the number
of iterations increases, it steadily tends toward it.
0123456
0
1
2
3
4
5
6
0123456
0
1
2
3
4
5
6
0123456
0
1
2
3
4
5
6
0123456
0
1
2
3
4
5
6
Fig. 7.8 The values of the first and second components after 1 iteration (top left), then 5 (top
right), 10 (bottom left) and 50 iterations (bottom right) starting out from initial values of þ5 (as
indicated by the crosshairs)
120 7 Gibbs Sampler
Chapter 8
Case Studies and Practical Examples
Choosing Which Simulation Method to Use
Simulation methods fall into two broad classes: pixel methods and object-based
methods. Before presenting any practical examples, it is important to decide which
methodwouldbethemostappropriatefortheproblemunderstudy.Sowefirstreview
theprosandconsof twoclassesof models,sequence-based pixelmethodssuchasthe
truncated gaussian and plurigaussian simulations, and object-based methods, in par-
ticularbooleansimulations.As thisbookfocusesonplurigaussiansimulations,we do
not intend to present boolean simulations here. Interested readers can consult Math-
eron (1968, 1975), Lantue
´
joul (1997a, b, 2002) Chile
`
s and Delfiner (1999), and
Molchanov (1997). Sequence-based pixel methods and boolean simulations can also
be combined to get the best of bothapproaches. These are called nested simulations.
Sequence-Based Pixel Models
As their name suggests, sequence-based models are well suited to simulating
geological configurations where lithotypes are organised in sedimentary sequences.
Within a sedimentary sequence, lithotypes are correlated both vertically and hori-
zontally. According to Walther’s law, vertical successions of lithotypes also imply
a lateral correlation between the lithotypes. Another advantage of pixel simulations
is that they realistically reproduce the facies interfingering. Sedimentary sequences
occur at different scales, and their organisation is a function both of auto and
allocyclic processes. For example, fluvial channel sequences are characterised by
a particular succession of lithotypes from base to top as the channels filled. The
progradation of a shoreface which is mostly controlled by relative sea-level varia-
tions also shows a typical vertical succession of facies from offshore to foreshore.
Over the past fifteen years, tremendous progress has been made in seque nce
stratigraphy and this has led to a muc h better understanding of the facies architec-
ture of depositional sequences of different orders, in a wide range of depositional
environments.
M. Armstrong et al., Plurigaussian Simulations in Geosciences,
DOI 10.1007/978-3-642-19607-2_8,
#
Springer-Verlag Berlin Heidelberg 2011
121
Even though the relative volume of facies and their geometric organisation (the
facies partitioning) changes according to sequence organisation and although the
sequences are usually non-stationary, proportion curves have proved to be a simple
but highly effective tool for imaging sequences and for quantifying the associated
non-stationarity. As they measure the relative proportion of lithofacies, both verti-
cally and horizontally, they provide a good way of describing the spatial distribu-
tion of the lithofacies. They can guide the geologist in his interpretation and can
help to define the reservoir layering (Eschard et al. 1999).
Vertical proportion curves give information on the facies partitioning within the
sequences and indicate thestratigraphic levels where the main vertical permeability
barriers can be expected, which is important in reservoir characterisation.
Computing horizontal proportion curves also helps in understanding the spatial
distributionofthelithofaciesandthegeometryof thereservoir.Theirrepresentativity
depends on the well spacing and distribution in the area to be simulated. When
calculated in different directions across the field, they can show whether there are
any major lateral facies variations in the study area. Furthermore, they can aid in
deciding whether there is non-stationarity. When the relative proportions of facies
vary significantly laterally within a reservoir unit, then non-stationarity is present.
In sequence-based pixel models, the correlation between facies is quantified by
the vertical and horizontal variograms. In standard geostatistical studies, the range
of the variogram has a direct geological significance; here the relationship is
indirect. It is a function of the size of the heterogeneity, but also of its spatial
frequency. The type of variogram used in the simulat ions also has a strong impact
on the way the simulated facies are organised. Exponential variograms, for exam-
ple, are appropriate when facies transition is progressive. On the contrary, gaussian
variograms generate more "rounded" shapes in simulations.
Many depositional systems can be simulated well by sequence-based pixel
approaches. They can handle carbonate depositional systems, which are often char-
acterised by a cyclic organisation of facies and progressive facies interfingerings. In
clastic depositional environments, the approach is also suitable for deltaic or shore-
face sediments which are organised in transgressive-regressive cycles. Internal
heterogeneity within fluvial sand sheets can also be simulated in this way. These
types of reservoirs often show an internal sequential organisation which can be
reproduced easily by sequence-based models.
One difficulty in the method is computing reliable horizontal variograms from
wells because the well spacing is generally greater than the mean heterogeneity
size. Different variogram ranges can then be tested, and the one which provides
the best fit with production data is chosen (Eschard et al. 1998). Alternatively, data
bases on analogous reservoirs or outcrops can be used to give an idea of the range.
Object-Based Models
Object-based models were designed to simulate geological objects which have a
well-defined geometry. These generally correspond to sedimentary bodies isolated
122 8 Case Studies and Practical Examples
in a non-reservoir matrix (e.g. fluvial channels in floodplain mudstones). Similarly,
shale breaks with a specific geometry within a massive sandstone unit can also be
generated as objects. Different types of objects can be simulated together. Attrac-
tion or repulsion functions can also be applied to promote or prevent connections
between different types of objects. Objects also can be superposed with erosion or
preservation rules. The vertical frequency of the objects can be computed at dif-
ferent levels from the well data.
Generally speaking, object-based simulations require a great deal of a priori
geological information. First, the geologist has to determine and cla ssify the differ-
ent types of objects from the well data. Then, he has to impose a simplified shape
on them. This requires a good knowledge of the geological setting, and also the
possibility of consulting reservoir data bases containing the geometry (width versus
thickness, etc) and shapes (sinuosity, etc) for each depositional environment. This
information generally comes from outcrop studies, from observations of compara-
ble modern depositional environments or from well-documented subsurface fields.
It is generally summarised in the form of cross plots and frequency diagrams in
which the variability of the measured parameters is shown. This variability is often
highforagivensedimentaryobjectbecausethe shapes andtheamalgamationrateof
the objects depend on their location within a sequence (Eschard et al. 1999). During
periodswhenthereislittlespaceavailable forsedimentation,channels deeplyincise
the floodplain mudstones, and the amalgamation rate of fluvial channels is high.
When this space is large, the floodplain aggrades, and channels become less incised
infloodplain mudstones. Althoughthis type of information is critical for controlling
the object size, it is rarely available in reservoir data bases.
Siliclastic reservoirs can often be simulated by object based methods. The mos t
classical objects that are simulated with this approach are fluvial channels and
crevasse splays in a matrix composed of floodplain mudstones. Channels can
either be straight or sinuous, isolated in the floodplain or amalgamated. Crevasse
splays are connected to the channels.
Nested Simulations
Nested simulations combine object and sequence-based pixel models. Typically,
the objects are simulated first, then filled with lithotypes using a sequence-based
simulation. This approach is generally used to simulate large geological objects
which present internal heterogeneities. For example, the heterogeneity in fluvial
and estuarine channels corresponds to mudstone plugs deposited within the chan-
nels. The object, the channel, is simulated first, then filled by heterogeneous
material using a sequence-based algorithm.
A similar approach was used by (Cozzi et al. 2002; Felletti 2004) for simulating
turbidites. Rather than using objects to define the outer boundary of the turbidite
units he kriged the exterior contours and then used mono-gaussians and factorised
exponential variograms.
Choosing Which Simulation Method to Use 123
Building up the Reservoir or Orebody Model
The first step in a plurigaussian simulation of an orebody or a reservoir is to
calculate the proportions of each facies. But even before doing this, we have to
make a series of preliminary choices. We have to define the lithotypes to be studied,
to divide the reservoir or orebody into units, to choose the references levels to be
used for flattening each unit and finally to choose the parameters of the grid to
be simulated.
Step 1: Defining the Lithotypes
The lithotypes constituting the orebody or reservoir have to be defined from the
available data: core samples, well logs and seismic data. They have to honour
the geological information, and where applicable, the petrophysical information.
In general, the geologists define more facies than can reasonably be simulated.
So these have to be grouped into lithotypes.
The definition adopted is crucial, firstly in the data integration process and later
in the simulations themselves. For example, as well as reproducing the geology of
the reservoir realistically, reservoir simulations must reproduce the key reservoir
properties (porosity, relative permeability, capillary pres sure, etc) from a fluid flow
point of view. This implies reconciling the geological and petrophysical descrip-
tions of the reservoir when the lithotypes are first defined. Furthermore, the litho-
type data base must be homogeneous in all the wells.
Step 2: Dividing Reservoir or Orebody into Units
Reservoirs generally consist of several stacked units.Their geology may differ from
one unit to another. So each unit must be simulated independently with different
parameters. Variogram ranges and anisotropies are generally different for each of
the units. Sometimes the geostatistical techniques used can vary from one unit
to another, depending on their geology. It is not possible to correlate lithotypes
across unit boundaries, and moreover the simulation grid follows the geometry of
the units. This is why the definition of the reservoir units is a such critical step in
reservoir modelling.
Step 3: Defining the Reference Level
The reference level for the simulation is a specific geological layer which is used to
restore the geom etry of the orebody or reservoir at the time of deposition. This level
musthave been deposited horizontallyduring sedimentationand should, if possible,
124 8 Case Studies and Practical Examples
correspond to a time line. The reservoir is then flattened using this as the reference
level. Different reference levels can be used for each reservoir unit, or one can serve
for several of them.
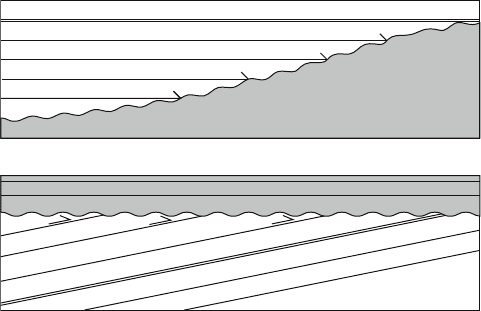
As for the definition of the lithotypes, the choice of the reference level has a
marked impact on the result of the simulation. For example, onlap or toplap
configurations can be produced depending on the choice of a reference level with
regards to the unit geometry (Fig. 8.1).
Step 4: Choosing the Grid Spacing
The g rid size is in theory directly dependent on the size of the heterogeneities to be
reproduced in the simulation. The detail needed in a simulation also depends on the
recovery process used to producethe reservoir. Gas is less sensitive thanoil to small
scale reservoir heterogeneities. Fields developed with horizontal wells generally
require very detailed reservoir models. From a geological point of view, it is
tempting to simulate as much detail as possible, but in prac tice, the number of
cells is limited by computer capacity. Because of the limitations on fluid flow
simulators, the fine grid simulated has to be upscaled to a coarser one. Within
each cell of the latter grid, the upscaling algorithm has to summarise all the values
in the fine grid in a single value. This is quite simple for porosity where it means
taking the average, but it is more difficult for permeability. Only approximate
solutions exist (unless we run a fluid flow simulator for each cell of the coarse
grid, and that would be prohibitively time consuming). Consequently many differ-
ent upscaling techniques exist and so differences may appear in the simulation
depending on which upscaling method is applied, especially when the number of
cells is very large.
REFERENCE LEVEL
REFERENCE LEVEL
“TOPLAP”
“ONLAP”
EROSIONAL SURFACE
EROSIONAL SURFACE
Fig. 8.1 Onlap (above) or toplap (below) configurations are produced depending on the choice of
a reference level relative to the unit geometry
Building up the Reservoir or Orebody Model 125
Petroleum Applications of the Plurigaussian Approach
The geostatistical methods presented above have their limitations when applied in
complex geological settings. In some cases, the reservoir architecture presents
complex facies transitions which cannot be simulated with mono-gaussian techni-
ques. Similarly, boolean models are only suitable when only a few type s of
sedimentary bodies are present and when their shapes are well defined. The main
advantage of the plurigaussian approach is its ability to handle complex facies
relationships, both vertically and laterally, in a pixel simulation. For example, it is
possible to impose different anisotropies onto the gaussian functions. Furthermore,
different types of variograms each with its own range and anisotropy can be used
for each gaussian function. The combination of all these parameters makes the
approach very flexible.
Constructing the Lithotype Rule with Geological Constraints
As the theory of the lithotype rule construction has already been described, we will
illustrate it with several examples to show how the rules can be chosen a priori
depending on the geological context. As usual, lithotypes are represented by
different colours and the surface occupied by each one in the matrix is a function
of the relative proportion of facies computed in wells. Complex facies transitions
can then be reproduced by changing the relative position and surface of the
lithotype in the matrix.
If only one gaussian function is used, the lithotype rule only shows superposed
bands, with each band representing a lithofacies. When colours are in contact in the
lithotype rule, the corresponding lithotypes will be connected in the simulation.
Consequently the ordering of the facies in the lithotype rule must then respect a
sedimentary sequence in order to correctly reproduce facies inter-fingerings in the
simulation. One of the most common sequences encountered corresponds to the
progradation of a shoreface (top ofFig.8.2), in whichoffshore, shoreface,foreshore
and coastal plain deposits are organised in a prograding sequence. Its lithotype rule
is also shown in Fig. 8.2.
Simulation of Reservoir with Complex Facies Transitions
The lithotype rule also makes it possible to simulate complex geological settings,
especially in carbonate depositional systems. For example, it is difficult to simulate
the irregular shape and complex internal architecture of algal or reefal bioherms
with classical object or sequence based models (Van Buchem et al. 2000). In this
case, the lithotype rule is used together with the vertical proportion curve as a kind
of facies substitution diagram to reproduce the sequential organisation of the facies.
126 8 Case Studies and Practical Examples
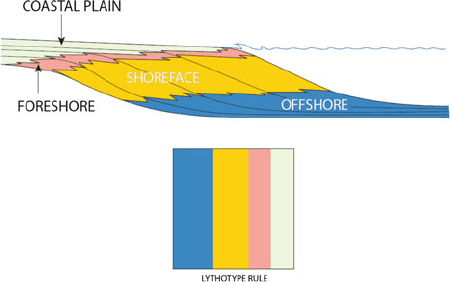
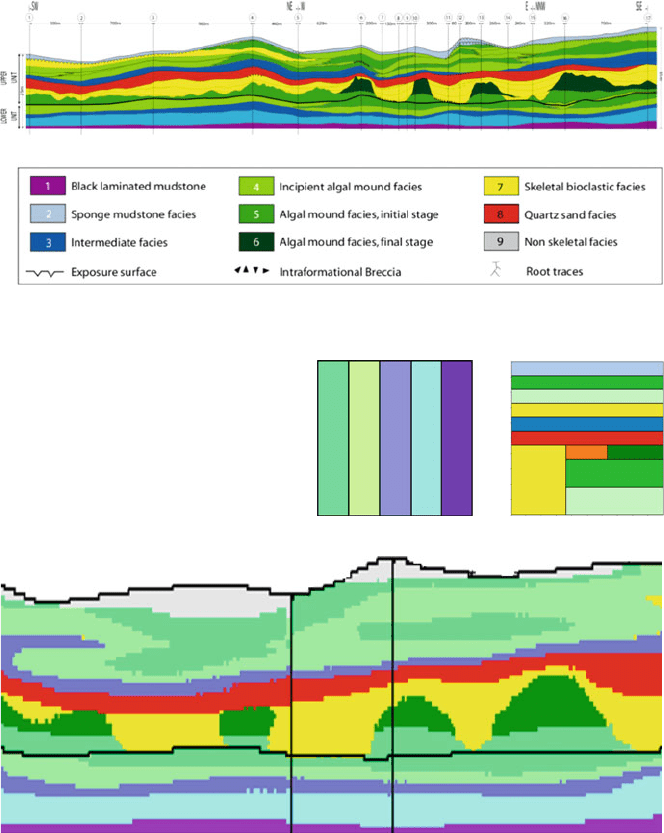
Figure 8.3 shows algal mounds in the Paradox basin, of Pennsylvanian age,
whichwere studiedin outcrops along the SanJuan River (Grammer etal. 2000; Van
Buchem et al. 2000). The algal bioherms correspond to bioconst ructions with
irregular rounded shapes which were constructed in a mixed carbonate and silici-
clastic open shelf. The carbonate shelf first prograded (facies 1–3), and then when a
certain water depth was reached, incipient mounds (facies 4) started to develop in
the shelf setting.
After this initial stage, the mounds themselves started to grow, and different
stages of const ruction have been observed (facies 5: initial stage, facies 6: final
stage). At the end, the mounds have an irregular rounded shape with a height of
more than 20 m compared to the surrounding shelf. When the algal mound growth
stopped, the inter-mounds troughs where progressively filled by in situ shelf sedi-
mentsandmaterial fallingfrom the mounds.Thesedeposits now formflanking beds
in outcrops (facies 7), with the beds onlapping the mound relief.
Finally, clastic deposits (facies 8) were deposited in the shelf setting during
subsequent relative sea-level drops. On top of the sequence, karstification often
restricted marine carbonates (facies 9) during emersion.
The lithotype rule corresponding to this complex geological setting is shown in
Fig. 8.4. Firstly, the series was divided in two units: the lower unit corresponds to
the platform progradation, whereas the algal mounds are located in the upper unit.
The lithotype rule of the lower unit is simple as only one gaussian function is used
for its simulation. Its vertical proportion curve also reflects the progradational
pattern of the shelf.
In the upper unit, the lithotype rule is more complex because of the spatial
organisation of the mounds and intermound facies. The intermound facies (facies 7)
can be in contact with the two mounds facies (facies 5 and 6) and with the
sandstones capping both the mounds and the inter-mounds deposits (facies 8).
The simulation in Fig. 8.5 reproduces the geometry of the mounds in this shallow
marine platform setting, very realistically both in section and in plan view.
Fig. 8.2 Lithotype rule with
only one gaussian function
used to simulate a prograding
sequence. Facies ordering is
respected in the rule
Petroleum Applications of the Plurigaussian Approach 127
Plurigaussian simulations are particularly suitable for simul ating interdependent
phenomena which interacted during sedimentation or just afterwards. Moreover,
the two phenomena can have different anisotropies, and can be correlated or not.
Fig. 8.4 Lithotype rules for
the upper (on the right) and
lower units of Paradox basin
Fig. 8.3 Geological model of Pennsylvanian algal mounds in outcrops (from Galli et al. 2006)
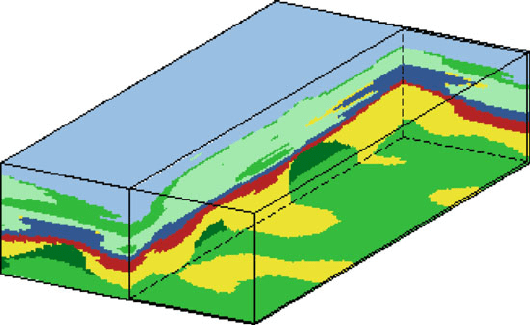
Fig. 8.5 Cross section in a simulation of the Pennsylvanian algal mounds using the pluri-gaussian
approach. The mound geometry is realistically reproduced (compare with the geological model in
Fig. 8.3)
128 8 Case Studies and Practical Examples
The effects of the primary diagenesis, which affect the sediments just after burial,
can be simulated with this approach.
The Paradox basin algal mounds described earlier are a good example of the
effects of primary diagenesis. During relative sea-level drops, the topmost part
of the mounds was altered when the mound top is emerged. This alteration is
a function of the initial carbonate texture and porosity. The flanking beds which
were deposited after this episode, were not affected. A new facies corresponding
to this alteration of the reef was added into the lithotype rule (facies 9). It is in
contact with both the flanking beds laterally, the mound core below and the sand-
stones above. The simulation in Fig. 8.6 reproduces the altered facies capping
the mounds.
Simulation of the Effects of Primary Diagenesis
in Complex Reservoir
A synthetic case study of a reef reservoir was carried out in order to test the ability
of the plurigaussian method to simulate this type of reservoir. It is based on the
Miocene reefs observed in subsurface by Gr
€
ostch and Mercadier (1999). In this
synthetic case (Fig. 8.7), the reef growth occurs in three stages. Each stage is
characterised by a specific organisation of the facies. The basal unit (unit III)
corresponds to the initial stage of the reef growth when no lagoon had developed
inside the reef. The middle unit (unit II) correspo nds to the growth stage of the reef.
Back-reef and lagunal deposits were well developed inside the reef. The topmost
layers of unit II were cemented during a relative sea-level drop when the topmost
part of the reef emerged. Unit I is the final stage of the reef growth. According to
Fig. 8.6 Simulation showing the altered facies capping the mounds. The altered facies corre-
sponds to the light grey colour on top of the dark algal mound
Petroleum Applications of the Plurigaussian Approach 129