Adlard E.R. (ed.) Chromatography in the Petroleum Industry
Подождите немного. Документ загружается.

32
Chapter
I
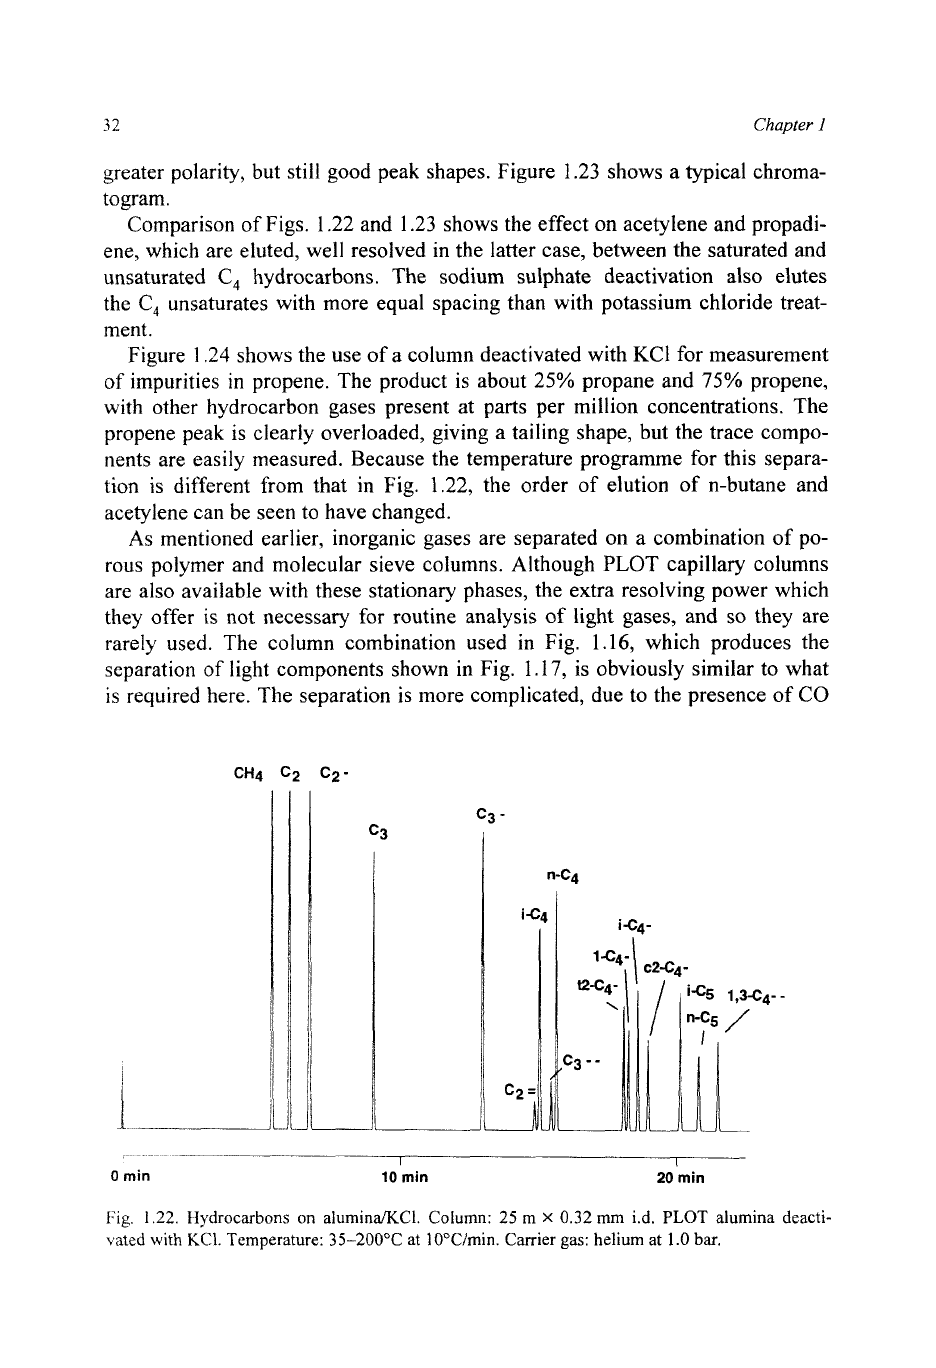
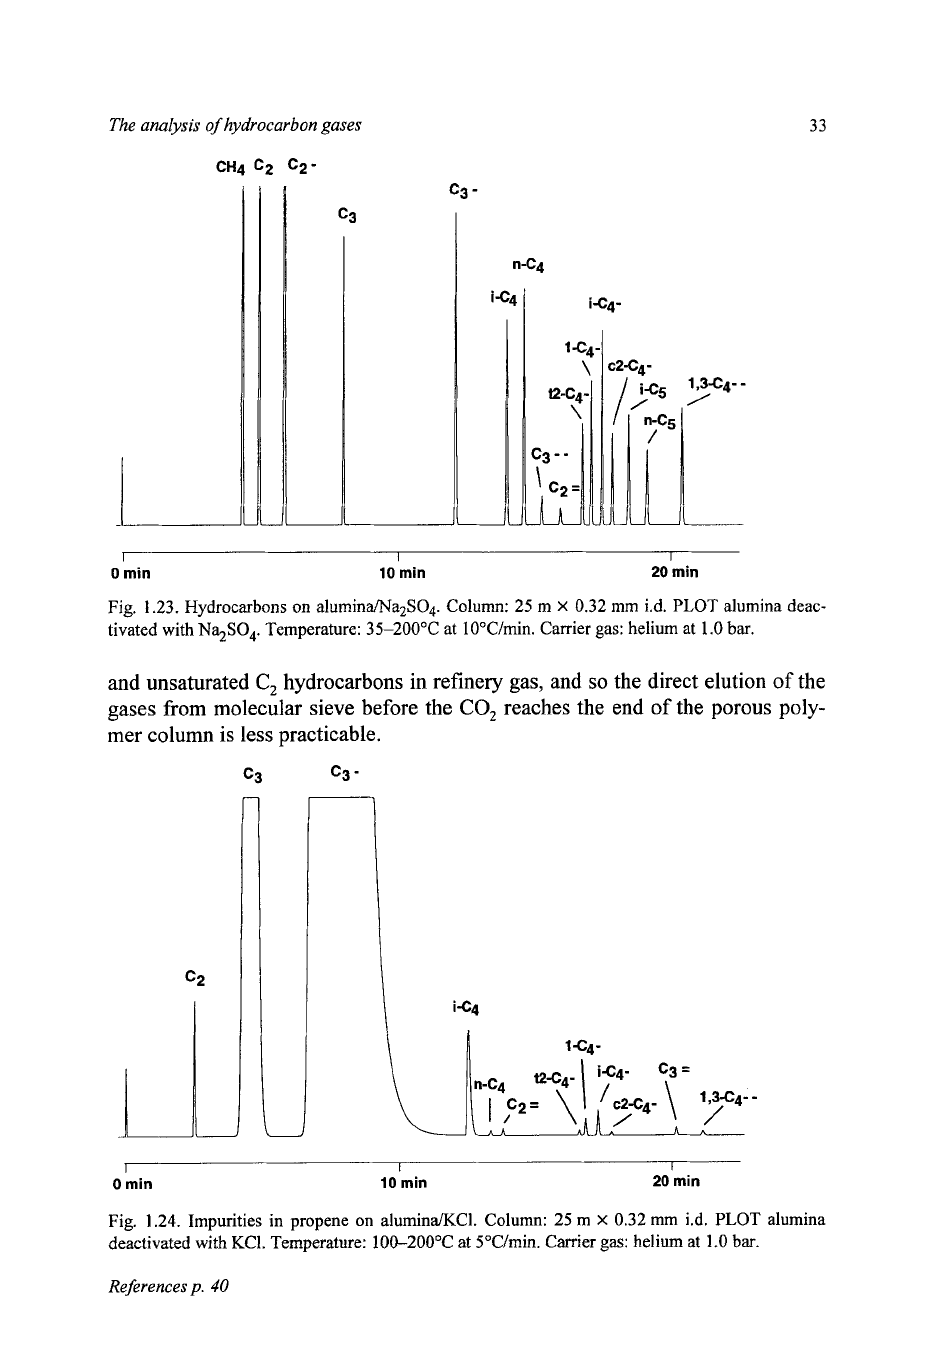
greater polarity, but still good peak shapes. Figure 1.23 shows a typical chroma-
togram.
Comparison of Figs. 1.22 and 1.23 shows the effect on acetylene and propadi-
ene, which are eluted, well resolved in the latter case, between the saturated and
unsaturated
C,
hydrocarbons. The sodium sulphate deactivation also elutes
the
C,
unsaturates with more equal spacing than with potassium chloride treat-
ment.
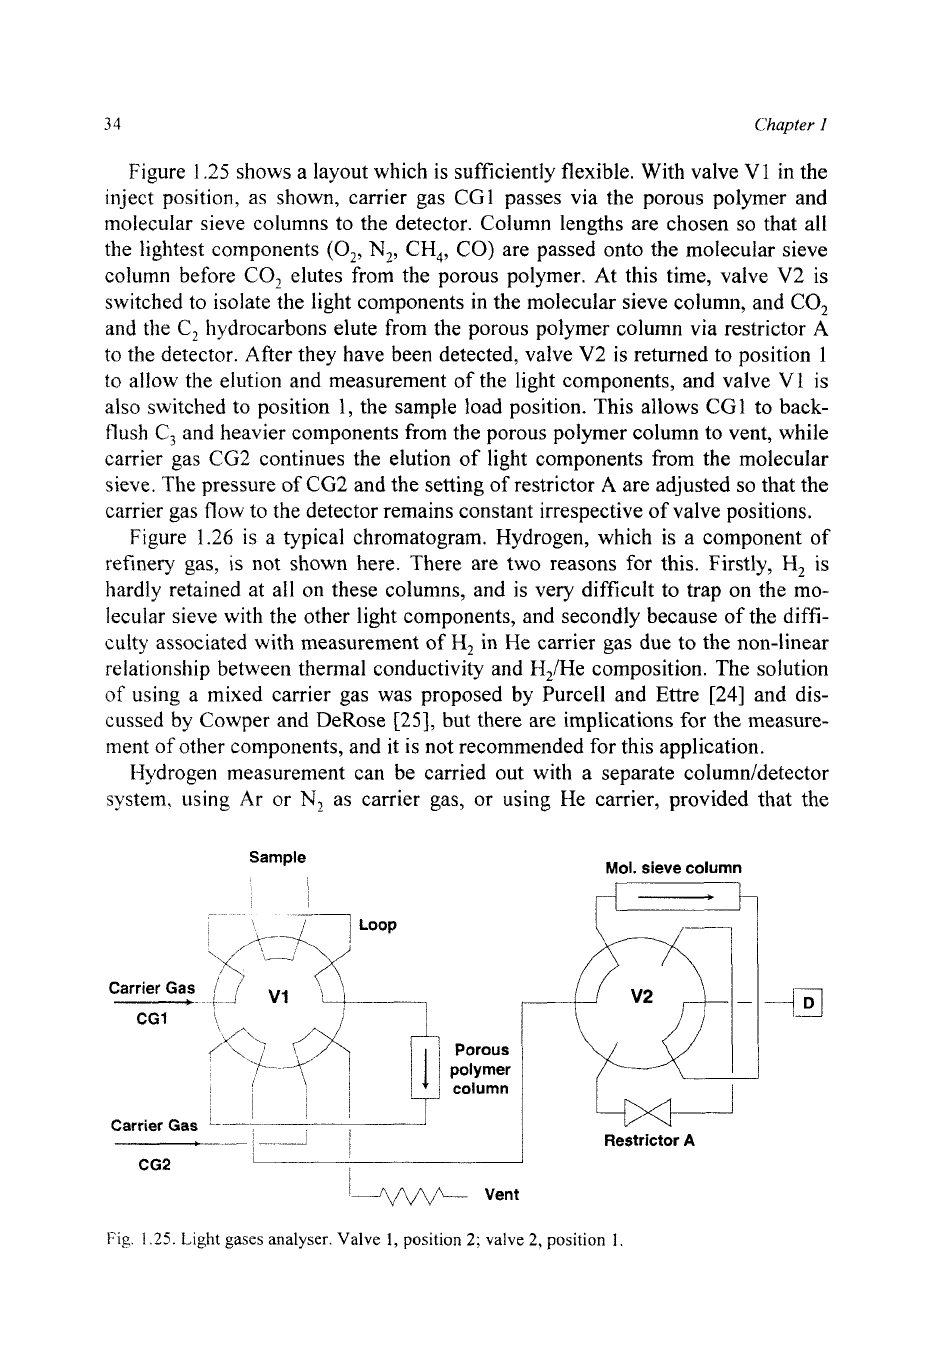
Figure
1.24
shows the use of a column deactivated with KC1 for measurement
of
impurities in propene. The product is about 25% propane and
75%
propene,
with other hydrocarbon gases present at parts per million concentrations. The
propene peak is clearly overloaded, giving
a
tailing shape, but the trace compo-
nents are easily measured. Because the temperature programme for this separa-
tion
is
different from that in
Fig.
1.22, the order
of
elution of n-butane and
acetylene can be seen to have changed.
As
mentioned earlier, inorganic gases are separated on
a
combination of po-
rous polymer and molecular sieve columns. Although
PLOT
capillary columns
are also available with these stationary phases, the extra resolving power which
they offer
is
not necessary for routine analysis of light gases, and
so
they are
rarely used. The column combination used in Fig. 1.16, which produces the
separation of light components shown in Fig. 1.17, is obviously similar to what
is
required here. The separation is more complicated, due to the presence of CO
n-C4
i44
1
.
_.__
I
I
0
min
10
min
20
min
Fig.
1.22.
[Iydrocarbons on
alumina/KCI.
Column:
25
m
X
0.32
mm
i.d.
PLOT
alumina deacti-
vated
with
KC1.
Temperature:
35-200°C
at 10"Cimin. Carrier
gas:
helium at
1.0
bar.
The analysis
of
hydrocarbon gases
CH4
c2
C2'
I
IL
"44
i44-
33
1,344-
-
1_
I
0
rnin
I
10 rnin
I
20
rnin
Fig. 1.23. Hydrocarbons on aluminaMa2SO4. Column: 25 m
X
0.32 mm i.d.
PLOT
alumina deac-
tivated with
Na$O,.
Temperature: 35-200°C at lO"C/min. Carrier gas: helium at 1.0
bar.
and unsaturated
C,
hydrocarbons in refinery gas, and
so
the direct elution
of
the
gases from molecular sieve before the
CO,
reaches the end
of
the porous poly-
mer column
is
less practicable.
I
0
rnin
I
10
rnin
20
rnin
Fig.
1.24.
Impurities in propene on alumina/KCI. Column: 25 m
X
0.32 mm i.d.
PLOT
alumina
deactivated with KCI. Temperature: 100-200°C at 5"C/min. Carrier gas: helium at
1.0
bar.
References
p.
40
34
Chapter
I
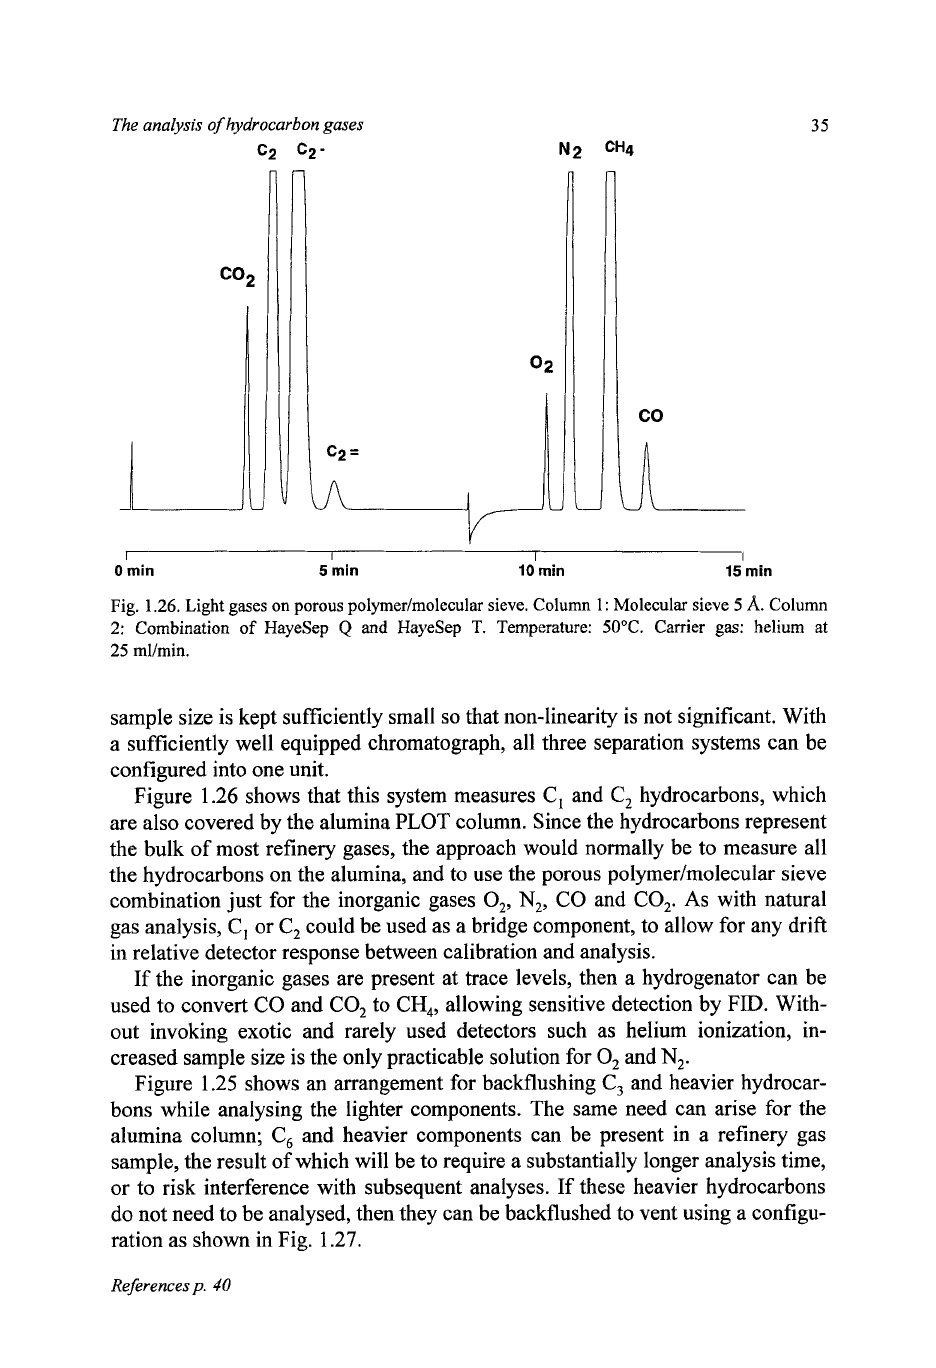
Figure
1.25
shows a layout which
is
sufficiently flexible. With valve
V1
in the
inject position, as shown, carrier gas CG1 passes via the porous polymer and
molecular sieve columns to the detector. Column lengths are chosen
so
that
all
the lightest components
(02,
N,,
CH,,
CO)
are passed onto the molecular sieve
column before
CO,
elutes from the porous polymer. At this time, valve
V2
is
switched to isolate ;he light components in the molecular sieve column, and
CO,
and the
C,
hydrocarbons elute from the porous polymer column via restrictor A
to the detector. After they have been detected, valve
V2
is returned to position
1
to allow the elution and measurement of the light components, and valve
VI
is
also switched to position
1,
the sample load position. This allows
CG1
to back-
flush
C,
and heavier components from the porous polymer column to vent, while
carrier gas
CG2
continues the elution of light components from the molecular
sieve. The pressure of
CG2
and the setting of restrictor
A
are adjusted
so
that the
carrier gas flow to the detector remains constant irrespective of valve positions.
Figure
1.26
is
a typical chromatogram. Hydrogen, which is a component
of
refinery gas,
is
not shown here. There are two reasons for this. Firstly,
H,
is
hardly retained at all on these columns, and is very difficult to trap on the mo-
lecular sieve with the other light components, and secondly because of the diffi-
culty associated with measurement of
H,
in He carrier gas due to the non-linear
relationship between thermal conductivity and H,/He composition. The solution
of
using a mixed carrier gas was proposed by Purcell and Ettre
[24]
and dis-
cussed by Cowper and DeRose
[25],
but there are implications for the measure-
ment
of
other components, and it is not recommended for this application.
Hydrogen measurement can be carried out with a separate column/detector
system. using Ar
or
N,
as carrier gas, or using He carrier, provided that the
Sample
I
I
CG1
Porous
polymer
-i
column
11
CG1
!
I
I
Porous
polymer
-i
column
11
Carrier
Gas
CG2
t--
-
-A
L
Mol.
sieve column
-
Restrictor
A
1-
Vent
Fig.
1.25.
Light
gases
analyser. Valve
1,
position
2;
valve
2,
position
I
The
analysis
of
hydrocarbon
gases
c2
c2-
35
Nq
CH4
co
I I
I
0
min 5 min 10 min
I
15 min
Fig. 1.26. Light gases
on
porous polymer/molecular sieve. Column
1
:
Molecular sieve
5
A.
Column
2:
Combination
of
HayeSep
Q
and
HayeSep
T.
Temperature:
50°C.
Carrier gas: helium at
25
ml/min.
sample size is kept sufficiently small
so
that non-linearity is not significant. With
a sufficiently well equipped chromatograph, all three separation systems can be
configured into one unit.
Figure
1.26
shows that this system measures
C,
and
C,
hydrocarbons, which
are also covered by the alumina
PLOT
column. Since the hydrocarbons represent
the bulk of most refinery gases, the approach would normally be
to
measure all
the hydrocarbons on the alumina, and to use the porous polymer/molecular sieve
combination just for the inorganic gases
0,,
N,,
CO
and
CO,.
As
with natural
gas analysis,
C,
or
C,
could be used as a bridge component, to allow for any drift
in relative detector response between calibration and analysis.
If the inorganic gases are present at trace levels, then a hydrogenator can be
used to convert
CO
and
CO,
to
CH,,
allowing sensitive detection by
FID.
With-
out invoking exotic and rarely used detectors such as helium ionization, in-
creased sample size is the only practicable solution for
0,
and
N,.
Figure
1.25
shows
an
arrangement for backflushing
C,
and heavier hydrocar-
bons while analysing the lighter components. The same need can arise for the
alumina column;
C,
and heavier components can be present in a refinery gas
sample, the result of which will be to require a substantially longer analysis time,
or to risk interference with subsequent analyses. If these heavier hydrocarbons
do not need to be analysed, then they can be backflushed to vent using a configu-
ration as shown in Fig.
1.27.
References
p.
40
36
Chapter
I
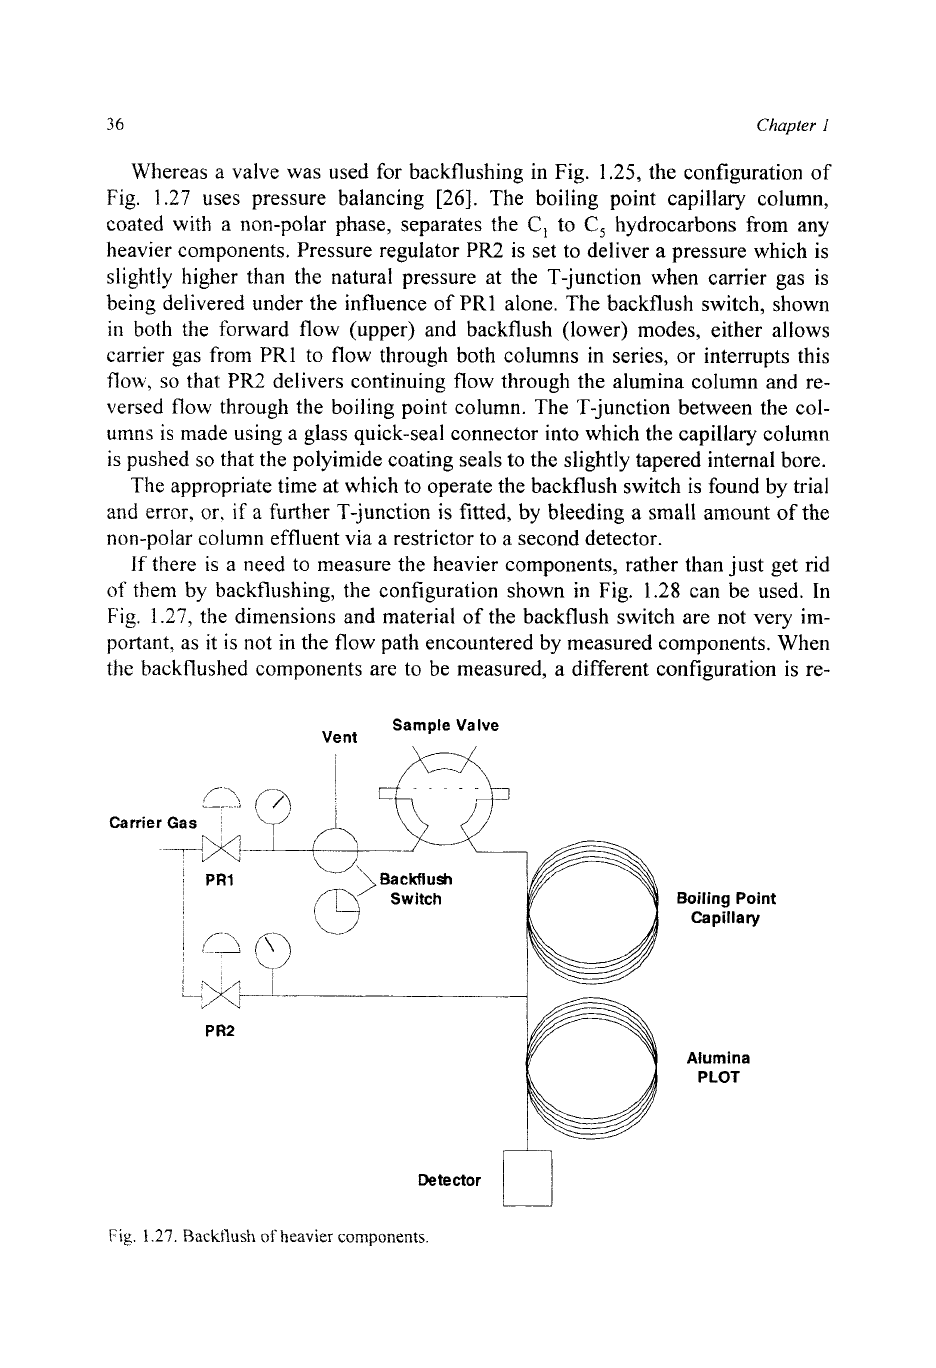
Whereas a valve was used for backflushing in Fig. 1.25, the configuration of
Fig.
1.27
uses pressure balancing
[26].
The boiling point capillary column,
coated with a non-polar phase, separates the
C,
to
C,
hydrocarbons from any
heavier components. Pressure regulator
PR2
is set to deliver
a
pressure which is
slightly higher than the natural pressure at the T-junction when carrier gas is
being delivered under the influence
of
PRl alone. The backflush switch, shown
in
both the forward flow (upper) and backflush (lower) modes, either allows
carrier gas from
PRl
to flow through both columns in series, or interrupts this
flow,
so
that
PR2
delivers continuing flow through the alumina column and re-
versed flow through the boiling point column. The T-junction between the col-
umns is made using a glass quick-seal connector into which the capillary column
is pushed
so
that the polyimide coating seals to the slightly tapered internal bore.
The appropriate time at which to operate the backflush switch is found by trial
and error,
or,
if
a
further T-junction
is
fitted, by bleeding
a
small amount of the
non-polar column effluent via a restrictor to a second detector.
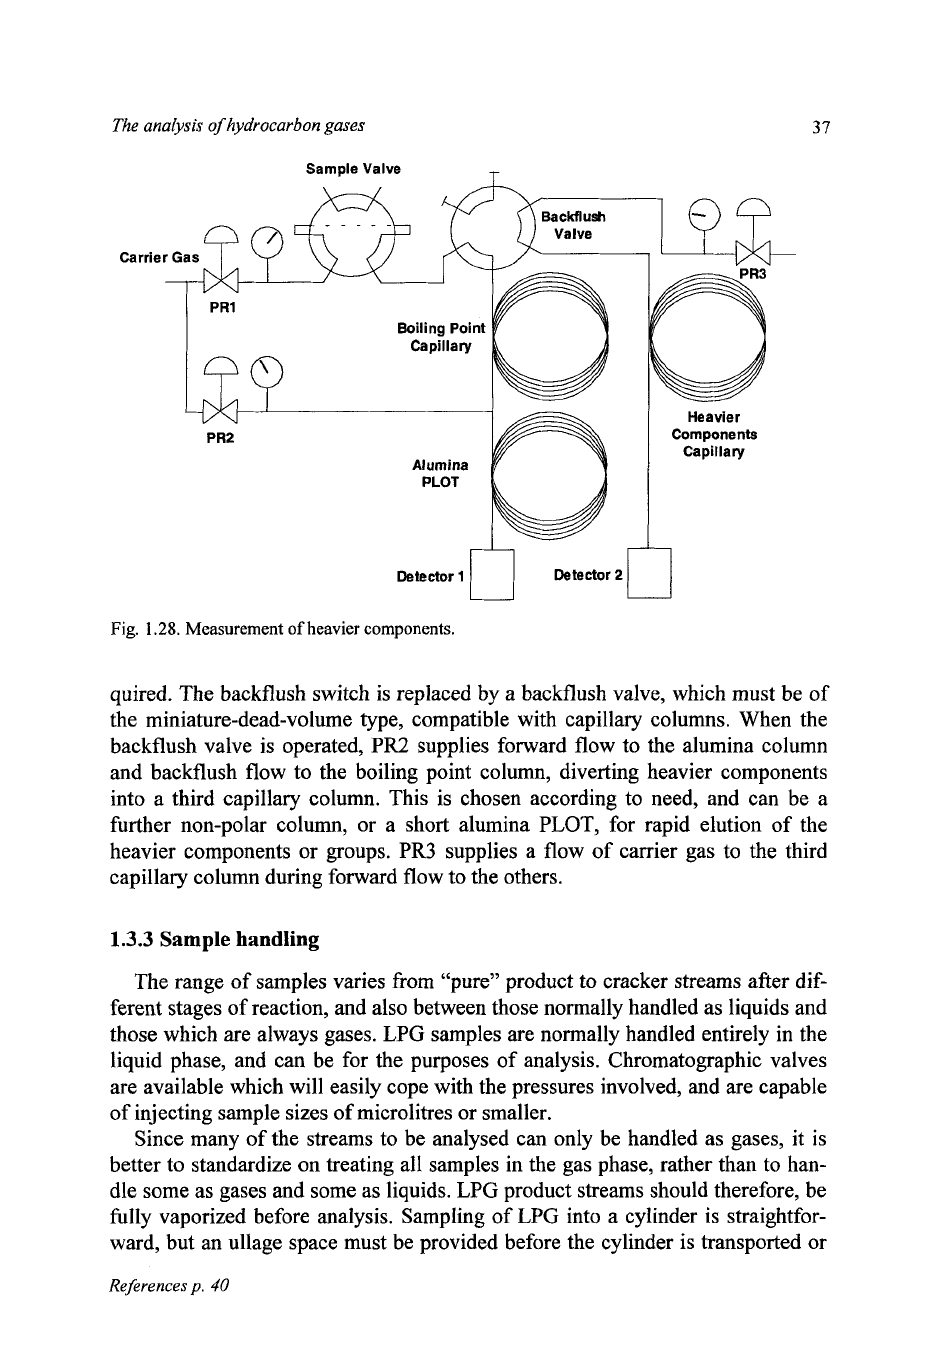
If there is a need to measure the heavier components, rather than just get rid
of
them by backflushing, the configuration shown in Fig. 1.28 can be used. In
Fig.
1.27,
the dimensions and material
of
the backflush switch are not very im-
portant, as it
is
not in the flow path encountered by measured components. When
the
backflushed components are to be measured, a different configuration is re-
Sample Valve
Vent
Carrier Gas
Boiling Point
Capillary
P
R2
Alumina
PLOT
LI
Detector
Fig.
1.27.
Rackflush
of
heavier
components
The analysis
of
hydrocarbon gases
37
T
Sample Valve
I
Boiling Point
Capillary
I
Heavier
Capillary
PR2
Components
Detector
1
Detector
2
cz]
Fig.
1.28.
Measurement
of
heavier components.
quired. The backflush switch is replaced by a backflush valve, which must be of
the miniature-dead-volume type, compatible with capillary columns. When the
backflush valve is operated, PR2 supplies forward flow to the alumina column
and backflush flow to the boiling point column, diverting heavier components
into a third capillary column. This is chosen according to need, and can be a
further non-polar column, or a short alumina PLOT, for rapid elution of the
heavier components or groups. PR3 supplies a flow of carrier gas to the third
capillary column during forward flow to the others.
1.3.3
Sample
handling
The range of samples varies from “pure” product to cracker streams after dif-
ferent stages of reaction, and also between those normally handled as liquids and
those which are always gases. LPG samples are normally handled entirely in the
liquid phase, and can be for the purposes of analysis. Chromatographic valves
are available which will easily cope with the pressures involved, and are capable
of injecting sample sizes
of
microlitres or smaller.
Since many of the streams to be analysed can only be handled as gases, it
is
better to standardize on treating a11 samples in the gas phase, rather than to han-
dle some as gases and some as liquids. LPG product streams should therefore, be
fully vaporized before analysis. Sampling of LPG into a cylinder
is
straightfor-
ward, but an ullage space must be provided before the cylinder is transported or
References
p.
40
38
Chapter
I
handled any further. This can be done by venting a proportion of the cylinder
contents,
so
that the cylinder contains some gas as well as the original liquid.
The different components in the sample will be distributed in different propor-
tions between the gas and liquid phases, but provided that the ullage space is
small, the liquid phase, containing the bulk of the sample, will still represent the
original composition. Where available, a constant pressure cylinder, which con-
tains a sliding piston seal between the
two
ends of the cylinder, should be used.
The sample side
of
the cylinder can then be filled with
100%
liquid phase, and
the ballast gas, on the other side of the piston, provides the safety buffer.
Most analyses require injection onto more than one column system, even if
fitted into a single chromatograph, and it is therefore crucial that the sample is
uniform between the injections. Sufficient
LPG
should be totally vaporized to
form
a gas sample large enough and with enough pressure
to
purge and fill all
the sample lines and injection devices. Depending upon the composition of the
sample, it may be necessary to heat the container into which the liquid is vapor-
ized, and to heat the lines through which the gas sample is conveyed to the injec-
tors.
1.4
CONCLUSIONS
From the foregoing,
it
can be seen that all the gas mixtures normally encoun-
tered in the petroleum industry can be separated into their individual compo-
nents. Having thus separated components, the usual requirement is to measure
them. This quantitative aspect has only been briefly mentioned, but is, of course,
of great importance.
Gas chromatography is not an absolute technique, in that the detectors de-
scribed above do not give a predictable response to any intrinsic property
of
the
separated components. Quantitative information arises from comparison, the in-
strument being calibrated with one
or
more mixtures
of
known composition, then
using the resulting response factors to convert the raw data (usually peak area,
occasionally peak height) to concentration. The quality of the calculated concen-
trations is fundamentally dependent upon how well the composition of the cali-
bration gas is known. Precision of analysis depends upon instrument character-
istics; accuracy depends principally on the quality of the calibration gas.
Detailed discussion
of
calibration gas preparation and certification
is
beyond
the scope of this chapter, but a few pointers are given below. Calibration mix-
tures can be prepared by gravimetric, volumetric or manometric techniques.
Most mixtures containing percentage concentrations can be prepared directly,
whereas lower concentrations may require one
or
more dilution stages to be
used. Some more reactive
or
adsorptive components, particularly at
low
concen-
trations
(H,S
being typical), require special precautions.
The
analysis
of hydrocarbon gases
39
Gravimetric.
Calibration gases of the highest quality can be prepared by this
technique. Pure gases are added to a cylinder, which is weighed before and after
each addition. Although the mass
of
the cylinder is typically orders of magnitude
greater than the masses of the added components, the accuracy achievable, with
suitable equipment and procedures, is excellent. The advantages include the fact
that masses translate unequivocally to molar amounts, and the technique pro-
duces a substantial quantity of calibration gas, under pressure in a cylinder. For
adsorptive components, cylinders which have been specially treated internally
can be used.
Volumetric.
Volumetric techniques operate at or very close to atmospheric
pressure, and can be static or dynamic. For ideal gases, volumes at a constant
pressure are equivalent to molar amounts, and the corrections for real gases at
atmospheric pressure are small. Glass double-ended bulbs and gas-tight syringes
can be calibrated for volume from the mass of their water content. Total dis-
placement of the pure gas contents of a smaller container into a larger one, and
subsequent dilution with a complement gas gives good quality mixtures. Dy-
namic techniques are often preferred for minor and/or adsorptive components.
Various options exist, but for hydrocarbon gases, continuous injection from a
motor-driven syringe into a flowing diluent stream is usual. The uncertainties on
the composition are greater than with static methods, as measurement
of
flow is
less well defined than measurement of volumes, but the equipment will become
conditioned to adsorptive components.
Manometric.
As
with gravimetric mixtures, components are added succes-
sively to a cylinder, but the composition is calculated from pressure, rather than
mass increments. This technique allows the largest quantities of calibration gases
to be prepared, as the size of cylinder is not limited by the size of the balance, as
in gravimetric use. The accuracy is, however, relatively poor, since non-ideal
behaviour is much more pronounced at high pressure. Compression
(2)
factors
can be calculated for hydrocarbon gas mixtures with good accuracy, but these
calculations assume that the mixtures are homogeneous. The conditions under
which a cylinder
is
filled with different components do not encourage rapid
mixing within the cylinder. The calculated factors can therefore only be ap-
proximations.
1.5
ACKNOWLEDGEMENTS
I
wish to thank British Gas plc, for permission to prepare and to publish this
chapter.
I
would also like to thank my many colleagues who assisted in its prepa-
ration, and
Mr.
A.
Allott and Mr. R. Jackson,
of
Lindsay Oil Refinery Ltd., for
their valuable discussions on refinery gas analysis.
References
p.
40
40
1.6
REFERENCES
Chapter
I
I
2
3
4
5
6
-
8
9
I
0
11
12
13
11
I5
16
17
18
19
20
21
22
23
24
25
26
A. Melvin, Natural
Gas:
Basic Science and Technology, IOP PublishingiBritish Gas plc
(1
988).
G.J. van Rossum, ed., Gas Quality
-
Specification and Measurement of Physical and Chemical
Properties
of
Natural
Gas,
Elsevier, Amsterdam (1986).
IP 337178. Analysis
of
Non-Associated Natural Gas by Gas Chromatography, Institute of Pe-
troleum. London.
.4STM
D1945
-
1981, Analysis of Natural
Gas
by Gas Chromatography, American Society
for Testing and Materials.
J.S.
Stufkens and H.J. Bogaard,
Anal.
Chern., 47 (1975) 383.
1SO
6974
-
1984. Natural gas
-
Determination of hydrogen, inert gases and hydrocarbons up
to
Cg
-
Gas
chromatographic method, International Organisation for Standardisation.
1,.
Huber
and
14.
Obbens,
J.
Chromatogr., 279 (1983) 167.
Varian Ltd., Application note No. 31.
IJ.S.
Patent Application 061583,469,
I.B.
Angcll. J.H. Jerman, S.C Terry and
S.
Saadat, A Prototype Gas Analysis System using a
Miniature Gas Chromatograph,
U.S.
Department of Health and Human Services (1981).
J.B.
Angell, S.C. Terry and P.
W.
Barth. Sci. Am., April
(1
983) 36.
A.
van
Es:
C. Cramers and
J.
Rijks,
J.
High Res. Chromatogr., 12 (1989) 303.
Chrompack
I,td.,
Application brochure 501660.
R.
Kenter, M. Struis and A.L.C. Smit, Process Control Qual.,
1
(1991) 127.
IS0
Ills
10723, Natural gas
-
Performance evaluation of analysers, International Organi-
sation for Standardisation.
E.H. Osjord and D. Malthe-Soerenssen,
J.
Chromatogr., 279 (1983) 219.
!I.
DiCorcia and
R.
Samperi.
J.
Chromatogr., 107 (1975) 99.
N.C.
Saha,
S.K.
Jain and P.K. Dua,
J.
Chromatogr. Sci., 16 (1978) 323.
D.R. Deans and
1.
Scott,
Anal.
Chem., 45 (1973) 1137.
C.G. Scott,
J.
Inst. Petrol., 45 (1959) 118.
1.
lialasz
and
E.
Heine, Nature, 194 (1962) 971.
N.G.
McTaggart, C.A. Miller and
B.
Pearce,
J.
Inst. Petrol., 54 (1968) 265.
N.
Vonk,
.I.
dc Zeeuw, M. Mohnke and
J.
Buyten, 14th Int. Symp. on Capillary Chroma-
tography, Baltimore, MD (1992).
.I.J<.
Purcell and
L.S.
Ettre, J.
Gas
Chromatogr., 3 (1965) 69.
C.J.
Cowpcr and
A.J.
DeRose, The Analysis
of
Gases by Chromatography, Pergamon Press,
Oxford
(1983).
D.R.
Deans,
J.
Chromatogr.,
18
(1965) 477.
E.R. Adlard (Ed.),
Chromatography
in
the Petroleum
Industry
Journal
of
Chromatography
Library
Series, Vol.
56
0
1995
Elsevier
Science
B.V.
All
rights
reserved
41
CHAPTER
2
Advances in simulated distillation
D.J.
Abbott
Esso Research Centre, Analytical Group, Abingdon, Oxfordshire
OX13
6AE,
UK
2.1
INTRODUCTION
Distillation is of major importance in the oil and petrochemical industries,
being by far the most widely used separation process. Many refinery units are
controlled by using distillation data and many products are sold to specifications
incorporating distillation data. There are a number of laboratory distillation tests
which are routinely used to determine the boiling ranges of crude oils and their
products. Crude oils are characterized by ASTM D2892
[l],
which is a “true
boiling point” method involving a lengthy separation in a high efficiency still.
The method uses vacuum distillation to recover material with high boiling
points. A simpler method is ASTM D86, a single plate distillation applicable to
gasolines, middle distillates and similar products. There is also a low efficiency
vacuum distillation method, ASTM D1160.
Simulating distillation by gas chromatography was first reported by Eggerston
et
al.
in 1960 [2]. It is based on the fact that hydrocarbons are eluted from a non-
polar column in boiling point order, and the column is temperature programmed
until all the sample is eluted. Integration is done in fixed time slices, rather than
on individual peaks. The time axis is converted
to
temperature by running a
standard under identical conditions to that of the sample. This standard usually
consists
of
a range of normal paraffins whose boiling points are known accu-
rately, but it can be a mixture of aromatic compounds if highly aromatic samples
such as coal liquids are being analysed. Using data from the runs on the sample
and the standard, it
is
possible
to
calculate the percentage recovered at any tem-
perature, or vice versa. The calculation is best done by a computer, which can
also be used to measure the area slices and retention times required. Indeed, the
technique is ideally suited to automatic running, using a computer to control an
References
pp.
52-53