Zuo-Guang. Ye Advanced Dielectric Piezoelectric and Ferroelectric Materials: Synthesis, Characterisation and Applications
Подождите немного. Документ загружается.

Handbook of dielectric, piezoelectric and ferroelectric materials180
background diffusion) of Gaussian function. The two distinct peaks for (111)
c
and the dominant peak for (200)
c
are the signature of the rhombohedral
symmetry, indicating the formation of the R3m phase for x = 0.35.
Based on the above analysis, we conclude that the solid solution of
(1–x)PSN–xPT with compositions in the MPB region exhibits a complex
phase mixture with the monoclinic phase that appears as the major phase for
0.37 ≤ x ≤ 0.42, and a small amount of the tetragonal phase. This observation
is in agreement with the report by Haumont et al. (2003), who evidenced a
monoclinic phase (of Pm or Cm symmetry) as the ground state combined
with some amount of the tetragonal phase for the composition x = 0.43.
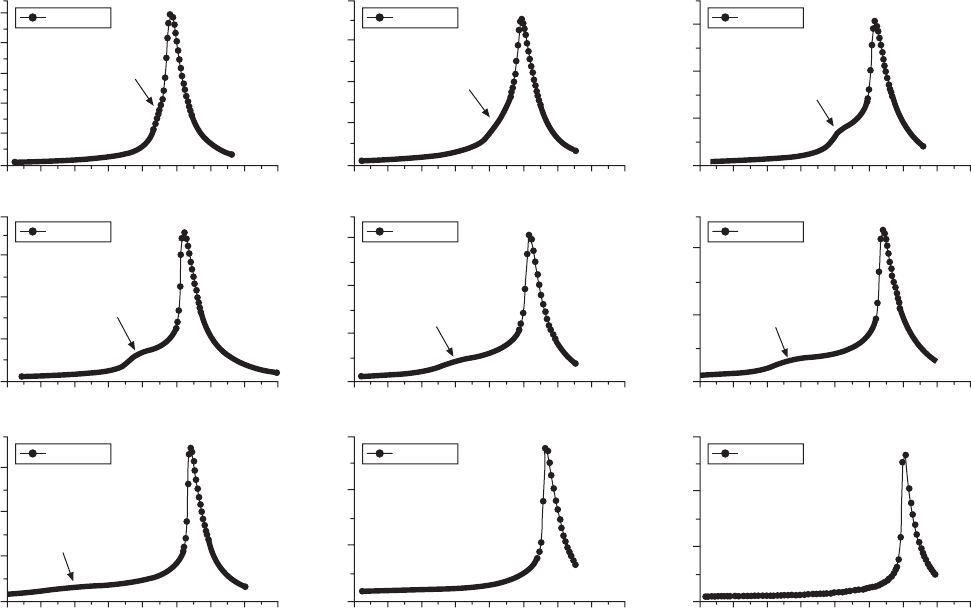
7.2.3 Dielectric properties
The dielectric permittivity as a function of temperature at various frequencies
(from 10 to 100 kHz) was measured from 400 °C down to 10 °C at 2–3 °C
intervals for the (1–x)PSN–xPT ceramics with the compositions x = 0.35,
0.37, 0.38, 0.39, 0.40, 0.41, 0.42, 0.45, and 0.50 by means of an Alpha High
Resolution Dielectric/Impedance Analyzer (NovoControl). The real permittivity
is shown in Fig. 7.4 for the frequency f = 100 kHz. The spectral features
depend on the compositions. For x = 0.45 and x = 0.50, only one anomaly
appears at T
C
≈ 286 °C and T
C
≈ 305 °C, respectively, corresponding to the
phase transition from the paraelectric cubic to the ferroelectric tetragonal
phase. For the compositions of 0.35 ≤ x ≤ 0.42, however, the permittivity
spectrum clearly shows two anomalies. In addition to the sharp peak at T
C
,
another shoulder-like anomaly appears at a lower temperature, named T
MPB
,
indicating a second transition from the ferroelectric tetragonal phase into
another ferroelectric phase(s). As Ti content decreases, T
C
moves to a lower
temperature, while T
MPB
shifts to a higher temperature. The two anomalies
are nearly merged for x = 0.35. The appearance of T
MPB
and the associated
phase transition in (1–x)PSN–xPT indicate the typical features of the
morphotropic phase boundary behaviour, as previously observed in the PZT,
PMN–PT, and PZN–PT systems (Kuwata et al., 1981; Shrout et al., 1990;
Noheda et al., 1999; Ye et al., 2001; Ohwada et al., 2003).
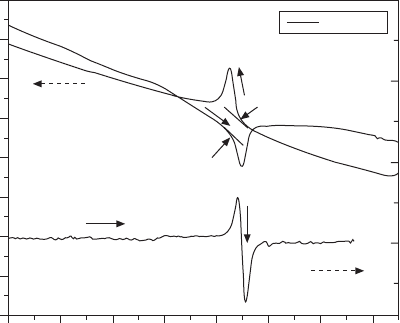
7.2.4 Thermal analysis by differential scanning
calorimetry (DSC)
The temperature dependences of the heat flow of the (1–x)PSN–xPT ceramics
(x = 0.35, 0.37, 0.38, 0.39, 0.40, 0.41, 0.42, 0.45, and 0.50) were measured
on a differential scanning calorimeter (DSC6200, Seiko Exstar). Figure 7.5
shows the DSC measurement for the 0.50PSN–0.50PT ceramics as an example.
Thermal anomalies with an endothermic peak on heating and an exothermic
peak on cooling are observed. The thermal events show an onset temperature
WPNL2204
Piezo- and ferroelectric (1–
x
)Pb(Sc
1/2
Nb
1/2
)O
3
–
x
PbTiO
3
181
x
= 0.38
x
= 0.37
x
= 0.35
T
c
MPB
40035030025020015010050
0
0
10000
20000
30000
40035030025020015010050
0
MPB
T
c
40000
30000
20000
10000
0
40035030025020015010050
0
MPB
T
c
50000
40000
30000
20000
10000
0
x
= 0.41
x
= 0.40
x
= 0.39
40035030025020015010050
0
40035030025020015010050
0
40035030025020015010050
0
T
c
MPB
T
c
MPB
MPB
T
c
20000
10000
0
30000
20000
10000
0
40000
30000
20000
10000
0
Real permittivity
x
= 0.50
x
= 0.45
x
= 0.42
Temperature (°C)
40035030025020015010050
0
40035030025020015010050
0
40035030025020015010050
0
T
c
T
c
T
c
MPB
20000
30000
10000
0
20000
30000
10000
0
30000
20000
10000
0
7.4
Real permittivity of the (1–
x
)Pb(Sc
1/2
Nb
1/2
)O
3
−
x
PbTiO
3
ceramics as a function of temperature for the compositions
x
= 0.35, 0.37, 0.38, 0.39, 0.40, 0.41, 0.42, 0.45, and 0.50 at the frequency
f
= 100 kHz.
WPNL2204
Handbook of dielectric, piezoelectric and ferroelectric materials182
of 306 °C upon heating and 310 °C upon cooling, indicating a normal thermal
hysteresis. The peak temperature is in good agreement with the permittivity
peak temperature of 0.50PSN–0.50PT (304 °C). The same measurements
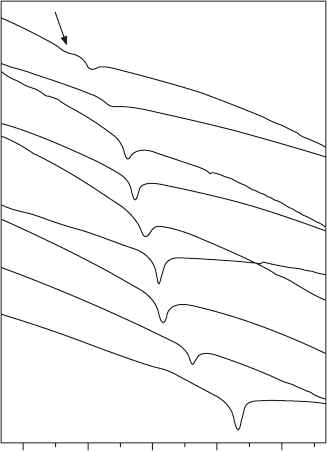
and analysis were performed on the ceramic samples of different compositions,
as shown in Fig. 7.6 for the heating data.
The thermal events detected by the DSC measurements indicate a structural
phase transition for all the samples studied. The temperature of the phase
transition is in good agreement with the Curie temperature T
C
obtained by
the permittivity measurements. An additional weak anomaly is observed on
the low-temperature side of the major DSC peak for x = 0.35, which corresponds
to the morphotropic phase transition temperature T
MPB
observed in the dielectric
permittivity measurements. This transition should appear in some other
compositions, but the thermal events are too weak to be detected.
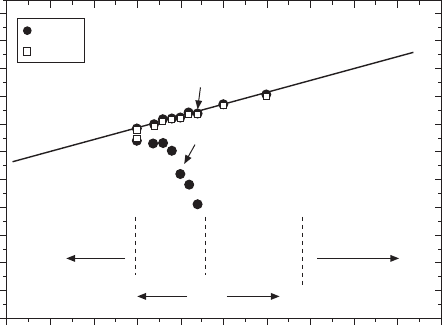
7.2.5 Morphotropic phase diagram of the
(1–
x
)Pb(Sc
1/2
Nb
1/2
)O
3
–
x
PbTiO
3
solid
solution system
Based on the above XRD, DSC, and dielectric results, a phase diagram for
the solid solution of (1–x)PSN–xPT is established with more details in and
around the MPB, as shown in Fig. 7.7. The para-/ferroelectric phase transition
temperature T
C
is in good agreement with the data previously reported by
Tennery et al. (1968). The most important feature of this phase diagram is
that the MPB region is identified as a mixture of the monoclinic (M) phase
x
= 0.50
310°C
306°C
1500
1000
500
0
DDSC (µW/min)
Temperature (°C)
360340320300280260240220
–1300
–1200
–1100
–1000
–900
–800
–700
–600
–500
DSC (µW)
7.5
DSC measurement of 0.50Pb(Sc
1/2
Nb
1/2
)O
3
−0.50PbTiO
3
ceramics
as a function of temperature on heating and cooling.
WPNL2204
Piezo- and ferroelectric (1–
x
)Pb(Sc
1/2
Nb
1/2
)O
3
–
x
PbTiO
3
183
the (majority) and some of the tetragonal (T) phase for 0.35 < x < 0.42 at or
around room temperature. With x increasing from 0.42 to 0.50, the T phase
becomes the major phase, with the monoclinic phase persisting in a small
amount. Therefore, as the PT content (x) increases, the (1–x)PSN–xPT solid
solution undergoes a sequence of structural changes from the rhombohedral
(R) phase (x ≤ 0.35), to the monoclinic (M) phase mixed with a small amount
of the tetragonal phase (+δT) (0.35 < x <0.45), then to the tetragonal T phase
mixed with a small amount of the monoclinic phase (+δM) (0.45 ≤ x ≤ 0.50)
and finally to the pure tetragonal (T) phase (x > 0.50). (Note that the pure
tetragonal phase was observed by Haumont et al. (2003) for x ≥ 0.55 only.)
More importantly, in Fig. 7.7, the morphotropic phase boundary region is
well defined by a curved upper limit, which indicates the temperatures of the
morphotropic phase transition T
MPB
. Upon cooling through T
MPB
, (1–x)PSN–
xPT transforms from a tetragonal phase into either a mixture of the monoclinic
and the tetragonal phases (for 0.37 ≤ x ≤ 0.42) or to the rhombohedral phase
(for 0.35 ≤ x < 0.37). The curvature of the MPB upper limit indicates the
dependence of the morphotropic phase transition temperature on the
composition. Interestingly, the (1–x)PSN–xPT compositions of 0.35 ≤ x ≤
0.39 exhibit both a higher T
MPB
(> 175 °C) and a higher T
C
(> 200 °C) than
Temperature (°C)
330300270240210
Heat flux (arbt. units)
x
= 0.35
x
= 0.37
x
= 0.38
x
= 0.39
x
= 0.40
x
= 0.50
x
= 0.45
x
= 0.42
x
= 0.41
7.6
DSC measurements for the (1–
x
)Pb(Sc
1/2
Nb
1/2
)O
3
−
x
PbTiO
3
ceramics with compositions of
x
= 0.35, 0.37, 0.38, 0.39, 0.40, 0.41,
0.42, 0.45, and 0.50.
WPNL2204
Handbook of dielectric, piezoelectric and ferroelectric materials184
the PMN–PT and PZN–PT systems, making them a more interesting relaxor-
based material system for high-temperature piezoelectric applications.
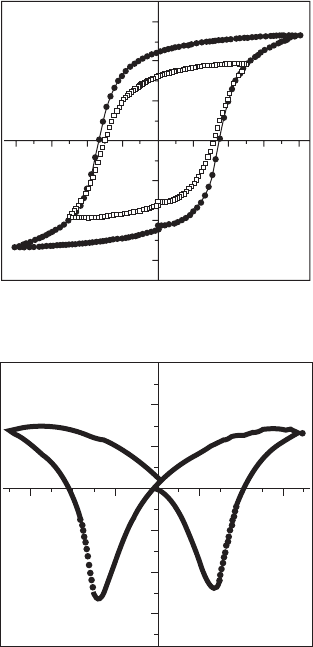
7.2.6 Ferroelectric and piezoelectric characterizations
The ferroelectricity of the (1–x)PSN–xPT samples of MPB compositions is
confirmed by polarization–electric field hysteresis loops displayed at room
temperature. Typical hysteresis loops for 0.60PSN–0.40PT at different applied
electric fields (±7.5 kV/cm and ±12 kV/cm) are shown in Fig. 7.8(a). The
remnant polarization reaches P
r
≈ 22
µ
C/cm
2
under a drive field of E ≈
±12 kV/cm with a coercive field of E
C
≈ 5 kV/cm.
Figure 7.8(b) shows the variation of strain as a function of bipolar electric
field for the same sample. It displays a symmetric ‘butterfly’ loop, resulting
from the bipolar ferroelectric switching behaviour. A peak-to-peak strain
value of 0.15% is obtained at E = ± 10kV/cm.
The dielectric constants and the piezoelectric coefficients d
33
at room
temperature are plotted as a function of compositions and shown in Fig. 7.9.
The areas of different phase components are marked to highlight the
composition and phase dependence of the properties. It can be seen that the
highest values of ε′ and d
33
appear in the ceramics of compositions within
the MPB region.
(ε′)
(DSC)
T
c
C (pm3m)
T
MPB
MPB
T
(P4mm)
T
(R3m)
M + δT T + δM
x
(1 –
x
)Pb(Sc
1/2
Nb
1/2
)O
3
–
x
PbTiO
3
0.700.650.600.550.500.450.400.350.300.250.20
–100
–50
0
50
100
150
200
250
300
350
400
450
Temperature (°C)
7.7
Phase diagram for the (1–
x
)Pb(Sc
1/2
Nb
1/2
)O
3
−
x
PbTiO
3
solid
solution around its MPB established based on the results of this
work. Solid circles are the boundary between the tetragonal phase
(at high temperature) and M + δT phase(s) at low temperature, which
represents the upper limit of the MPB region with the monoclinic
phase in majority.
WPNL2204
Piezo- and ferroelectric (1–
x
)Pb(Sc
1/2
Nb
1/2
)O
3
–
x
PbTiO
3
185
7.3 Growth of relaxor ferroelectric
Pb(Sc
1/2
Nb
1/2
)O
3
and
(1–
x
)Pb(Sc
1/2
Nb
1/2
)O
3
–
x
PbTiO
3
single
crystals
This section describes the growth of relaxor ferroelectric PSN and (1–x)PSN–
xPT solid solution single crystals and Section 7.4 describes the characterization
of the physical properties of the grown crystals.
Electric field (kV/cm)
(a)
PSN–PT ceramic (
x
= 0.40)
Polarization (µC/cm
2
)
–30
–20
–10
0
10
20
30
–12 –9 –6 –3 0 3 6 9 12
Electric field (kV/cm)
(b)
PSN–PT ceramic (
x
= 0.40)
Strain (%)
–9 –6 –3 0 3 6 9
–0.12
–0.08
–0.04
0.00
–0.0
0.08
7.8
Typical hysteresis loops (a) and strain-electric field variation (b)
for 0.60Pb(Sc
1/2
Nb
1/2
)O
3
−0.40PbTiO
3
ceramics under a bipolar drive
(solid circle: ±12 kV/cm; open square: ±7.5 kV/cm).
WPNL2204
Handbook of dielectric, piezoelectric and ferroelectric materials186
7.3.1 Crystal growth
Because of the high melting points of PSN and (1–x)PSN–xPT (>1400 °C),
the use of a flux is necessary for the crystal growth in order to lower the
temperature limits. Previous work has revealed that the mixture of (PbO +
δB
2
O
3
) is an effective solvent for the growth of the PMN–PT and PZN–PT
piezocrystals because it combines the advantage of both the borate and the
PbO solvent (Dong and Ye, 2000; Zhang et al., 2000). Therefore, similar
flux composition and growth conditions are applied for the growth of PSN
and (1–x)PSN–xPT. Table 7.1 lists the melting points of PSN (Yanagisawa et
al., 1998), PbTiO
3
(Eisa et al., 1980), PbO (Geller and Bunting 1937), and
PT content (%)
PSN-PT ceramics
34 36 38 40 42 44 46 48 50 52
ε′
2400
2000
1600
1200
800
R3m M2+δT M1 + δT T + δM
PT content (%)
PSN-PT ceramics
5250484644424038363432
500
400
300
200
100
0
d
33
R3m M2+δT M1 + δT T + δM
7.9
Room temperature dielectric constants and piezoelectric
coefficients
d
33
as a function of composition and phase component
for the (1–
x
)Pb(Sc
1/2
Nb
1/2
)O
3
−
x
PbTiO
3
ceramics. R stands for the
rhombohedral
R3m
phase; M1: the monoclinic
Pm
phase; M2: the
monoclinic
Cm
phase; and T: the tetragonal
P4mm
phase.
WPNL2204
Piezo- and ferroelectric (1–
x
)Pb(Sc
1/2
Nb
1/2
)O
3
–
x
PbTiO
3
187
B
2
O
3
(Levin, 1966). It can be seen that the melting point of PSN is much
higher than PT, a character that is very similar to the PMN–PT binary system.
As a result, a similar phase segregation problem is expected in the grown (1–
x)PSN–xPT crystals, as described in the following sections.
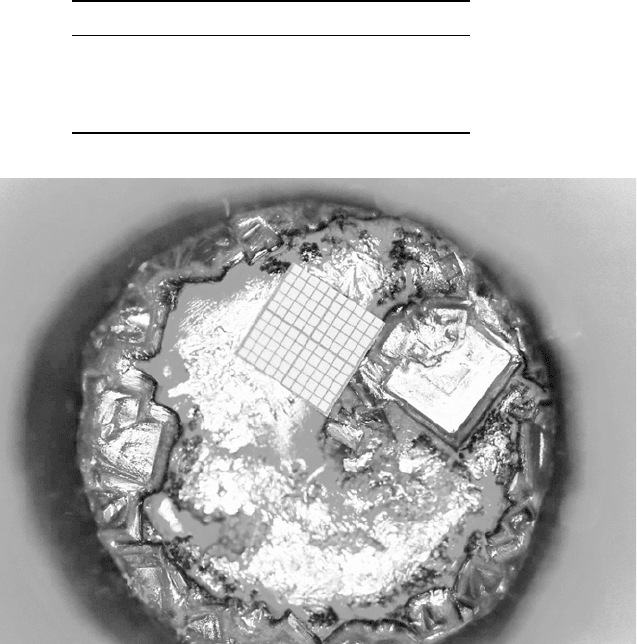
A double crucible setup (Dong and Ye, 2000) was used for the crystal
growth. From the spontaneous nucleation process upon slow cooling from
1180 to 1000 °C, most of the crystals were nucleated and grown on the
bottom and walls of the crucibles (Fig. 7.10), probably because of heat
dissipation through the walls of the container. The X-ray powder diffraction
shows that the grown crystals exhibit a pure perovskite phase.
Table 7.1
Melting points of Pb(Sc
1/2
Nb
1/2
)O
3
(PSN),
PbTiO
3
, PbO, and B
2
O
3
Compounds Melting point (°C)
PSN 1425
PbTiO
3
1285
PbO 886
B
2
O
3
450
7.10
Top-view of an as-cooled crucible from growth of (1–
x
)Pb(Sc
1/
2
Nb
1/2
)O
3
−
x
PbTiO
3
single crystals, showing the growth by
spontaneous nucleation around the crucible walls.
WPNL2204

Handbook of dielectric, piezoelectric and ferroelectric materials188
7.3.2 Growth mechanism
During the growth of PSN and (1–x)PSN–xPT crystals, the crystals of the
pyrochlore phase of the Pb
1.5
Nb
2
O
6.5
-type appeared in several growth trials.
Interestingly, the formation of the pyrochlore phase was found to depend on
the chemical compositions and the lower limit of growth temperature, below
which the crystallization process is stopped (Bing and Ye, 2003). It is concluded
that a higher portion of flux vs. solute and a larger ratio of PbO vs. B
2
O
3
help
stabilize the perovskite phase down to a lower temperature. A higher amount
of B
2
O
3
in the flux may favour the formation of the pyrochlore phase. In other
words, the pyrochlore phase may be more stable over a wider temperature
range if the flux is richer in B
2
O
3
. By carefully selecting the PSNT/flux and
PbO/B
2
O
3
ratios in the solution, it is possible to obtain the perovskite
(1–x)PSN–xPT crystals in a certain temperature range without a pyrochlore phase.
In the growth by spontaneous nucleation, an appropriate supersaturation
is required to trigger the formation of the nuclei. On the other hand, the habit
of the crystal strongly depends on the growth parameters, e.g. the degree of
supersaturation, the temperature profile and the chemical composition (Chernov,
1984). Especially when the growth takes place in polycomponent systems,
such as [(PSN–PT) + flux] in this case, a distribution constant k for a given
component can reflect the growth mechanisms. Usually, at slow rates of
growth, the effective distribution coefficient k
eff
can be expressed as (Laudise,
1970):
k
C
C
eff
s(act)
l(act)
=
7.1
where C
s(act)
and C
l(act)
are the actual concentrations of the products in the
form of the solid and liquid. The value of k
eff
depends on the growth rate, the
diffusion constant for the materials in the melt, and the width of the diffusion
layer. For polycomponent systems, k
eff
can be greater or less than 1. The
closer is k
eff
to the unity, the easer the component would get into the bulk.
From this point of view, k
eff
is a very important parameter for the crystal
growth in a solid solution compound. As we will see later, the value of k
eff
is closely related to the segregation problem in (1–x)PSN–xPT.
The morphology of the (1–x)PSN–xPT crystals is affected by a number of
factors, including the shape and the size of the container and the chemical
ratio between flux and products. The (1–x)PSN–xPT crystals show a pseudo-
cubic form when grown on the crucible bottom, but a distorted form when
grown on the walls. The ‘ribbon’-like cellular structure was observed in the
growing crystals, arising from severe constitutional supercooling conditions
occurring during the growth. This happens when the solid/liquid interface of
growth cannot adjust itself to keep in a planar surface shape, necessary for
a stable growth (Laudise, 1970).
WPNL2204

Piezo- and ferroelectric (1–
x
)Pb(Sc
1/2
Nb
1/2
)O
3
–
x
PbTiO
3
189
Appropriate ratios of PSNT/flux and PbO/B
2
O
3
must be kept to maintain
a stable growth. It was found that an increase in the portion of B
2
O
3
can
lower the temperature coefficient of solubility. However, if the level of B
2
O
3
is too high in the solution, the so-called skeletons or faceted growth will
appear, because the crystal is grown under an unstable boundary due to the
convex form of solid/liquid interface. The unstable growth is mainly caused
by the concentration difference between the corner and the center of the
growing cubic crystals (Saito, 1996). The growth may become less stable
when the feed is markedly deficient, and the fluctuation in the saturation at
the different parts becomes too large to keep a constant normal growth rate
over the flat surface. By adding the necessary amount of solute, i.e. by
increasing the concentration of (1–x)PSN–xPT in the solution, a more uniform
distribution of driven force is established to allow a stable growth (Lawson
and Nielsen, 1958; Chernov, 1984).
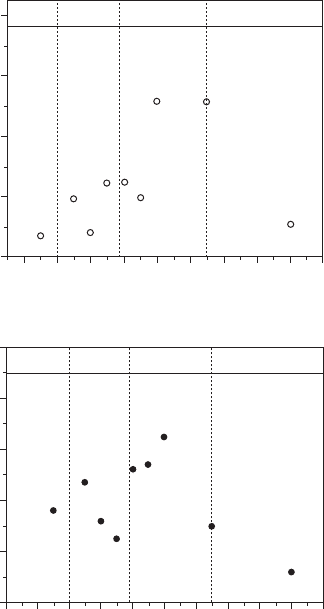
For the growth of (1–x)PSN–xPT solid solution crystals, the above discussion
can be depicted by the schematic plot of (100–yield per cent) of the grown
(1–x)PSN–xPT single crystals vs. temperature, as shown in Fig. 7.11. The
yields (percentages) of the crystallized (1–x)PSN–xPT perovskite crystals
were calculated from the ratios of the amount (weight) of the grown
(1–x)PSN–xPT crystals over that of the charged nominal (1–x)PSN–xPT
powder in the stoichiometric composition in the selected batches and are
listed in Table 7.2. Analysis of these data shows that the yields of (1–x)PSN–
xPT crystals during the growth are affected by the PSNT/flux and PbO/B
2
O
3
ratios. Increasing the portion of B
2
O
3
in the flux composition in Batch 2,
Decreasing temperature
Batch 2
Batch 4
Batch 1
100 – Yield% of PSN–PT
20
40
60
80
100
7.11
Schematic variation of (100–yield%) of the grown
(1–
x
)Pb(Sc
1/2
Nb
1/2
)O
3
−
x
PbTiO
3
single crystals vs. temperature.
WPNL2204