Zdunkowski W., Trautmann T., Bott A. Radiation in the atmosphere: A course in Theoretical Meteorology
Подождите немного. Документ загружается.


6.7 The classical emissivity approximation 185
(a) E
+
(w) = π
∞
0
[B
ν,g
− B
ν
(w
g
)]T
f,ν
(w, w
g
)dν + π
∞
0
B
ν
(w)dν
+π
∞
0
w
g
w
dB
ν
dw
T
f,ν
(w, w
)dw
dν
(b) E
−
(w) =−π
∞
0
B
ν
(w
= 0)T
f,ν
(0,w)dν + π
∞
0
B
ν
(w)dν
−π
∞
0
w
0
dB
ν
dw
T
f,ν
(w
,w)dw
dν
(6.117)
where in (6.117b) it has been assumed that I
−,ν
(0) = 0.
Let us consider the simple situation of an isothermal atmosphere T = T
0
.In
this case B
ν
is a constant so that dB
ν
/dw = 0. Furthermore, we assume that
B
ν,g
= B
ν
(w
g
). Then the equations for the upwelling and downwelling flux densi-
ties reduce to
E
+
(w) = π
∞
0
B
ν
(T
0
)dν = σ T
4
0
E
−
(w) = π
∞
0
B
ν
(T
0
)[1 − T
f,ν
(0,w)]dν
(6.118)
This means that in an isothermal medium of temperature T = T
0
the upwelling
flux density is independent of altitude and is identical with the emission of a black
body having this temperature. The situation is different for the downwelling flux
density. At w = 0 there is no downwelling radiation. However, if w →∞the flux
transmission vanishes so that the downward flux density is identical with σ T
4
0
.
In order to decouple the frequency integration from the integration over the
absorbing mass, we introduce the following mean transmissivities
¯
T
f
(T,w,w
) =
π
∞
0
B
ν
(T )T
f,ν
(w, w
)dν
π
∞
0
B
ν
(T )dν
(6.119)
ˆ
T
f
(T,w,w
) =
π
∞
0
dB
ν
dT
T
f,ν
(w, w
)dν
π
∞
0
dB
ν
dT
dν
with
π
∞
0
B
ν
(T )dν =π B(T ) =σ T
4
,π
∞
0
dB
ν
dT
dν =π
d
dT
∞
0
B
ν
dν
=π
dB
dT
(6.120)
186 Two-stream methods for the solution of the RTE
Furthermore, we introduce the so-called flux-emissivity function ε
f
(T,w,w
)by
means of
ε
f
(T,w,w
) = 1 −
¯
T
f
(T,w,w
)
(6.121)
where w
≥ w. Utilizing (6.119) and (6.120) the last integral occurring in (6.117a)
may be reformulated as
∞
0
w
g
w
dB
ν
dw
T
f,ν
(w, w
)dw
dν =
w
g
w
dT
dw
∞
0
dB
ν
dT
T
f,ν
(w, w
)dνdw
=
w
g
w
dT
dw
dB
dT
ˆ
T
f
(T,w,w
)dw
=
w
g
w
dB
dw
ˆ
T
f
(T,w,w
)dw
(6.122)
An analogous result will be obtained for the last integral in (6.117b).
From (6.119) it is seen that, in contrast to T
f,ν
(w, w
), the mean transmissivities
¯
T
f
(T,w,w
) and
ˆ
T
f
(T,w,w
) explicitly depend on temperature as caused by the
temperature-dependent weighting functions B
ν
(T ) and dB
ν
/dT. This leads to the
next assumption of the classical emissivity method which neglects this temperature
dependence. Thus we use the following approximations
T
f
(w, w
) ≈
¯
T
f
(T
m
,w,w
) ≈
ˆ
T
f
(T
m
,w,w
), ε
f
(w, w
) ≈ ε
f
(T
m
,w,w
)
(6.123)
where a suitable mean temperature T
m
is used for the evaluation of the Planck
function and w
≥w.
Introducing the above approximations into (6.117) yields
E
+
(w) =π[B
g
− B(w
g
)]T
f
(w, w
g
) + π B(w) + π
w
g
w
dB
dw
T
f
(w, w
)dw
E
−
(w) =−π B(w
= 0)T
f
(0,w) + π B(w) − π
w
0
dB
dw
T
f
(w
,w)dw
(6.124)
Partial integration finally gives the so-called flux-emissivity equations
E
+
(w) =π B
g
1 − ε
f
(w, w
g
)
+ π
w
g
w
B(w
)
∂ε
f
(w, w
)
∂w
dw
E
−
(w) =−π
w
0
B(w
)
∂ε
f
(w
,w)
∂w
dw
(6.125)
6.7 The classical emissivity approximation 187
Equation (6.125) may be used to calculate the infrared radiative heating rates at
the reference level z
R
according to
∂T
∂t
rad
=−
1
c
p
ρ
R
dE
+
dz
−
dE
−
dz
z=z
R
=−
1
c
p
ρ
R
dE
+
dw
−
dE
−
dw
dw
dz
z=z
R
=
ρ
abs,R
c
p
ρ
R
p
R
p
0
&
T
0
T
R
dE
+
dw
−
dE
−
dw
(6.126)
where use was made of (6.115). Differentiation of (6.125) with respect to w yields
5
(a)
dE
+
dw
=−π B
g
∂ε
f
(w, w
g
)
∂w
+ π
w
g
w
B(w
)
∂
2
ε
f
(w, w
)
∂w
∂w
dw
−lim
w
→w
π B(w
)
∂ε
f
(w,w
)
∂w
(b)
dE
−
dw
=−π
w
0
B(w
)
∂
2
ε
f
(w
,w)
∂w
∂w
dw
− lim
w
→w
π B(w
)
∂ε
f
(w
,w)
∂w
(6.127)
Partial integration of these equations results in
(a)
dE
+
dw
= π [B(w
g
) − B
g
]
∂ε
f
(w, w
g
)
∂w
− π
w
g
w
dB
dw
∂ε
f
(w, w
)
∂w
dw
−lim
w
→w
π B(w
)
∂ε
f
(w,w
)
∂w
− lim
w
→w
π B(w
)
∂ε
f
(w,w
)
∂w
(b)
dE
−
dw
= π B(w = 0)
∂ε
f
(0,w)
∂w
+ π
w
0
dB
dw
∂ε
f
(w
,w)
∂w
dw
−lim
w
→w
π B(w
)
∂ε
f
(w
,w)
∂w
− lim
w
→w
π B(w
)
∂ε
f
(w
,w)
∂w
(6.128)
From the definition of ε
f
one may easily see that for two arbitrary values w
1
,w
2
with w
2
>w
1
the following relations hold
(a)
∂ε
f
(w
1
,w
2
)
∂w
2
> 0,
∂ε
f
(w
1
,w
2
)
∂w
1
< 0
(b) lim
w
2
→w
1
∂ε
f
(w
1
,w
2
)
∂w
2
=− lim
w
2
→w
1
∂ε
f
(w
1
,w
2
)
∂w
1
(6.129)
Equation (6.129a) simply describes the fact that with increasing layer thickness the
emissivity is increasing and vice versa. Utilizing (6.129b) we find that the last two
5
Note that for the differentiation of the integrals the Leibniz rule has to be applied.
188 Two-stream methods for the solution of the RTE
terms in (6.128a,b) cancel. Subtraction of these two equations finally yields
dE
+
dw
−
dE
−
dw
=π [B(w
g
) − B
g
]
∂ε
f
(w, w
g
)
∂w
− π
w
g
w
dB
dw
∂ε
f
(w, w
)
∂w
dw
− π B(w = 0)
∂ε
f
(0,w)
∂w
− π
w
0
dB
dw
∂ε
f
(w
,w)
∂w
dw
(6.130)
For the discussion of (6.126) we consider an atmosphere where dT/dz < 0.
From (6.115) follows that in this case dB/dw
> 0. Utilizing (6.130) we see that
for B
g
> B(w
g
), that is the Earth’s surface is warmer than the overlying air, the first
term of (6.130) yields a positive contribution to the radiative heating rate. The same
is true for the first integral of (6.130) describing the radiative energy arriving at the
reference level from the warmer atmosphere below. The last two terms of (6.130)
are negative resulting in radiative cooling of the reference level. The expression
π B(0)∂ε(0,w)/∂w sometimes is called the cooling to space term.
A brief discussion of the classical emissivity method is mandatory. In the middle
of the twentieth century, i.e. when computers to perform radiative transfer simula-
tions were not available, the emissivity approximation was often used as a very fast
way to calculate infrared radiative flux densities and heating rates in a nonscattering
atmosphere. However, there are several disadvantages to the classical emissivity
method.
(1) The entire infrared spectral range is treated in one part, i.e. the infrared atmospheric
window is not separated from the remainder of the spectrum. While water vapor radia-
tion may dominate the radiation field outside the atmospheric window and outside the
carbon dioxide absorption band, within the window the influence of aerosol particles
and other substances is of great importance. This treatment causes substantial errors
in the radiation budget because aerosol particles and hydrometeors scatter and absorb
thermal radiation in the window region.
(2) Inclusion of scattering processes is not possible. To include scattering, we have to
proceed as shown in a previous section.
(3) A reasonably accurate treatment of the overlap of gas absorption due to several gases
is not possible because absorption by atmospheric trace gases is wavelength sensitive.
(4) Finally, it should not be overlooked that ignoring the temperature dependence of the
emissivities, see (6.123), is a crude approximation.
Rodgers (1967) presented a novel approach on the use of emissivity in atmospheric
radiation calculations. He introduced two different emissivity functions to approx-
imate the upward and downward flux densities. Moreover, he also introduced the
CO
2
contribution.

6.7 The classical emissivity approximation 189
An efficient improvement of the classical emissivity method consists in the
subdivision of the entire infrared spectral region into a certain number of frequency
intervals ν
j
, j =1,..., J . In each of these intervals we determine mean values
of the emissivity and the Planck function by setting
ε
f, j
(w, w
) ≈
1
B
j
(T
m
)
ν
j
B
ν
(T
m
)ε
f,ν
(w, w
)dν
B
j
(T
m
) ≈
ν
j
B
ν
(T
m
)dν
(6.131)
where T
m
is again a suitable mean temperature. These equations imply the assump-
tion that within ν
j
the values of B
ν
remain nearly constant.
The upward and downward directed radiative flux densities are now given as
E
+
(w) =
J
j=1
E
+, j
(w), E
−
(w) =
J
j=1
E
−, j
(w)
with E
+, j
(w) = π B
g, j
[1 − ε
f, j
(w, w
g
)] + π
w
g
w
B
j
(w
)
∂ε
f, j
(w, w
)
∂w
dw
E
−, j
(w) =−π
w
0
B
j
(w
)
∂ε
f, j
(w
,w)
∂w
dw
(6.132)
Usually, a total number of about 10 to 20 frequency bands will be sufficient to
obtain a distinct improvement of the radiative flux densities and the corresponding
heating rates.
Once the subdivision of the total infrared spectral region into several subregions
has been introduced in the emissivity method, it is only a simple task to include the
so-called overlap effects of two different absorbers. By overlap effects we mean
that two gases absorb in the same spectral region. Within a given frequency interval
ν
j
the mean transmission resulting from two absorbers 1 and 2 is given by
T
f, j
=
1
ν
j
ν
j
T
f, j,1
(ν)T
f, j,2
(ν)dν (6.133)
Let the transmission of each absorber be given by a mean transmission
¯
T
f, j
and a
deviation T
f, j
(ν). Then we obtain
T
f, j
=
1
ν
j
ν
j
¯
T
f, j,1
+ T
f, j,1
(ν)
¯
T
f, j,2
+ T
f, j,2
(ν)
dν =
¯
T
f, j
+ T
f, j
with
¯
T
f, j
=
¯
T
f, j,1
¯
T
f, j,2
, T
f, j
=
1
ν
j
ν
j
T
f, j,1
(ν)T
f, j,2
(ν)dν (6.134)

190 Two-stream methods for the solution of the RTE
If the absorption coefficients of the two gases are uncorrelated then T
f, j
vanishes.
If a correlation exists between the two absorption coefficients, then
¯
T
f
may be
determined by means of detailed line-by-line calculations as will be explained in
the following chapter.
A particularly simple situation arises if one of the two absorbers is a so-called
gray absorber, that is the absorption coefficient and thus the transmission function of
the absorber is independent of ν. This is, for instance, approximately the case when
aerosol particles or cloud droplets are considered in the infrared radiative transfer
calculations. From (6.133) it is immediately seen that now the mean transmission
is given by
T
f, j
=
T
f, j,1
ν
j
ν
j
T
f, j,2
(ν)dν (6.135)
In the literature many other attempts have been made to obtain further improve-
ments of the classical emissivity method, e.g. by including approximate ways to
describe multiple scattering processes by aerosol particles and cloud droplets, (see
e.g. Chou et al., 1999, 2001). However, by considering the tremendous increase of
computer power in the past decade or so, it might be a better idea to apply one of
the two-stream approximations described in Section 5.3 not only to the short-wave
but also to the infrared spectral region.
6.8 Radiation charts
Before the availability of large electronic computers, the exact integration of the
flux density equations over the broad infrared water vapor spectrum was virtually
impossible. By simplifying the spectrum in a reasonable manner, M¨ugge and M¨oller
(1932) integrated the radiative transfer equation by graphical means thus invent-
ing the first radiation chart. Their integration method makes it possible to easily
obtain flux densities for any atmospheric sounding if pressure, temperature and
humidity are known as a function of height. M¨oller (1943) improved the original
radiation chart by using the Schnaidt model
6
of the absorption function. Moreover,
Elsasser (1942) and later Yamamoto (1952) also devised radiation charts. These
three radiation charts differ in their outward appearance due to transformation of
coordinates, but they are equivalent in principle. For a given atmospheric sounding
the three charts also yield somewhat different flux densities since different models
of the absorption function are used. The literature also presents numerous simplified
radiation charts which will be omitted in this discussion.
6
The Schnaidt model will be presented in Section 7.2.5.
6.8 Radiation charts 191
In the meteorological practice radiation charts are no longer used. Nevertheless,
it is desirable to give a brief description how to use them since the calculation of
flux densities can be readily visualized. The radiation chart is the pre-integrated
radiative transfer equation over the wavelength domain of the infrared spectrum for
all combinations of the coordinates (w, T ) normally observed in the atmosphere.
With the help of (6.115) we easily find w(z) for an arbitrary atmospheric sounding
measuring T (z), p(z) and ρ
abs
(z). By plotting and connecting the coordinates
(w, T ) by a smooth line we obtain the image of the atmospheric sounding on the
radiation chart. The area under the curve can be measured by means of a planimeter
which represents either the upward or downward flux density for a specified refer-
ence height.
We will now briefly discuss the underlying mathematical principle of the M¨oller
radiation chart. According to (6.118) in an isothermal atmosphere of temperature
T
0
the downward directed flux density emitted by a layer of absorber mass w and
received at the reference level w(z)isgivenby
E
−
(T
0
,w) = π
∞
0
B
ν
(T
0
)[1 − T
f,ν
(0,w)]dν (6.136)
Obviously, the same relation holds for the upward directed flux density resulting
from the emission of an atmospheric layer below the reference level having the same
temperature and reduced absorber mass. Therefore, the subscripts ± are henceforth
omitted by writing
E
+
(T
0
,w) = E
−
(T
0
,w) = E(T
0
,w) (6.137)
Thus, from now on E(T,w) describes the radiative flux density received at the
reference level which has been emitted by a layer of temperature T and optical
mass w.
The contribution of an elementary layer dw of fixed temperature T to the flux
density at z is obtained by differentiating (6.137) with respect to w
dE(T,w)
dw
=−π
∞
0
B
ν
(T )
dT
f,ν
(0,w)
dw
dν (6.138)
By introducing the abbreviations
x(w) = E(T
max
,w), y(T,w) =
dE(T,w)
dw
dE(T
max
,w)
dw
(6.139)
192 Two-stream methods for the solution of the RTE
for an arbitrary atmosphere of thickness w
1
we find for the flux density
E(w
1
) =
x(w
1
)
x(0)
y[T (w),w]dx (6.140)
where T
max
is a maximum temperature, e.g. T
max
= 40
◦
C. The ratio y(T,w)was
calculated for all temperatures normally occurring in the atmosphere.
We will now briefly discuss the construction and the use of the radiation chart.
In the troposphere and the lower stratosphere water vapor and carbon dioxide by
far outweigh the influence of other radiatively active gases such as ozone. In the
wavelength region ranging from 13.5–16.5
µm, the effect of carbon dioxide is much
more important than that of water vapor. Thus M¨oller felt justified to subdivide the
infrared spectrum into two parts. In the range from 13.5–16.5
µm he assumed that
CO
2
acts completely independently of water vapor while in the remaining infrared
spectral ranges from 4–13.5
µm and 16.5–100 µm only water vapor was assumed
to be radiatively active.
To simplify the spectral integration, M¨oller divided the water vapor spectrum into
23 subintervals. In each of these, he replaced the numerous existing spectral lines
by a single composite spectral line and used the Schnaidt model to approximately
account for the overlap of neighboring spectral lines. Proceeding in this way, M¨oller
obtained x(w) and y(T,w) by numerical integration as intervals on the abscissa
and the ordinate of his chart.
Figure 6.5 displays schematically the M¨oller radiation chart whose shape is
rectangular. The smaller rectangle on the left side with horizontal isotherms is
the CO
2
chart while the larger part with curved isotherms depicts the water vapor
radiation chart. The upper isotherm T
max
is a straight line since y = 1 independent
of w, see (6.139). The combined CO
2
and H
2
O chart areas represent the flux density
emitted by a black body of temperature T
max
. Analogously, the combined areas of
the two parts under any isotherm T =const represent the black body radiation of
that temperature. The right hand ordinate of the x-axis of each part of the chart refers
w =∞where the emission of the corresponding absorber is given by the black body
radiation. Owing to the strong CO
2
absorption, in the spectral section extending
from 13.5–16.5
µm, black body radiation is almost emitted by w(CO
2
) = 10 cm
NTP (normal temperature and pressure). In the section of the water vapor spectrum
the flux density emitted by w(H
2
O) = 100gcm
−2
already approximates black body
radiation. As an example, the shaded area in Figure 6.5(a) depicts the emission
of an isothermal layer of temperature T
0
and absorber masses w(CO
2
)=1 and
w(H
2
O)=0.1. In Figure 6.5(b) we have shown the contributions of three isothermal
layers of temperatures T
i
, i = 1, 2, 3 to the total flux density. The CO
2
and H
2
O
absorber masses of these layers are assumed to be w
1
= 0.1, w
2
= 0.9 and
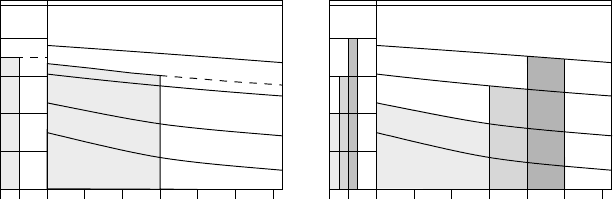
6.8 Radiation charts 193
CO
2
H
2
OCO
2
H
2
O
01
10
−1
1050
−3
10
1
0.1 1 10
A
1
A
2
A
3
T
max
T
0
T
3
T
2
T
1
(a) (b)
Fig. 6.5 Schematic radiation chart after M¨oller. Horizontal lines in the CO
2
chart
and curved lines in the H
2
O chart denote isotherms. Shaded areas describe the
radiative flux densities. (a) Emission of an isothermal layer; (b) emission of three
different isothermal layers. See also text.
w
3
= 9. In this example the total flux density is given by the sum of all three
layers in the CO
2
and the H
2
O chart.
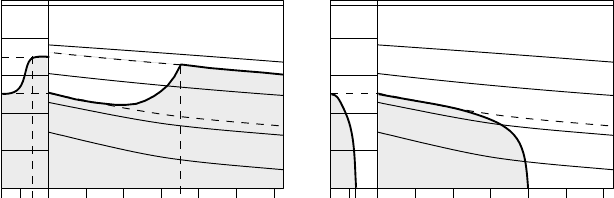
We will now briefly show how to find the upward and downward flux den-
sities with the help of the radiation chart which is equivalent to the integration
of (6.140). Utilizing (6.115) for a given atmospheric sounding we determine the
(T,w) relationship. This information will be used in (6.140) to find the curve
[x(w), y(T (w),w)]. Inserting this curve into the radiation chart one obtains the
radiation emitted by a particular layer. As an example, Figure 6.6(a) and (b)
show the resulting curves for upward and downward radiation at reference level
z with temperature T (z). The area in Figure 6.6(a) depicts the upward radiation
reaching the level from below. Starting from the point [x(w = 0), y(T (z))] the
curve approaches the isotherm T
g
at x(w
+
) where w
+
is the reduced absorber mass
of CO
2
or H
2
O between the Earth’s surface and the level z. The black body emission
of the Earth’s surface with temperature T
g
is taken into account by following the
curve from the point [x(w
+
), y(T
g
,w
+
)] along the T
g
isotherm towards the right
end of the x-axis. The area in Figure 6.6(b) describes the downward radiation at z.
Starting again at the point [x(w = 0), y(T (z))] the curve approaches the x-axis at
w
−
whereby w
−
denotes the absorber masses of carbon dioxide and water vapor
between the top of the atmosphere and the level z. By subtracting the areas under
the curves in Figure 6.6(b) from those in Figure 6.6(a) one obtains the net radiative
flux density E
net
(z). Choosing a neighboring reference layer z + z one obtains
the net flux density E
net
(z + z). The quantity E
net
= E
net
(z + z) − E
net
(z)is
proportional to the infrared radiative heating rate at level z.
Finally, it is a simple task to include the effects of a cloudy atmosphere by first
assuming a total cloud cover and black body emission of the cloud. Analogously to
the treatment of the Earth’s surface, now the corresponding (T,w) curves for upward
194 Two-stream methods for the solution of the RTE
a)
CO
2
H
2
OCO
2
H
2
O
E
+
(w)
w
+
(H
2
O)w
+
(CO
2
) w
−
(H
2
O)w
−
(CO
2
)
E
−
(w)
T
max
T
g
T (z) T (z)
(b)
(
Fig. 6.6 Schematic radiation chart after M¨oller. (a) Upward-directed radiation,
(b) downward directed radiation.
(cloud below z) or downward (cloud above z) radiation approach the isotherm of
the cloud’s temperature and follows from there the isotherm to the right end of the
x-axis.
By calculating upward and downward flux densities for the clear and the
cloud covered sky and properly weighting the individual flux densities with the
fractional cloudiness, we obtain net flux densities and heating rates for cloudy
atmospheres. M¨oller (1951) carried out numerous calculations to obtain vertical
profiles of radiative temperature changes for various air masses and found cool-
ing practically everywhere. To check the validity of his and other radiation charts
many comparisons were made with ground based and free air measurements. In
general, there was reasonable agreement. In particular, Gergen (1956, 1957, 1958)
carried out numerous free air measurements of the infrared radiation with a spherical
receiver. Zdunkowski (1963) constructed a radiation chart for a spherical receiver
using precisely M¨oller’s (1943, 1944) absorption data. He found good but not per-
fect agreement with measurements.
We conclude this section with a few additional comments on the other radia-
tion charts. Elsasser (1942) assumed that the complete 15
µmCO
2
absorption band
acts as a black absorber. Indeed, at the center of the band the absorption is almost
black for very small path lengths. However, for small pressures in the higher atmo-
sphere and at the wings of the band, the absorption is far from complete. Therefore,
Yamamoto (1952) developed a special method to treat the overlap effect of carbon
dioxide and water vapor. At the base of his diagram he provided an additional
scale to handle the overlap effect graphically. The contribution of ozone to the flux
densities was still ignored; the effect is small at low atmospheric levels. The three
charts yield compatible results.
Elsasser and Culbertson (1961) presented a set of radiation tables for the
absorption bands of atmospheric gases including ozone. Special tables were
provided to handle overlap effects. The tables are very versatile, but at the same