Yung Y.L., DeMore W.B. Photochemistry of Planetary Atmospheres
Подождите немного. Документ загружается.

256
Photochemistry
of
Planetary Atmospheres
The
major loss
of
these higher oxides
is by
photolysis. However,
a
substantial
fraction
of
NO
2
is
removed (recycled)
by
(7.16)
in
scheme
(Hlb).
The
importance
of
NO*
species
in the
catalytic chemical schemes
for the
stability
of
CO
2
has
been discussed
in
section 7.2.2.
A
small amount
of
N
2
O
may be
formed
by
A
number
of
hydroxyl
nitrogen compounds
may be
formed
by
The
primary loss process
of
these species
is
photolysis. Nitric acid
is the
most stable
of
this
set of odd
nitrogen compounds,
and
there
may be a
surface sink
due to the
formation
of
nitrate minerals
on the
surface. There
is
also
a
possibility that
N
2
Os
may
react
on the
surface
of
dust
or ice
particles
in the
atmosphere
to
form
HNO
3
directly,
but
no
quantitative estimates have been made
for
these possibilities.
7.3
Model
Results
There have
not
been major conceptual advances
in our
understanding
of the
photo-
chemistry
of the
Martian atmosphere since
the
classic reports were written
in the
early
1970s. However, there have been major advances
in
refining
the
quantitative spectro-
scopic
and
chemical kinetic data. Important examples
of
these data revisions include
the
temperature-dependent
CO
2
absorption
cross
sections
and
updating
of the
rate
coefficients
for
HO
V
and
NO,
reactions.
In
addition,
new and
better measurements
of
the
constituents
of the
atmosphere such
as
O
3
and
H
2
O
are now
available.
The
model
results
we
present
are
taken
from Nair
et
al.
(1994), which uses
as
input
the
recent
ionospheric model
of Fox
(1993).
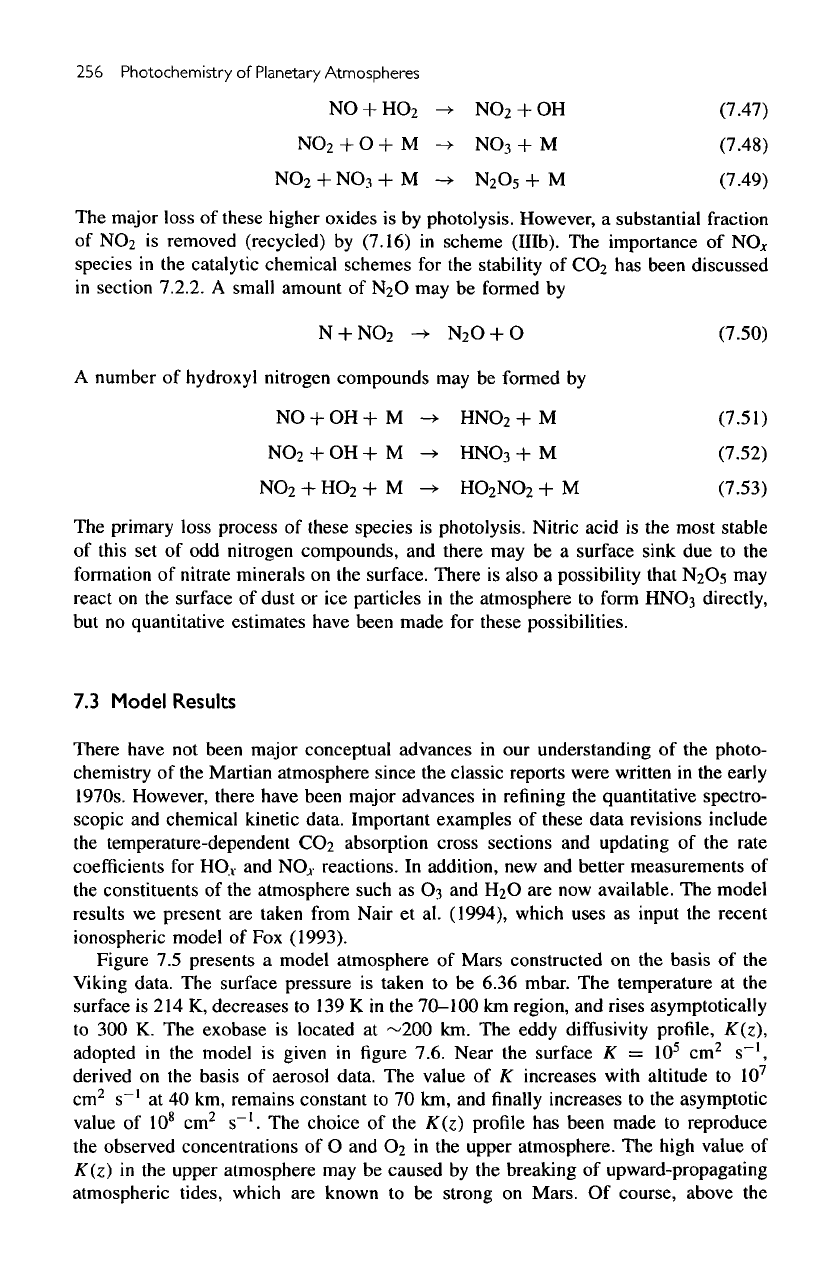
Figure
7.5
presents
a
model atmosphere
of
Mars constructed
on the
basis
of the
Viking
data.
The
surface pressure
is
taken
to be
6.36
mbar.
The
temperature
at the
surface
is 214
K,
decreases
to
139
K in the
70-100
km
region,
and
rises asymptotically
to
300 K. The
exobase
is
located
at
~200
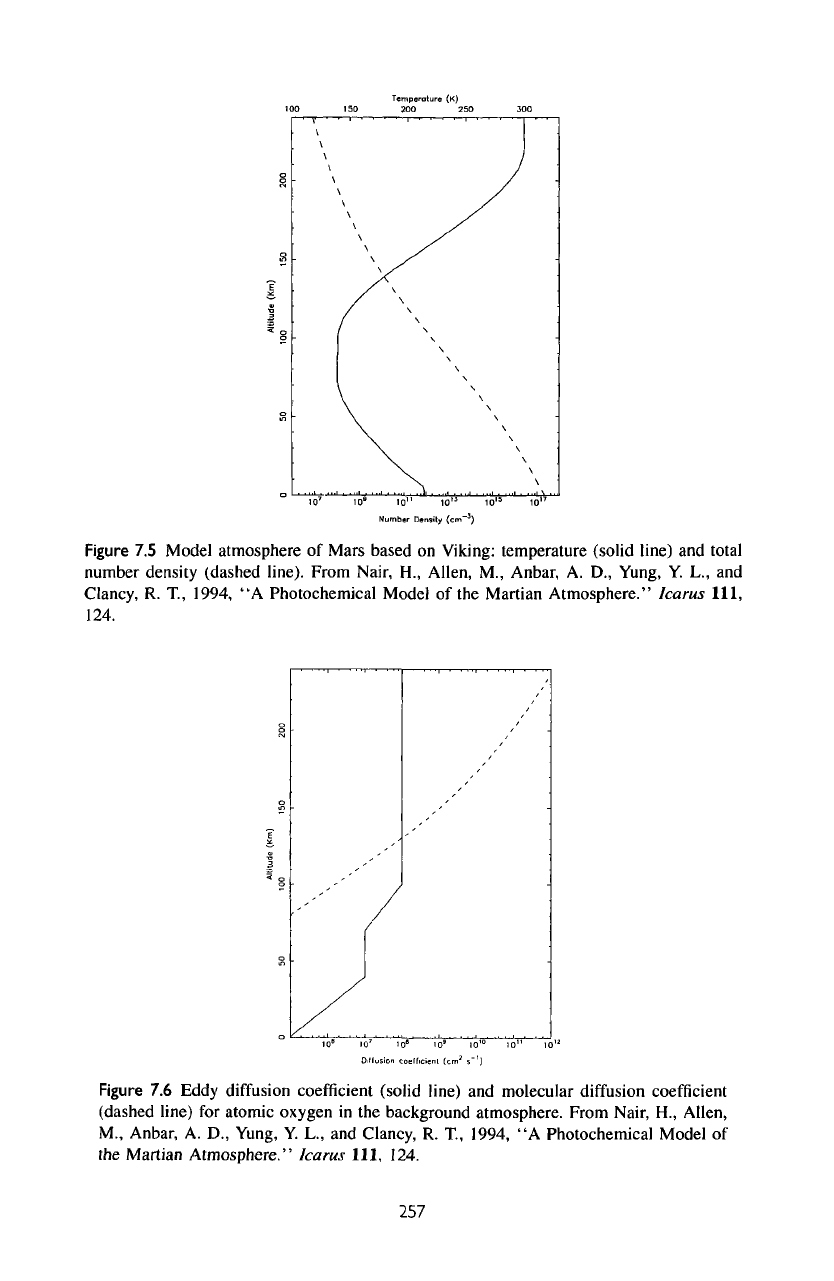
km. The
eddy
diffusivity
profile,
K(z),
adopted
in the
model
is
given
in figure
7.6. Near
the
surface
K =
10
5
cm
2
s~',
derived
on the
basis
of
aerosol data.
The
value
of K
increases with altitude
to
10
7
cm
2
s~'
at 40 km,
remains constant
to 70 km, and finally
increases
to the
asymptotic
value
of
10
8
cm
2
s~'.
The
choice
of the
K(z)
profile
has
been made
to
reproduce
the
observed concentrations
of O and
O
2
in the
upper atmosphere.
The
high value
of
K(z)
in the
upper atmosphere
may be
caused
by the
breaking
of
upward-propagating
atmospheric
tides, which
are
known
to be
strong
on
Mars.
Of
course, above
the
Figure
7.5
Model atmosphere
of
Mars based
on
Viking: temperature (solid line)
and
total
number density (dashed line).
From
Nair,
H.,
Allen,
M.,
Anbar,
A.
D.,
Yung,
Y.
L.,
and
Clancy,
R.
T,
1994,
"A
Photochemical Model
of the
Martian
Atmosphere."
Icarus
111,
124.
Figure
7.6
Eddy
diffusion
coefficient
(solid
line)
and
molecular
diffusion
coefficient
(dashed line)
for
atomic oxygen
in the
background atmosphere. From Nair,
H.,
Allen,
M.,
Anbar,
A.
D.,
Yung,
Y.
L.,
and
Clancy,
R.
T.,
1994,
"A
Photochemical Model
of
the
Martian
Atmosphere."
Icarus
111, 124.
257
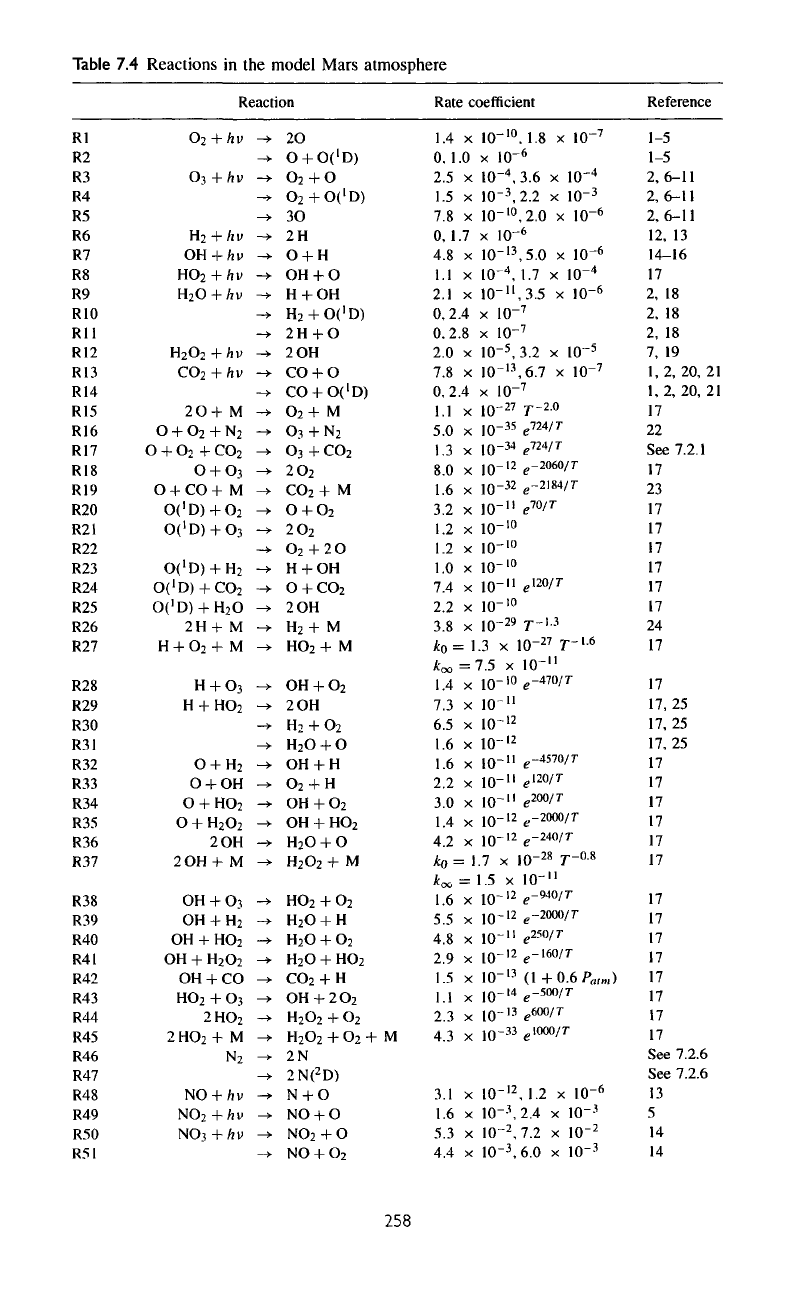
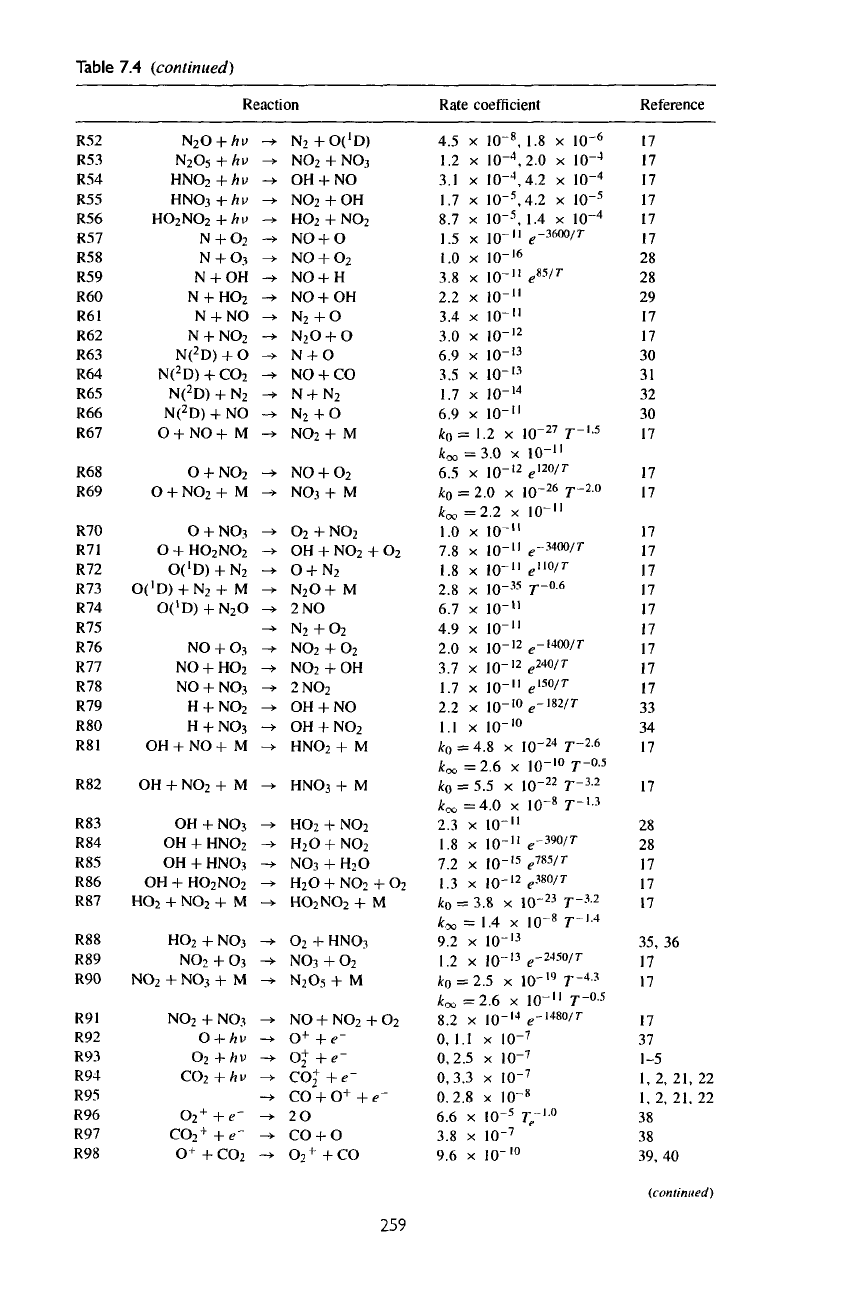
Table
7.4
Reactions
in the
model Mars atmosphere
Reaction
Rl
R2
R3
R4
R5
R6
R7
R8
R9
RIO
Rll
R12
R13
R14
R15
R16
R17
R18
R19
R20
R21
R22
R23
R24
R25
R26
R27
R28
R29
R30
R31
R32
R33
R34
R35
R36
R37
R38
R39
R40
R41
R42
R43
R44
R45
R46
R47
R48
R49
R50
R51
0
2
+
hv
O
3
+
hv
H
2
+
hv
OH
+
hv
HO
2
+
hv
H
2
O
+
hv
H
2
O
2
+hv
CO
2
+
hv
2O+ M
O
+
O
2
+
N
2
O
+
O
2
+
CO
2
0 +
0
3
O
+ CO + M
O('D)+O
2
O('D)
+
O
3
O('D)
+
H
2
O('D)
+
CO
2
O('D)
+
H
2
O
2H+ M
H
+
O
2
+ M
H
+
0
3
H
+
HO
2
O
+
H
2
O
+ OH
O
+
HO
2
0 +
H
2
0
2
2 OH
2OH+
M
OH
+
O
3
OH
+
H
2
OH
+
HO
2
OH
+
H
2
0
2
OH
+ CO
H0
2
+
0
3
2HO
2
2
HO
2
+ M
N
2
NO
+ hv
NO
2
+hv
NO)
+
hv
_>.
—
*
->
->
_»
_>.
_,.
_>.
_>
_>
_»
—
>
—
>
->.
—
>
_>
->
-y
—
>
_>
-»
_*
—
>
-».
-+
—
>
-».
->.
->
->
->
->.
_>
-».
—
»
-».
_v
_»
_>
-5.
->.
_>.
_>
_>
-».
-».
->
_»
_,.
_>
—
>
2O
O
+
O('D>
O
2
+O
O
2
+
O('D)
3O
2H
O + H
OH
+ O
H
+ OH
H
2
+
O('D)
2H
+ O
2
OH
CO
+ O
CO
+
O('D)
0
2
+
M
O
3
+
N
2
0
3
+
C0
2
20
2
CO
2
+
M
O
+
O
2
20
2
0
2
+ 20
H
+ OH
O
+
CO
2
2
OH
H
2
+
M
HO
2
+
M
OH
+
0
2
2 OH
H
2
+
O
2
H
2
O
+ O
OH
+ H
O
2
+ H
OH
+
O
2
OH
+
HO
2
H
2
O
+ O
H
2
O
2
+ M
H0
2
+
0
2
H
2
0
+ H
H
2
O
+
0
2
H
2
O
+
HO
2
CO
2
+ H
OH
+
2O
2
H
2
O
2
+
O
2
H
2
O
2
+
O
2
+ M
2N
2N(
2
D)
N
+ O
NO
+ O
NO
2
+ O
NO
+
O
2
Rate coefficient
1.4
0. 1
2.5
1.5
7.8
0, 1
4.8
1.1
2.1
x
.0
x
X
X
.7
X
X
X
0,2.4
0.2
2.0
7.8
IQ-10
. 1.8 x
10~
7
x
10'
6
to-
4
,
io-
3
,
,
0
-io
3.6 x
IO-
4
2.2
x
IO-
3
,2.0
x
10~
6
x
IO-
6
io-
13
lO'
4
10-"
,5.0
x
1Q-
6
1.7
x
10~
4
,3.5
x
IO-
6
x
10~
7
.8
x
10~
7
X
X
0,2.4
1.1
5.0
1.3
8.0
1.6
3.2
1.2
1.2
1.0
7.4
2.2
3.8
X
X
X
X
X
X
X
X
X
X
X
X
*o=l
*00
1.4
7.3
6.5
1.6
1.6
2.2
3.0
1.4
4.2
kg
-
k
x
1.6
5.5
4.8
2.9
1.5
1.1
2.3
4.3
=
X
X
X
X
X
X
X
X
X
—
X
X
X
X
X
X
X
X
IO-
5
,
io-
13
3.2 x
10~
5
,6.7
x
10~
7
x
IO-
7
io-
27
,0-35
io-
34
io-
12
io-
32
10-"
,
0
-io
,0-io
,0-io
10-"
,
0
-.o
io-
29
.3
x
7.5
x
,
0
-io
10-"
io-
12
10-
l2
10-"
10-"
10-"
10~
12
io-
12
.7
x
1.5
x
10-
'
2
io-
12
10-"
io-
12
io-
13
10-
'
4
io-
13
io-
33
r
-2.0
e
724/7-
£724/7
£-2060/7
£-2184/7-
£70/7
£120/7"
j-1.3
,0-27
7-1.6
10-"
£-470/7-
£-4570/7
£
120/7-
£200/7-
£-2000/r
£-240/r
,0-28
7-0.8
10-"
£-940/7-
£-2000/7-
£250/7-
£-160/7
(1+0.6
/>„,„,)
£-500/7-
£600/7
g
iooo/r
Reference
1-5
1-5
2,6-11
2,6-11
2,6-11
12,
13
14-16
17
2, 18
2, 18
2, 18
7, 19
1,2,20,
1,
2, 20,
17
22
See
7.2.1
17
23
17
17
17
17
17
17
24
17
17
17,25
17,
25
17,
25
17
17
17
17
17
17
17
17
17
17
17
17
17
17
21
21
See
7.2.6
See
7.2.6
3.1
1.6
5.3
4.4
X
X
X
X
io-
12
io-
3
,
io-
2
.
io-
3
.
,1.2
x
IO-
6
2.4
x
10--'
7.2 x
IO-
2
6.0 x
IO-
3
13
5
14
14
258
Table
7.4
(continued)
Reaction
R52
R53
R54
R55
R56
R57
R58
R59
R60
R61
R62
R63
R64
R65
R66
R67
R68
R69
R70
R71
R72
R73
R74
R75
R76
R77
R78
R79
R80
R81
R82
R83
R84
R85
R86
R87
R88
R89
R90
R91
R92
R93
R94
R95
R96
R97
R98
N
2
O
+
/iK
N
2
O
5
+ hv
HNO
2
+hv
HNO
3
+AK
H0
2
NO
2
+
hv
N
+
O
2
N
+
O
3
N
+ OH
N
+
HO
2
N
+ NO
N
+
NO
2
N(
2
D)
+ O
N(
2
D)
+
CO
2
N(
2
D)
+
N
2
N(
2
D)
+ NO
O
+ NO + M
O
+
NO
2
O
+
NO
2
+ M
O
+
NO
3
0+HO
2
NO
2
0('D)
+
N
2
O('D)
+
N
2
+ M
O('D)
+
N
2
O
NO
+
O
3
NO
+
HO
2
NO
+
NO
3
H
+
NO
2
H
+
NO
3
OH
+ NO + M
OH
+
NO
2
+ M
OH
+
NO
3
OH
+
HNO
2
OH
+
HNO
3
OH
+
HO
2
NO
2
HO
2
+
NO
2
+ M
HO
2
+
NO
3
NO
2
+
O
3
NO
2
+
NO
3
+ M
NO
2
+
NO
3
O
+
hv
O
2
+ hv
CO
2
+
hv
0
2
+
+e~
CO
2
+
+
e~
0
+
+
C0
2
_,.
-^.
—>
-,.
—
>
—
>
->
—
>-
—
»
->
—
>
_>
->.
—
»•
_>
_>
—
>
—
>
-^.
—
>
_>
_>.
—
*
-*
_».
_>.
->
->
—
>
—
>
_».
->
->
—
>
->
->.
->.
—
»•
-».
->
—
>
->
-»
->
->
->
—
>
N
2
+O('D)
NO
2
+
NO
3
OH
+ NO
NO
2
+ OH
HO
2
+
NO
2
NO
+ O
NO
+
O
2
NO
+ H
NO+OH
N
2
+0
N
2
O
+ O
N
+ O
NO
+ CO
N
+
N
2
N
2
+ 0
NO
2
+
M
N0
+
0
2
NO
3
+ M
O
2
+
NO
2
OH
+
NO
2
+
O
2
0 +
N
2
N
2
O+
M
2 NO
N
2
+0
2
N0
2
+
0
2
NO
2
+ OH
2NO
2
OH
+ NO
OH
+
NO
2
HNO
2
+ M
HNO
3
+ M
HO
2
+
NO
2
H
2
0
+
N0
2
NO
3
+
H
2
O
H
2
O
+
NO
2
+
O
2
HO
2
NO
2
+ M
0
2
+
HN0
3
NO
3
+
O
2
N
2
O
5
+ M
NO
+
NO
2
+
O
2
0+
+e-
0+ +
«?-
C0
2
+
+
e~
CO
+
0+
+
e'
2O
CO
+ 0
O
2
+
+CO
Rate coefficient
4.5 x
10"
8
,
1.8 x
10'
6
1.2
x
10-
4
,2.0
x
10~
4
3.1
x
10-
4
,4.2
x
10~
4
1.7
x
10-
5
,4.2
x
1Q-
5
8.7 x
1Q-
5
,
1.4 x
10~
4
1.5
x
10-"
e-
1M
°f
T
1.0
x
1Q-'
6
3.8
x
10-"
e
ss
'
T
2.2
x
10-"
3.4
x
10-"
3.0
x
10-'
2
6.9 x
10~
13
3.5
x
10-
l3
1.7
x
10-'
4
6.9
x
10-"
*o=
1.2 x
10~
27
7-'-
5
k
x
= 3.0 x
10-"
6.5
x
10-'
2
e™'
7
k
0
= 2.0 x
10-
26
T~
2
-°
*oc
=2.2
x
10-"
1.0
x
10-"
7.8
x
10-"
e-MWT
1.8
x
10-"
e
no
/
T
2.8
x
10-
35
7-°-
6
6.7
x
10-"
4.9
x
10-"
2.0 x
10-
12
e-i-wo/r
3.7 x
io-'2
e
MO/7-
1.7
x
10-"
e
150
/
7
"
2.2
x
io-'0
e
-i82/r
1.1
x
10-'°
/to
=4.8
x
IO-
24
7-
2
-
6
*oo=2.6
x
lo-
|0
7-°-
5
/to
= 5.5 x
10~
22
r~
3
-
2
k
x
=4.0
x
10-
8
7-'-
3
2.3
x
10'"
1.8
x
10-"
e
-390/T
7.2
x
10-'
5
f
785
/r
1.3
x
io-'
2
f
3
80/7-
k
0
= 3.8 x
10~
23
7-
3
-
2
*«,
= 1.4 x
10-
8
7-'
4
9.2 x
10~
13
1.2
x
io-'
3
e-M50/r
/to
= 2.5 x
10-
]9
T~
4
-
}
k^=2.6
x
10-"
7-°
5
8.2
x
IO-'
4
e
-
l4m
'
T
0, 1.1 x
10~
7
0,2.5
x
10~
7
0,3.3
x
10-
7
0.2.8
x
10-
8
6.6 x
!0~
5
r,-'-°
3.8
x
10-
7
9.6 x
10-
I0
Reference
17
17
17
17
17
17
28
28
29
17
17
30
31
32
30
17
17
17
17
17
17
17
17
17
17
17
17
33
34
17
17
28
28
17
17
17
35,
36
17
17
17
37
1-5
1,
2, 21, 22
1,
2, 21. 22
38
38
39,40
259
(continued)
260
Photochem
istry
of
Planetary
Atmospheres
Table
7.4
(continued)
Reaction
R99
R100
R101
R102
R103
R104
O+
CO
2
+
-»•
-»
C0
2
+
+
H
2
->
CO
2
H
+
+
«--»•
HO
2
+
grain
->
(H0
2
)
grain
+ OH
-»
o
2
+
+ CO
O+
+
CO
2
CO
2
H+
+ H
CO
2
+ H
(HO
2
)
gra
jn
H
2
O
+
O
2
Rate
coefficient
1.6
x
)0~
10
9.6
x
10-"
4.7
x
10-'°
3.0
x
10-
7
Reference
39, 40
39,40
39,40
41
Unils
are s
'
for
photolysis
reactions,
cm
3
s
'
for
two-body reactions,
and
cm
6
s
'
for
three-body
reactions.
Photolysis
rate
coefficients
are
given
at
the
ground
and at the top of the
model atmosphere (240 km).
k
0
andk
x
are
the
low and
high pressure rate
coefficients,
respectively,
for
three-body reactions.
References:
(I)
See
references
in
Yung
et
al.
(1988)
and
Anbar
et
al.
(1993a),
also
Nicolet
(1984),
Lee et
al.
(1977),
Samson
et al.
(1982);
(2) See
references
in
Anbar
et al.
(1993a), also
Taherian
and
Slanger
(1985),
Turnipseed
et al.
(1991),
Wine
and
Ravishankara
(1982), Brock
and
Watson
(1980),
Sparks
el al.
(1980),
Fairchild
et
al.
(1978);
(3)
Mentall
and
Gentieu (1970),
R.
Gladstone, private communication;
(4) Nee and Lee
(1984),
van
Dishoeck
and
Dalgarno
(1984),
van
Dishoeck
et al.
(1984);
(5)
DeMore
et al.
(1990);
(6) See
references
in
Anbar
et al.
(I993a), also Philips
et al.
(1977);
(7)
Schiirgers
and
Welge
(1968), DeMore
et al.
(1990);
(8)
See
references
in
Yung
et al.
(1988)
and
Anbar
et al.
(1993a),
also
Kronebusch
and
Berkowitz
(1976),
Masuoka
and
Samson
(1980);
(9) Lin and Leu
(1982);
(10)
Baulch
et al.
(1976);
(11)
Tsang
and
Hampson
(1986);
(12)
DeMore
et al.
(1990), Keyser (1986); (13)
Allen
and
Frederick (1982);
(14)
DeMore
et al.
(1990), Magnotta
and
Johnston
(1980);
(15)
Atkinson
et al.
(1989); (16)
Brune
et al.
(1983);
(17)
Fell
et al.
(1990);
(18) Piper
et al.
(1987);
(19)
Schofield
(1979); (20)
Ko
and
Fontijn
(1991);
(21)
Boodaghians
et al.
(1988);
(22)
Hall
et al.
(1988),
Mellouki
et al.
(1988); (23) Samson
and
Pareek
(1985); (24)
McElroy
et al.
(1977); (25)
Anicich
and
Huntress
(1986),
Anicich
(1993); (26) Kong
and
McElroy (I977a).
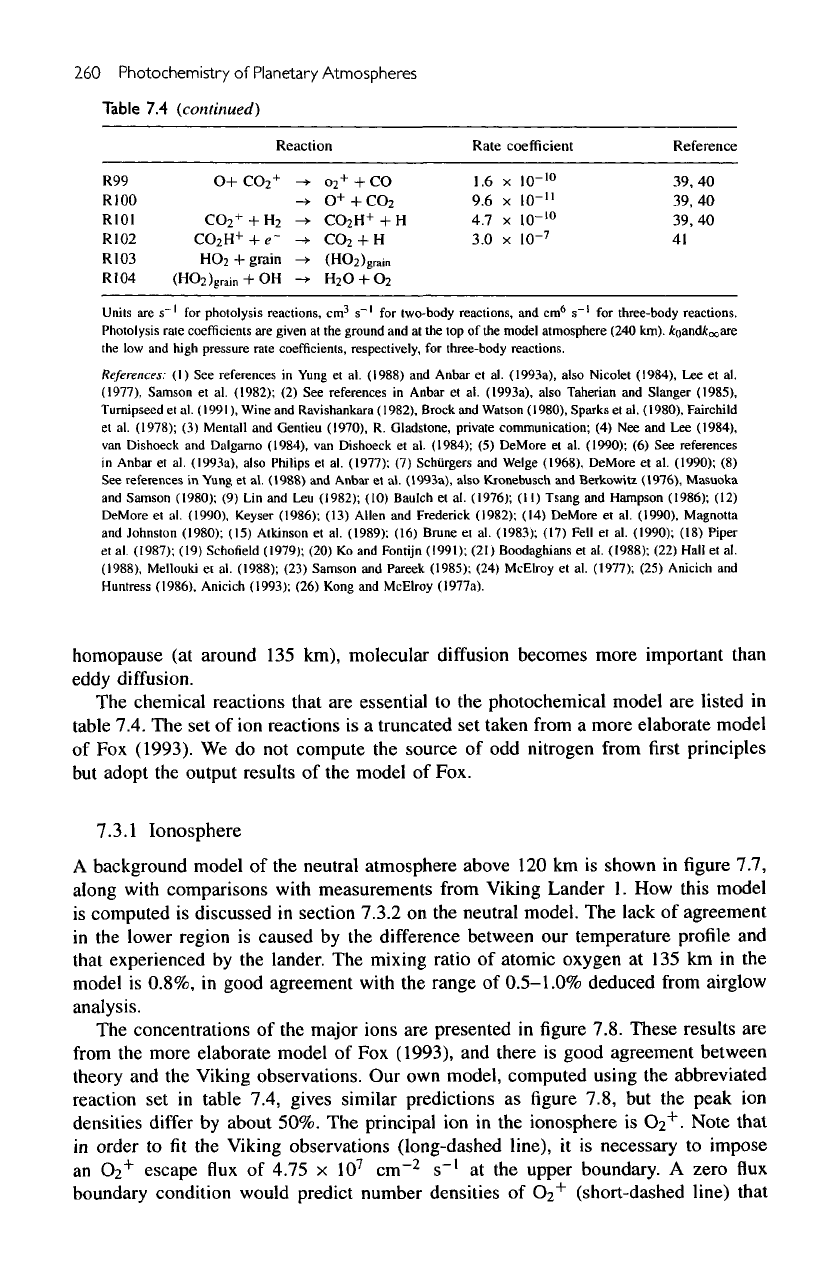
homopause
(at
around
135
km), molecular
diffusion
becomes
more
important than
eddy
diffusion.
The
chemical reactions
that
are
essential
to the
photochemical model
are
listed
in
table
7.4.
The set of ion
reactions
is a
truncated
set
taken
from
a
more elaborate model
of Fox
(1993).
We do not
compute
the
source
of odd
nitrogen from
first
principles
but
adopt
the
output results
of the
model
of
Fox.
7.3.1
Ionosphere
A
background model
of the
neutral atmosphere above
120 km is
shown
in figure
7.7,
along
with
comparisons
with
measurements from Viking Lander
1. How
this model
is
computed
is
discussed
in
section 7.3.2
on the
neutral model.
The
lack
of
agreement
in
the
lower region
is
caused
by the
difference between
our
temperature profile
and
that
experienced
by the
lander.
The
mixing
ratio
of
atomic oxygen
at
135
km in the
model
is
0.8%,
in
good agreement
with
the
range
of
0.5-1.0%
deduced
from
airglow
analysis.
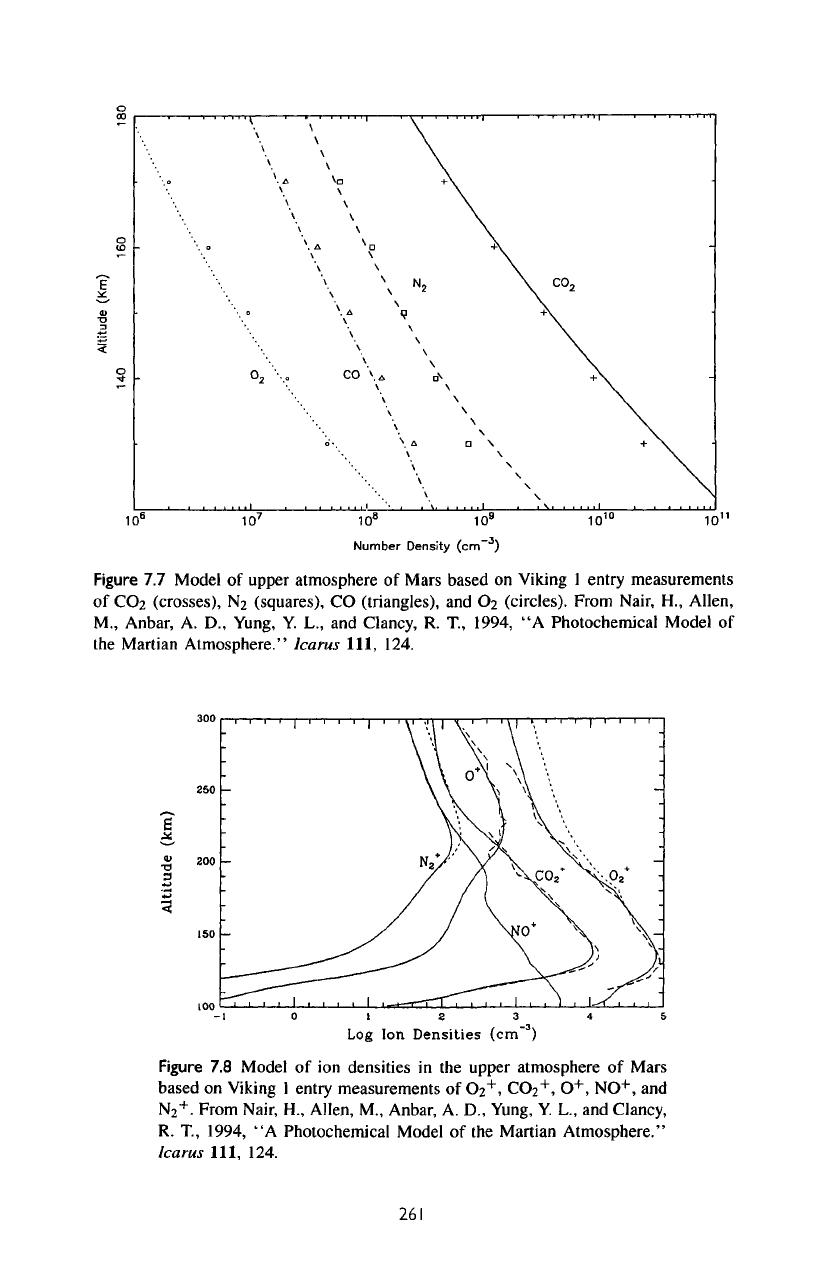
The
concentrations
of the
major ions
are
presented
in figure
7.8.
These
results
are
from
the
more elaborate model
of Fox
(1993),
and
there
is
good agreement between
theory
and the
Viking observations.
Our own
model, computed using
the
abbreviated
reaction
set in
table 7.4, gives similar predictions
as figure
7.8,
but the
peak
ion
densities
differ
by
about 50%.
The
principal
ion in the
ionosphere
is
O2
+
.
Note
that
in
order
to fit the
Viking
observations (long-dashed
line),
it is
necessary
to
impose
an
O2
+
escape
flux of
4.75
x
10
7
cm~
2
s~'
at the
upper boundary.
A
zero
flux
boundary
condition would predict number densities
of
O
2
+
(short-dashed line) that
Figure
7.7
Model
of
upper atmosphere
of
Mars
based
on
Viking
1
entry measurements
of
CO
2
(crosses),
N
2
(squares),
CO
(triangles),
and
O
2
(circles). From Nair,
H.,
Allen,
M.,
Anbar,
A. D.,
Yung,
Y. L., and
Clancy,
R.
T,
1994,
"A
Photochemical Model
of
the
Martian Atmosphere." Icarus 111, 124.
Figure
7.8
Model
of ion
densities
in the
upper atmosphere
of
Mars
based
on
Viking
1
entry measurements
of
O
2
+
,
CO
2
+
,
O
+
,
NO+,
and
N
2
+
.
From
Nair,
H.,
Allen,
M.,
Anbar,
A.
D.,
Yung,
Y.
L.,
and
Clancy,
R.
T.,
1994,
"A
Photochemical Model
of the
Martian
Atmosphere."
Icarus
111, 124.
261
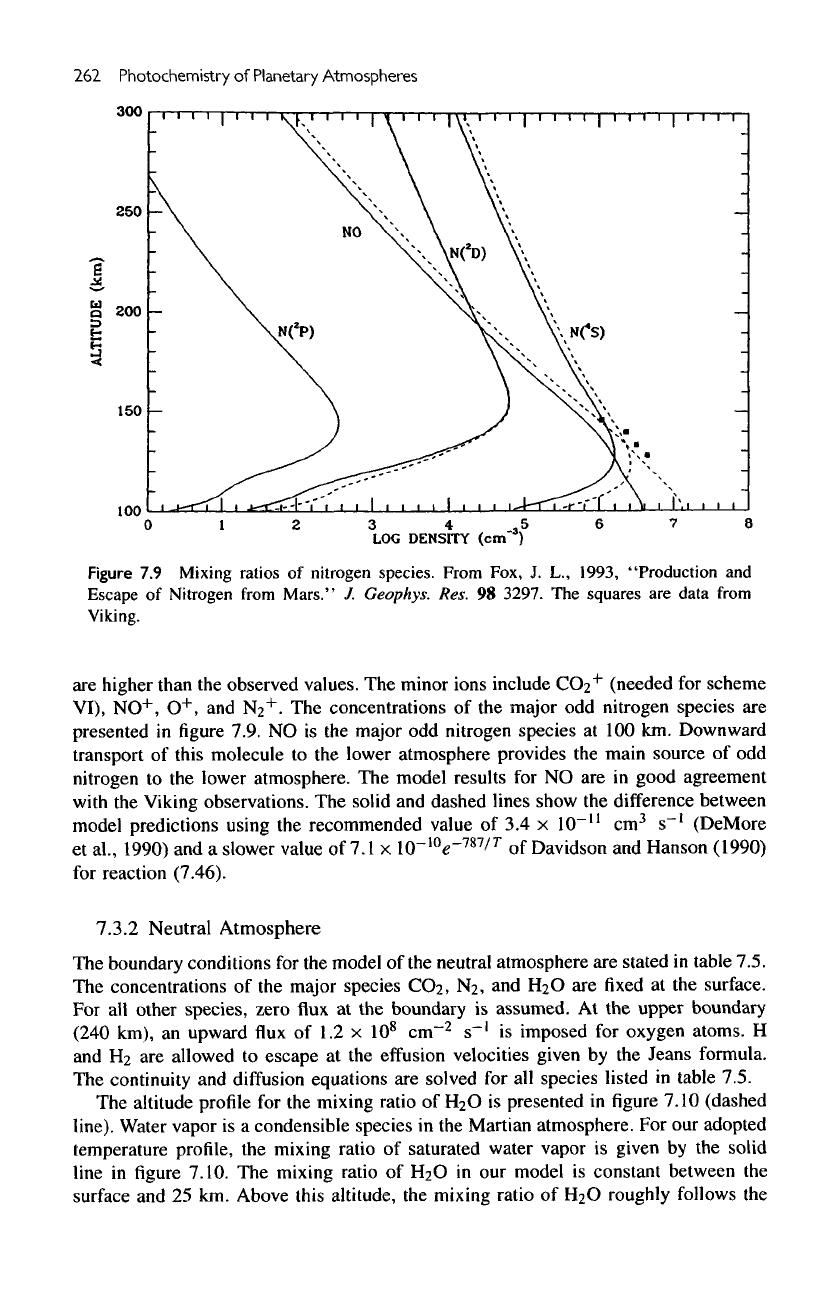
262
Photochemistry
of
Planetary
Atmospheres
Figure
7.9
Mixing
ratios
of
nitrogen species. From
Fox,
J. L.,
1993,
"Production
and
Escape
of
Nitrogen
from
Mars."
7.
Geophys.
Res.
98
3297.
The
squares
are
data
from
Viking.
are
higher than
the
observed values.
The
minor ions include
CC>2
+
(needed
for
scheme
VI),
NO
+
,
O
+
,
and
N2
+
.
The
concentrations
of the
major
odd
nitrogen
species
are
presented
in figure
7.9.
NO is the
major
odd
nitrogen
species
at 100 km.
Downward
transport
of
this molecule
to the
lower atmosphere provides
the
main source
of odd
nitrogen
to the
lower atmosphere.
The
model results
for NO are in
good
agreement
with
the
Viking observations.
The
solid
and
dashed lines show
the
difference between
model predictions using
the
recommended value
of 3.4 x
10~"
cm
3
s~'
(DeMore
et
al.,
1990)
and a
slower
value
of 7.1 x
10-
10
<r
787
/
r
of
Davidson
and
Hanson
(1990)
for
reaction
(7.46).
7.3.2 Neutral
Atmosphere
The
boundary conditions
for the
model
of the
neutral atmosphere
are
stated
in
table
7.5.
The
concentrations
of the
major species CO2,
N2, and
F^O
are fixed at the
surface.
For all
other
species,
zero
flux at the
boundary
is
assumed.
At the
upper
boundary
(240 km),
an
upward
flux of 1.2 x
10
8
cm~
2
s~'
is
imposed
for
oxygen atoms.
H
and
Hb
are
allowed
to
escape
at the
effusion
velocities given
by the
Jeans formula.
The
continuity
and
diffusion
equations
are
solved
for all
species listed
in
table
7.5.
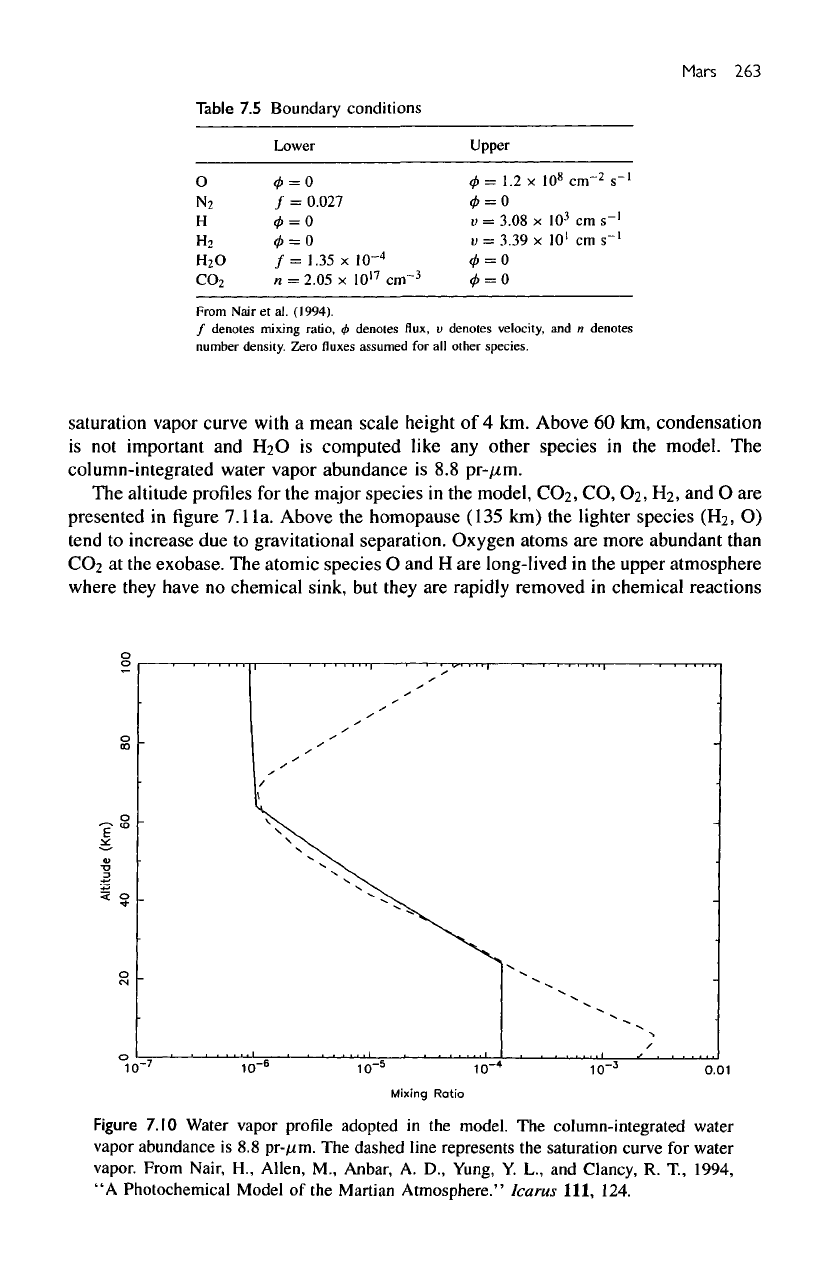
The
altitude profile
for the
mixing ratio
of H2O is
presented
in figure
7.10
(dashed
line).
Water vapor
is a
condensible species
in the
Martian atmosphere.
For our
adopted
temperature
profile,
the
mixing
ratio
of
saturated water vapor
is
given
by the
solid
line
in figure
7.10.
The
mixing
ratio
of H2O in our
model
is
constant between
the
surface
and 25 km.
Above
this
altitude,
the
mixing
ratio
of H2O
roughly
follows
the
Mars
263
Table
7.5
Boundary conditions
Lower
Upper
O
N
2
H
H-,
H
2
0
C0
2
0
= 0
f
=
0.027
0 = 0
</>
= 0
/=
1.35
x
10~
4
n
=2.05
x
10'
7
cm"-
3
0 = 1.2 x
I0
8
cm-
2
s"
1
0 = 0
v
=
3.08
x
10
3
cm
s~'
v
=
3.39
x
10'
cm
s~'
0
= 0
0 = 0
From
Nairetal.
(1994).
/
denotes
mixing
ratio,
0
denotes
flux, v
denotes
velocity,
and n
denotes
number density.
Zero
fluxes
assumed
for all
other
species.
saturation vapor curve with
a
mean
scale
height
of 4 km.
Above
60 km,
condensation
is
not
important
and
EbO
is
computed like
any
other
species
in the
model.
The
column-integrated water vapor abundance
is 8.8
pr-fim.
The
altitude profiles
for the
major
species
in the
model,
CO2,
CO,
Ch,
H2, and O are
presented
in figure
7.1
la.
Above
the
homopause
(135
km) the
lighter
species
(F^,
O)
tend
to
increase
due to
gravitational separation. Oxygen
atoms
are
more
abundant than
CO2
at the
exobase.
The
atomic
species
O and H are
long-lived
in the
upper atmosphere
where they have
no
chemical sink,
but
they
are
rapidly
removed
in
chemical
reactions
Figure
7.10
Water vapor
profile
adopted
in the
model.
The
column-integrated water
vapor abundance
is 8.8
pr-^im.
The
dashed line represents
the
saturation curve
for
water
vapor.
From
Nair,
H.,
Allen,
M.,
Anbar,
A. D.,
Yung,
Y.
L.,
and
Clancy,
R.
T,
1994,
"A
Photochemical Model
of the
Martian
Atmosphere." Icarus 111, 124.
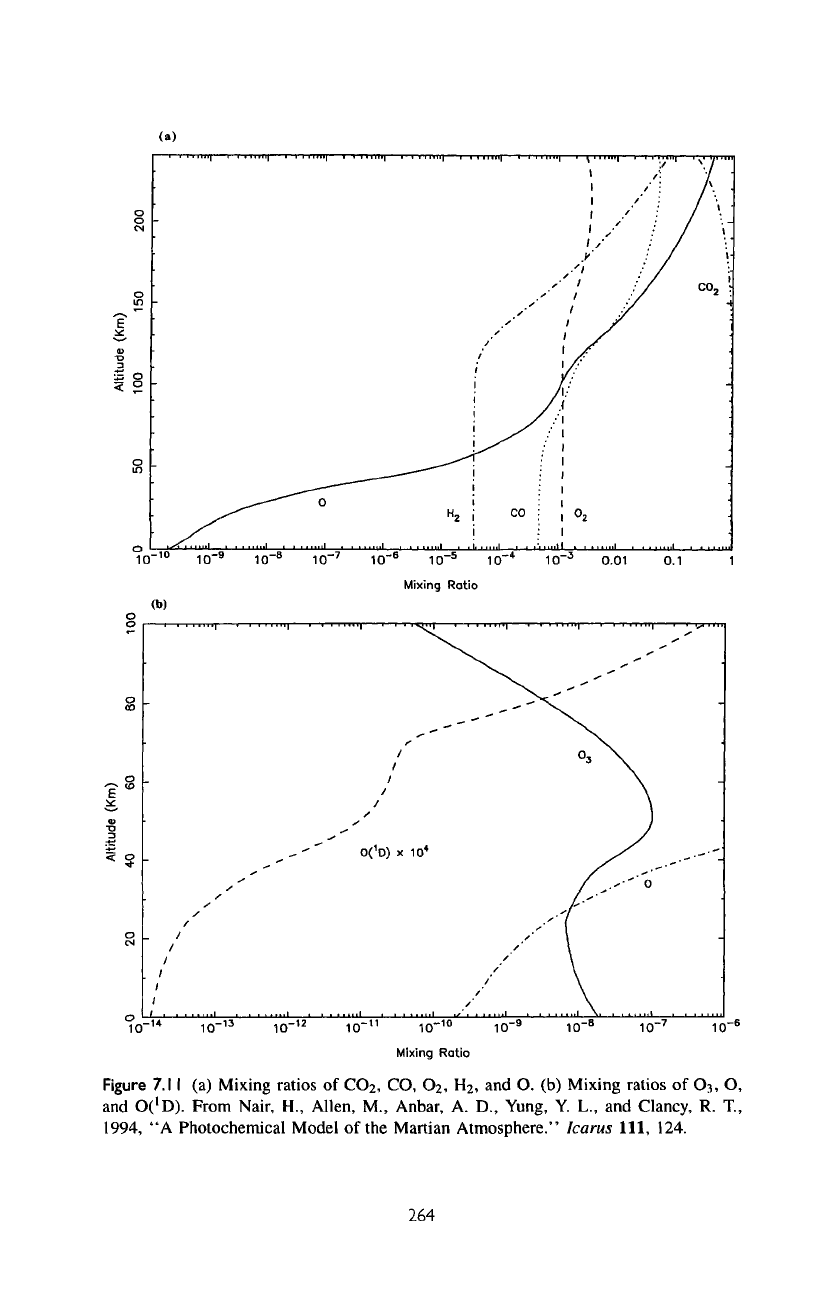
Figure
7.11
(a)
Mixing
ratios
of
CO
2
,
CO,
O
2
,
H
2
,
and O. (b)
Mixing ratios
of
O
3
,
O,
and
O('D).
From Nair,
H.,
Allen,
M.,
Anbar,
A.
D.,
Yung,
Y.
L.,
and
Clancy,
R.
T.,
1994,
"A
Photochemical Model
of the
Martian Atmosphere." Icarus 111, 124.
264
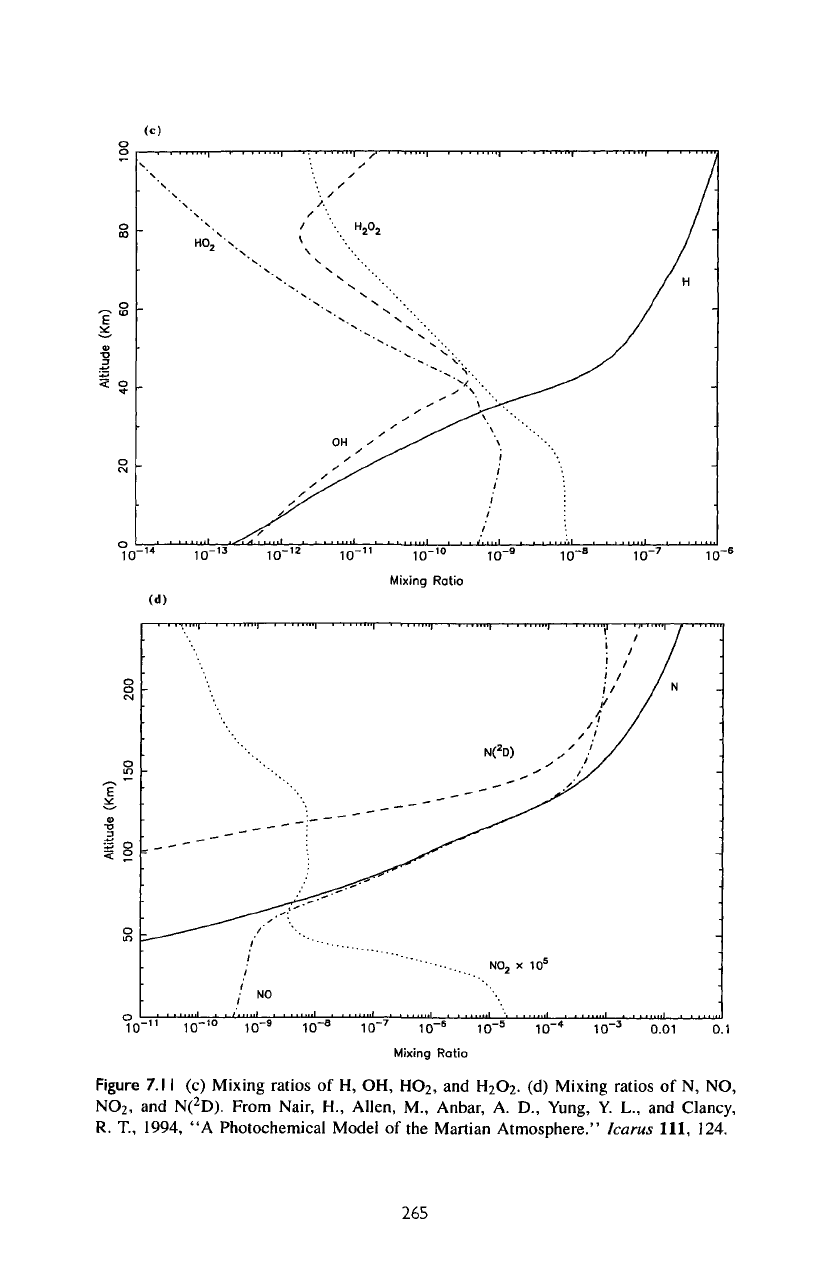
Figure
7.
1 1
(c)
Mixing ratios
of H, OH,
HO
2
,
and
H
2
O
2
.
(d)
Mixing
ratios
of N, NO,
NO
2
,
and
N(
2
D).
From Nair,
H.,
Allen,
M.,
Anbar,
A.
D.,
Yung,
Y. L., and
Clancy,
R.
T.,
1994,
"A
Photochemical Model
of the
Martian Atmosphere." Icarus 111, 124.
265