Yellampalli S. (ed.) Carbon Nanotubes - Polymer Nanocomposites
Подождите немного. Документ загружается.


Carbon Nanotubes as Conductive Filler
in Segregated Polymer Composites - Electrical Properties
177
where φ
c
is the value of percolation threshold for the randomly distributed filler. This model
gives the value of φ
cs
coincident with the experimental results for PVC/Ni composite at the
number of layers of conductive particles n=2, i.e. every polymer particle is covered with a
monolayer of conductive particles. Computer simulation on the base of similar model with
the linear size of the system
2048 in 2D case and
200 of calculated units in 3D case
allowed estimation the value of percolation threshold x
c
in such a manner (Lebovka et al.,
2006):
x
c
=p
c
[1-(1+n
eff
/
)
-
] (3)
where p
c
is a percolation concentration for the random percolation problem in the infinite
system, n
eff
is an effective number of the conductive layers (n
eff
/n=1+cn
-k
, the c and k
parameters are different for 2D or 3D systems, i.e. when
is 2 or 3, respectively),
=D/d,
is
the dimension of system. The equations (2) and (3) give close values of the percolation
threshold and satisfactory agreement with the experimental data in PVC/Cu composites.
3. Carbon nanotubes in segregated systems
The investigations of segregated systems have got a new impulse with expansion of the
carbon nanotubes area, namely as conductive filler in polymer composites. It is caused by
possibility to reach still lower value of percolation threshold than for carbon nanotubes and
segregated systems separately. Authors (Mierczynska et al., 2004) formed a segregated
structure using UHMWPE and single-walled carbon nanotubes (SWCNT) and obtained the
value of the percolation threshold equal to 0.5-1.5% depending on type of SWCNT. In next
extensive paper the authors (Mierczynska et al., 2007) have shown the influence of CNTs
type on the value of φ
c
, for example, they found low value of φ
c
=0.095 % in case of MWCNT
and 0.3-0.7 % for single-walled nanotubes. Big variation of the percolation threshold values
was observed for different methods of the segregated systems preparation, thus previous
dispersion of CNTs in solvents gave ten times lower value of percolation threshold for the
dispersion of SWCNT in DMF versus dry SWCNT. Interesting to note that influence of the
processing parameters is similar to that in the segregated systems based on carbon black
and metals, namely insignificant influence of pressure and temperature of compacting, and
the rise of conductivity with increasing of mixing time of the polymer powder/CNTs
mixture. The comparison of CB/UHMWPE and MWCNT/UHMWPE segregated systems
has shown that the values of percolation thresholds were less than 0.5 % in both of cases
(Hao et al., 2008). Investigation of conductivity of the MWCNT/UHMWPE composites (Gao
et al., 2008) has revealed two-dimensional character of the MWCNT structure and low value
of percolation threshold (φ
c
=0.072 %). In this study the value of critical parameter t in the
scaling relation that describes the conductivity above φ
c
=
0
(
-
c
)
t
(4)
was equal to 1.15 whereas a theory predicts the value of t=1.6-2 for 3D conductive structure
that is evidence of two-dimensional structure of conductive phase. In ref. (Du et al., 2011)
two types of segregated structures based on MWCNT and graphite nanosheets (GNS)
formed in HDPE matrix were compared. Lower value of percolation threshold (φ
c
=0.15 %)
and higher conductivity was revealed in the MWCNT/HDPE composites in comparison
with the GNS/HDPE composites (φ
c
=1 %).

Carbon Nanotubes – Polymer Nanocomposites
178
Introduction of CNTs into polymer emulsions is of benefit to creation of the conductive
segregated structure with low value of percolation threshold, for example φ
c
=0.2 % in styrene-
isoprene emulsion with SWCNT (Ha et al., 2007). The iPP-g-MA nanocomposites, initially
artificially brought into a latex form after polymerization, displayed extremely low electrical
percolation threshold values of the order of 0.05 % and 0.1 % for SWCNT- and MWCNT-based
systems, respectively (Grossiord et al., 2010). The PVA-functionalized CNTs were dispersed in
the acrylic latex matrix and obtained nanocomposite films exhibited low optical absorption
coefficients. It is expected that this type of nanocomposite coating will potentially exhibit high
thermal and electrical conductivity along with high wear-resistance (Vandervorst et al., 2006).
A percolation threshold below 0.04% of SWCNT was achieved when an emulsion polymer
(i.e., latex) has been used as the polymer matrix (Grunlan et al., 2004). Formation of the
segregated SWCNT structure in PVA emulsion allows achievement of high electrical
conductivity (48 S/cm) and acceptable thermopower at low thermal conductivity in solid state
of the composite that indicates the promising applications of such a type of materials in
thermoelectric systems for collection and generation of energy (Yu et al., 2008).
4. Segregated PVC/MWCNT and UHMWPE/MWCNT systems
An excursus in a history of development of the segregated systems indicates that polyvinyl
chloride is the most acceptable polymer for creation of segregated composites processed by
hot compacting due to its high viscosity, a variety of the powdered PVC types with different
size of particles manufactured by industry, wide temperature range of softening (as a result
of its amorphous structure) that facilitates a processing (Kusy, 1986). Second attractive
polymer is UHWMPE which has very high viscosity, acceptable temperature range of the
processing and good mechanical properties.
4.1 The processing features of segregated PVC/MWCNT composites
Electrical, thermal conductivity and dielectric properties of the PVC/MWCNT segregated
system depending on concentration of the nanotubes in wide temperature and frequency
range have been studied.
Polyvinyl chloride was used in the powder form with average size of particles of 100 m
and density of 1.37 g/cm
3
. Ultrahigh molecular weight polyethylene Hostalen GUR, type
GHR 8110, in a powdered form with average size of particles about 100 m and density of
0.95 g/cm
3
was used. The multiwalled nanotubes were produced by TMSpetsmash
(Ukraine) using CVD-method. The MWCNT typically had diameter b about 12-20 nm and
their length l was about tens of microns (m) that results in the value of aspect ratio l/b
about 1000. Value of the nanotubes density has been taken 2.045 g/cm
3
(Lisunova et. al.,
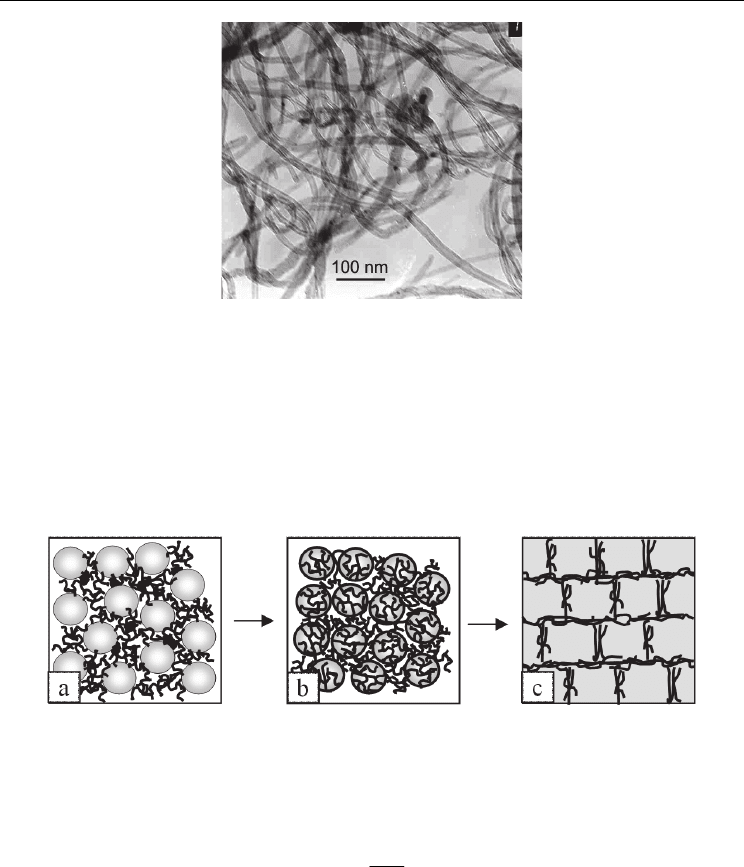
2007). The TEM image of the MWCNT is shown in Fig. 4.
Fig. 5 represents a transformation of PVC/MWCNT structure from mechanical mixture of
PVC powder and CNTs (a) to hot compacted segregated composite (c). There is only one
distinction compared to Fig.1, namely the presence of intermediate stage (b) that provides the
even distribution of tangled CNTs on the surface of polymer grains. It is indispensable
condition of the hot compacted system having perfect conductive network without aggregates.
In this case one can expect to obtain the conductive composite with low value of the
percolation threshold. This has been reached by preliminary solution of MWCNT in ethanol
Carbon Nanotubes as Conductive Filler
in Segregated Polymer Composites - Electrical Properties
179
Fig. 4. TEM image of multiwalled carbon nanotubes used for preparation of the composites.
with following exposition during 20 min under ultrasonic action with frequency of 22 kHz.
The sonicated MWCNT and PVC powder were homogenized by thorough grinding in a
porcelain mortar to the visually homogeneous state. Homogenized composite was placed
into a hot steel mold heated to 145 ºC and then pressed (hot compacted) during 5 min at 20
MPa with subsequent cooling of the mold in the air flow to room temperature. The samples
of pressed composites used for dielectric and electrical measurements were produced as
discs with 30 mm diameter and 1-1.5 mm height.
Fig. 5. A model of evolution of the PVC/MWCNT structure along a process of its forming
by hot compacting method
The DC electrical conductivity was measured using a two-contact scheme. The values of DC
conductivity
DC
(S/cm) were estimated using the following equation:
h
RS
(5)
where R (Ohm) is an electrical resistance measured experimentally using E6-13
teraohmmeter, and h (cm) and S (cm
2
) are the thickness and area of the sample, respectively.
The characterization of the dielectric parameters of the samples, such as real
part of the
dielectric permittivity and AC conductivity
AC
, were determined by means of the
Novocontrol system in the frequency range from 10
-1
Hz to 10
6
Hz at room temperature.
Thermal conductivity was measured by method described in (Boudenne et al., 2004). The
structure of nanotubes was examined using transmission electron microscope (TEM) Philips
Carbon Nanotubes – Polymer Nanocomposites
180
CM120. The investigations of structure of the PVC/MWCNT composites were fulfilled
using the scanning electron microscope (SEM) Hitachi S800 and the optical microscope Carl
Zeiss Primo Star.
4.2 Structure of segregated PVC/MWCNT system
The structure of hot compacted PVC/MWCNT system was studied by optical and electron
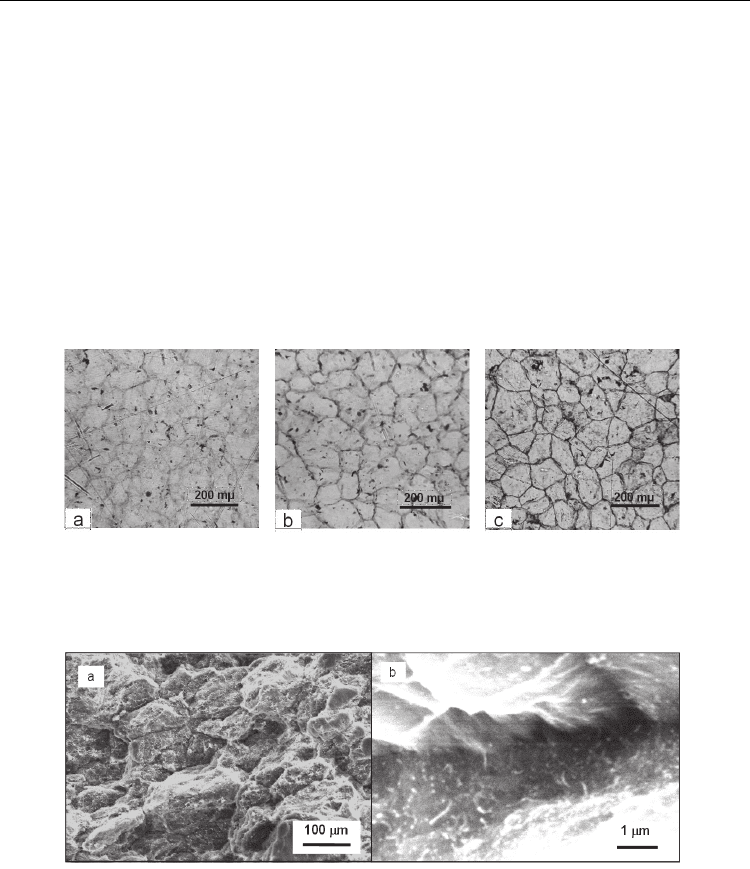
(SEM) microscopy. Figs. 6 and 7 display the segregated structure of composites. Optical
microscope images of the segregated PVC/MWCNT structure are presented in Fig. 6. It
shows the evolution of the composite structure along increase of the MWCNT concentration
from 0.02 % that is below percolation threshold
c
(Fig. 6-a) through 0.04 % (close to
c
) (Fig.
6-b) to 0.07 % (above
c
) (Fig. 6-c). One can see more pronounced boundaries between
polymer grains, blackened by nanotubes, with increase of the MWCNT content that reflects
a creation of the nanotubes framework.
Fig. 6. Optical microscope images of segregated PVC/MWCNT composites with the
MCWNT content: a - below (0.02%), b - close (0.04%) and c - above (0.07%) percolation
threshold.
Fig. 7. SEM image of the PVC/MWCNT composite after cryogenic fracture: a – hot
compacted composite, b – intergrain surface in the composite.
Hot pressing deforms polymer particles and results in formation of compacted continuous
polymer phase, where conductive paths of CNTs are located on the boundaries between
particles. Fig. 7 demonstrates the SEM images of PVC/MWCNT composite prepared by the
fracture in liquid nitrogen. It is seen a granular structure of the polymer matrix with
granules covered by nanotubes (Fig. 7-a). The presence of nanotubes on the surface between
grains displays Fig. 7-b.
Carbon Nanotubes as Conductive Filler
in Segregated Polymer Composites - Electrical Properties
181
4.3 Electrical properties of segregated PVC/MWCNT composites
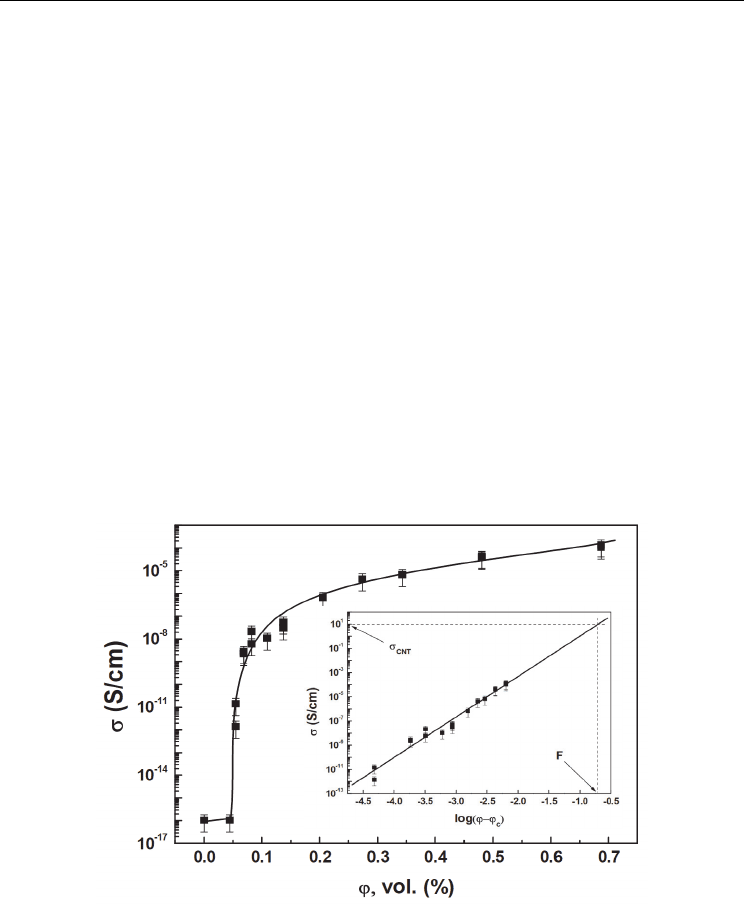
The concentration dependence of DC conductivity
of the PVC/MWCNT composites is
represented in Fig. 8. The electrical conductivity of composites abruptly increases by many
orders of magnitude when the filler content
exceeds the threshold concentration
c
. It can
be seen that the non-conducting - conducting state transition takes place at a rather small
volume content of MWCNT, approximately equal to 0.05 vol. %. The electrical conductivity
behavior above the percolation threshold can be described by the equation (4). In this
equation the critical exponent t reflects dimensionality of the system and universality class
of the problem (Stauffer & Aharony, 1992),
0
is an adjustable parameter. The theoretical
random percolation value t is close to 2.0 for the three-dimensional system.
Insertion to Fig. 8 shows scaling of
versus φ–φ
c
in the double logarithmic presentation.
Line corresponds to the least square fitting of the experimental data with φ
c
=0.00047. The
slope of this line gives t=3.3; this values exceeds the theoretically predicted value t≈2.0. This
effect can be explained by non-statistical ordered distribution of conductive phase in the
polymer matrix since value t2 is provided by random (statistical) distribution of
conductive particles in non-conductive medium (Stauffer & Aharony, 1992). As it is seen in
Fig. 8, dependence of electrical conductivity on the content of nanotubes in PVC/MWCNT
composites demonstrates very low value of the percolation threshold φ
c
=0.00047 (≈0.05 vol.
%). The high anisotropy of the MWCNT with aspect ratio l/b ≈ 1000 is one of the reasons of
such effect. Higher aspect ratio of the filler particles leads to lower value of the percolation
threshold (He & Ekere, 2004).
Fig. 8. Electrical conductivity
versus volume content φ of nanotubes. The insertion
presents the scaling relation log
log (
-
c
) to fit the values of φ
c
, t and
0
.
The log
log(
-
c
) function, used for calculation of t value enables to define the value of
the packing-factor F or a limit of the composite filling for the given type of the filler.
Extrapolation of this function to
f
equal to 10.0 S/cm (i.e. to the conductivity of MWCNT)
gives us the value of
= F (insertion in Fig. 8). The value of
f
=10.0 S/cm was obtained
Carbon Nanotubes – Polymer Nanocomposites
182
using a method of the fillers conductivity measurement described in ref. (Mamunya et al,
2004). The F parameter is a limit of the system filling and it is equal to the highest possible
volume fraction of the filler:
f
fp
V
F
VV
(6)
where
V
f
is the volume occupied by the filler particles at the highest possible filler fraction,
V
p
is the volume occupied by the polymer (space among filler particles). The value of F
depends on the shape of particles and their type of spatial distribution. For statistically
packed monodispersed spherical particles of any size, the F value is equal to 0.64. In case of
deviation of the shape of particles from the spherical one or presence of nonstatistical
ordered (shell or skeleton) structure, the
F value decreases with V
p
increasing. The use of
polydispersed filler particles results in increase of
F (Kusy, 1977). Thus, F value characterizes
the filler phase topology taking into account the shape, fractional size and spatial
distribution of particles. The volume fraction
F value, defined in such a way, is equal to 0.20
(insertion in Fig. 8). It means that the volume fraction of the MWCNT filler in a polymer can
not exceed 0.20, and at
=0.20 the composite has conductivity equal to the conductivity of
the filler:
f
=
CNT
.
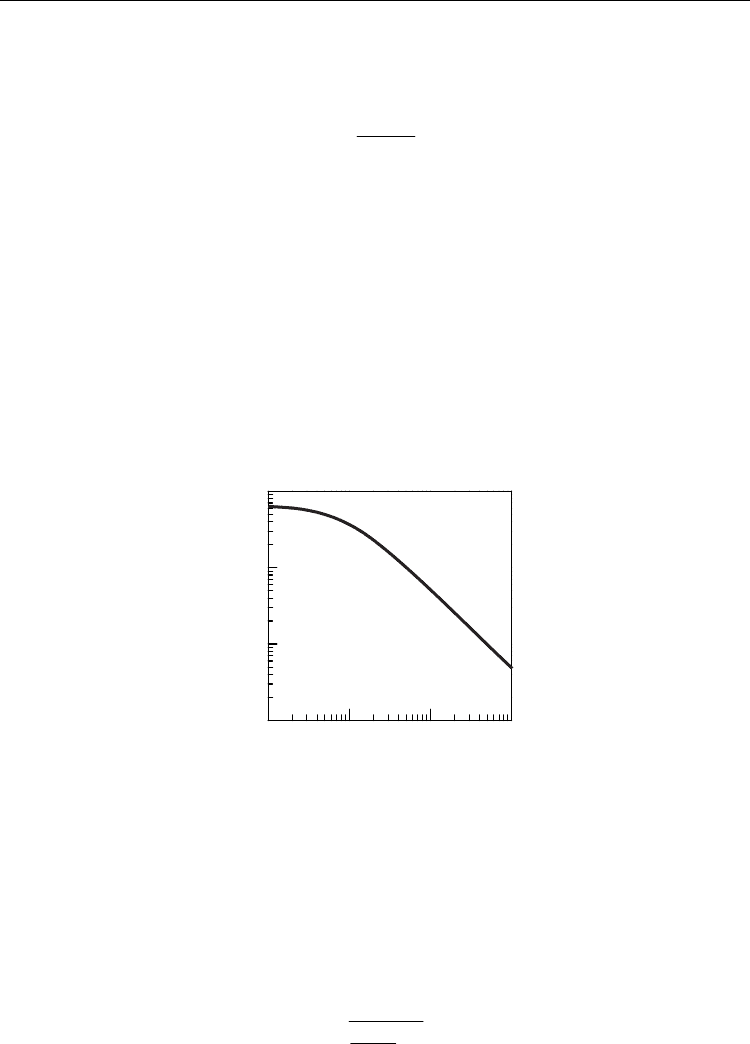
Fig. 9. The values of packing-factor versus a filler aspect ratio for its random distribution
(after Bigg, 1995). Here
m
=F, L/D=l/b.
The value of
F for nanotubes is essentially lower than 0.64 because of anisotropic shape of
the MWCNT particles, as far as their high aspect ratio
l/b causes their loose packing. For
aligned MWCNT particles, the value of l/b≈1000. However, as MWCNT are tangled, the
value of
l/b has to be lower. It can be estimated from the computer simulation of the
packing-factor F versus l/b, given in (Big, 1995) (Fig. 9). This plot can be described by
empirical equation which relates the values of F and l/b (Lisunova et al., 2007):
5
75
10
F
a
a
(7)
10
0
10
1
10
2
10
3
10
-3
10
-2
10
-1
10
0
m
L / D
Carbon Nanotubes as Conductive Filler
in Segregated Polymer Composites - Electrical Properties
183
where
a=l/b (in case of very high aspect ratio a (a>>1) this relation can be rewritten as
F≈5/a). Using the value of F=0.20, the eq. (7) gives a=22. Taking into account that the value
of
b for the MWCNT used is in the range of 10-20 nm, we can accept the average b value
equal to 15 nm, which gives
l = 330 nm. This value may be defined as an effective nanotube
size
l = l
e
and may be associated with the average distance between linkages of crossing
nanotubes; i.e.
l
e
means the length of a nanotube between adjacent contact linkages with
other nanotubes. Fig 4 demonstrates that this value is quite realistic.
Described above models (see section 2) predict decrease of the percolation threshold
φ
cs
in a
segregated system compared with the value of
c
for random distribution of conductive
filler in the polymer matrix. The value of
φ
cs
depends on the D/d ratio under condition of
D>>d, where D is size of the polymer grains (D=100 m for the PVC used) and d is size of
the filler particles. It can be determined that the value of
d is equivalent to the effective size
of a nanotube,
i.e. d = l
e
. In a segregated polymer/MWCNT system, the value of the
percolation threshold can be calculated as (Lisunova et al., 2007):
3
cs
n
lD
bd
(8)
where
n is the number of layers of the filler on the boundary between polymer grains, and it
is rather small: n
1. Taking into account that l = l
e
and d = l
e
. (l
e
= 330 nm), the value of φ
cs
can be estimated by eq. (8). Such a calculation gives φ
cs
4.510
-4
. The experimentally
measured value of
c
in the PVC/MWCNT composites is 4.710
-4
, which is in excellent
agreement with the theoretically estimated value of
φ
cs
. It follows from the said data that the
observed ultra-low value of the percolation threshold
c
in the PVC/MWCNT composites
can be explained by both very high aspect ratio of the nanotubes and segregation of
MWCNT inside the PVC matrix.
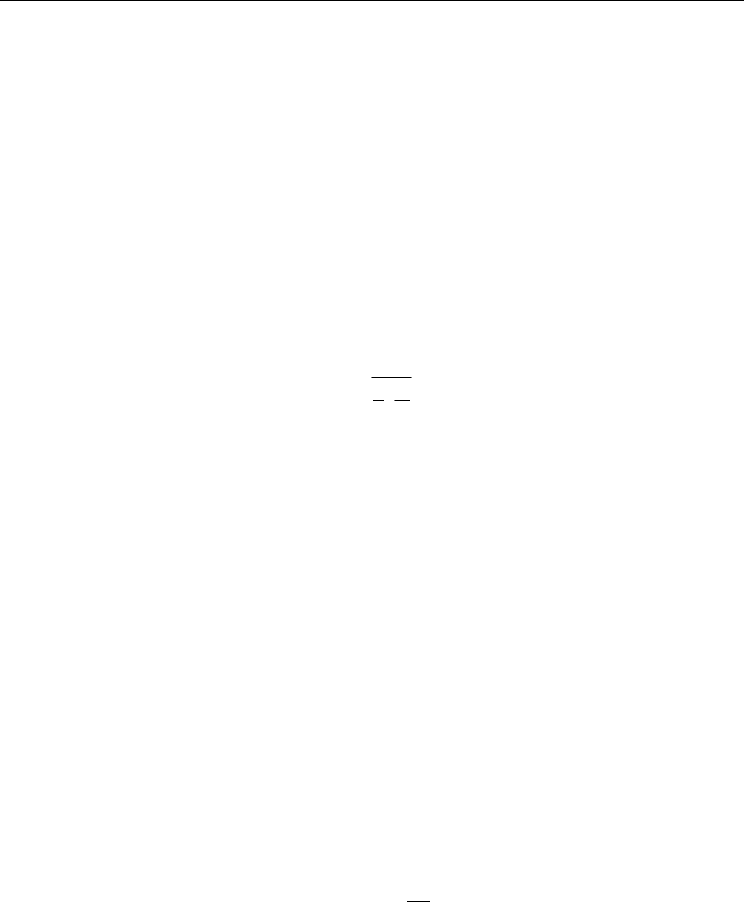
Temperature dependencies of conductivity of the PVC/MCWNT composites are shown in
Fig. 10. The increase of filler content changes the form of the curves. In pure PVC and
composite with 0.04 % MCWNT the conductivity increases with rise of temperature (curves
1, 2). Therefore it is possible to assume ionic character of conductivity in these systems as a
growing of conductivity with temperature is the feature of ionic conductivity and is caused
by rise of the ionic mobility (Margolis, 1989; Blythe & Bloor, 2005;). The temperature
dependence is found to be composed of two linear regions with a bend at temperature of
glass transition T
g
. The transition from glassy state to high-elastic state leads to stronger
dependence of conductivity on temperature that can be related to lightened ionic mobility in
the polymer state with heightened molecular mobility. These dependencies are represented
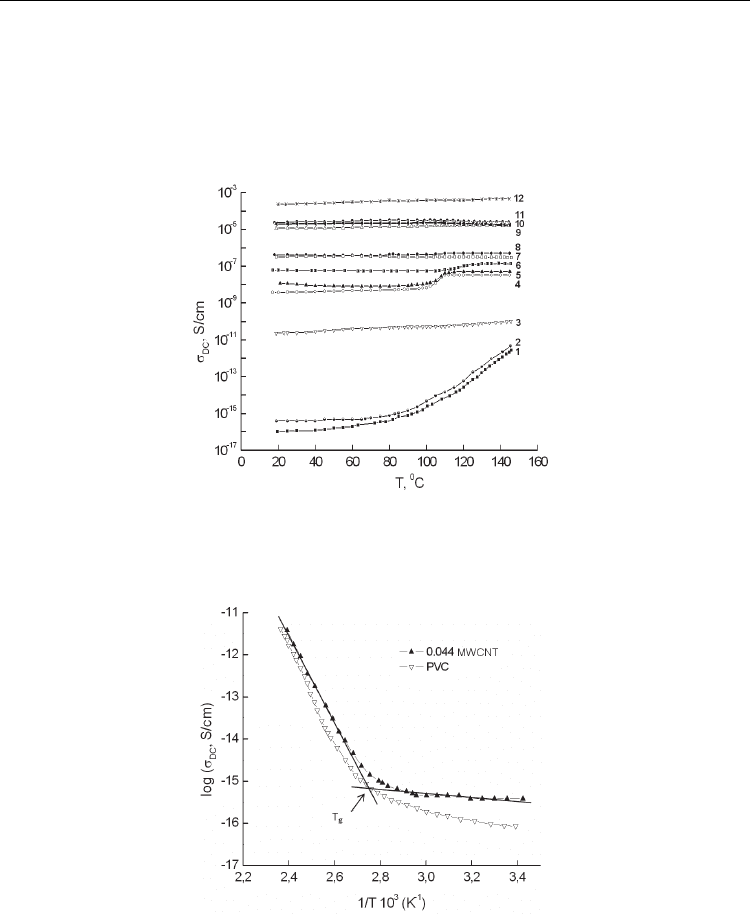
by Arrhenius plot in Fig. 11:
0
exp
E
kT
(9)
where Е is an activation energy, k is a Boltzmann constant. Calculation of the activation
energy values for the both parts of curve gives the E values in the temperature regions
higher and lower of T
g
respectively: 23.0 and 2.1 kcal/mole for the pure PVC and 19.0 and
0.9 kcal/mole for the PVC/MWCNT composite with 0.04 % MWCNT.
Crossing glass transition temperature the value of activation energy sharply increases as a
result of rise of the charge carrier mobility at temperature higher of T
g
. Such values of the
Carbon Nanotubes – Polymer Nanocomposites
184
activation energy are typical for ionic conductivity, for example the close values of
E (22.0
and 3.6 kcal/mole) were found in the PVA/H
3
PO
4
system (Margolis, 1989). Influence of
temperature (temperature higher or lower of T
g
) on the value of activation energy enables to
include the segmental mobility in the charge transport process. This approach takes into
consideration the change of viscosity of the polymer matrix under temperature action that,
in turn, influences on the charge carriers mobility (Seanor, 1982).
Fig. 10. Temperature dependencies of conductivity for composites with different content of
filler. Content of MWCNT in the composites (vol. %): 1 – 0, 2 – 0.044, 3 – 0.054, 4 – 0.08, 5 –
0.107, 6 – 0.134, 7 – 0.201, 8 – 0.268, 9 – 0.336, 10 – 0.470, 11 – 0.672, 12 – MWCNT.
Fig. 11. Arrhenius plots for the conductivity of the pure PVC and composite with 0.044 % of
MWCNT.
Even insignificant excess of the filler concentration over percolation threshold leads to the
change of the conductivity character, thus at MWCNT content equal to 0.054 % the
conductivity
increases essentially and becomes almost independent on temperature (Fig. 10,
curve 3). It indicates a conversion from ionic conductivity through the matrix to electronic
Carbon Nanotubes as Conductive Filler
in Segregated Polymer Composites - Electrical Properties
185
type of conductivity through the filler phase. Further growth of filler content causes the
increase of the conductivity value and it becomes independent on temperature in the region of
20-150 °C (curves 4-11). Only the composites with MWCNT content from 0.08 to 0.134 %
(curves 4-6) show weak shift of conductivity in the region 100-120
º
C that is essentially higher
of T
g
. Measurement of the nanotubes conductivity demonstrates independence of
on
temperature (curve 12), accordingly temperature dependence of conductivity of PVC/MWNT
composites has the same character since it is provided by conductivity of the filler phase.
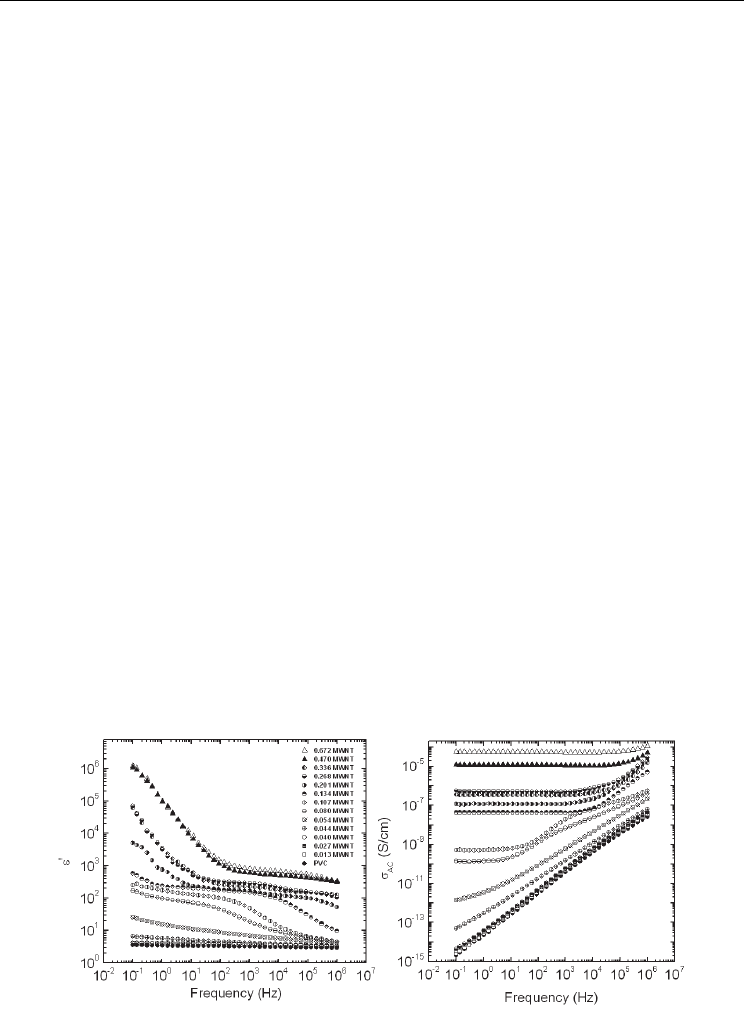
4.4 Dielectric properties of PVC/MWCNT and UHMWPE/MWCNT systems
Fig. 12 represents dielectric constant
and AC conductivity σ
AC
versus frequency. The value
of
in the PVC/MWCNT composites with the MCWNT content 0–0.04 vol. % (i.e. lower
than percolation threshold) are close and independent on frequency. This value of
increases and reveals a negative slope if the filler content exceeds the percolation threshold.
The frequency dependence of dielectric parameters in two-phase conductive-insulating
system can be considered with two models, such as intercluster polarization (IP) that
implies polarization effects between clusters inside percolation system or anomalous
diffusion (AD) within cluster (Song et al., 1986; Yoon & Lee, 1990; Youm & Lee, 1991). The IP
model predicts the power-law dependence of
and σ
AC
on the frequency that may be
written as follows:
y
(10)
x
(11)
1xy
(12)
where
y = s/(t + s) and x = t/(t + s). The critical exponents, x and y, have to satisfy the
condition (12). In the case of three-dimensional lattice the critical exponents
t and s are: t 2,
s 0.8 (Stauffer & Aharony, 1992) that gives the values of x and y equal to 0.72 and 0.28
respectively.
Fig. 12. Frequency dependencies of dielectric constant
, and AC conductivity
AC
for the
composites with different MWNT content.

Carbon Nanotubes – Polymer Nanocomposites
186
In the AD model the values of
x and y are equal to 0.58 and 0.42 respectively for three
dimensions. For the conductive PVC/MWCNT composites with MWCNT content in the
range of 0.08–0.134 % the average value of
y (calculated for the 10
-1
–10
2
Hz frequency range)
is found to be 0.18, which is lower than the theoretically predicted value.
Plot of conductivity versus frequency in a double logarithmic scale (Fig. 12) shows two cases
of the frequency dependence of AC conductivity
AC
: (a) below percolation threshold the
values of
AC
of the composites are overlapping and the curves have average slope close to
1, which indicates the highly insulating material (McLachlan et al., 2005); (b) above
c
the
conductivity is constant at low frequency due to contribution of DC conductivity. The
average slope of curves at higher frequencies is 0.91 that exceeds the theoretically predicted
value of critical exponent
x=0.72. One can consider satisfactory fulfilling the general scaling
relation (10), the measured values are
x+y=1.09. Thus the experimental results are closer to
the IP model than to the AD model. Note that in (Song et al., 1986; Yoon & Lee, 1990; Youm
& Lee, 1991) the critical exponents
x and y do not agree separately with the theoretical
predictions but general scaling law (10) is satisfactorily fulfilled. For PE/MWCNT
composites the authors (Liang & Tjong, 2006) have found an agreement of the experimental
values of critical exponents with the theoretical prediction by power low relations (10)-(12).
For higher concentration of the filler in the composites (in the range of 0.201–0.672%) the
values of
grow drastically. The reason of such an effect can be an electrode polarization
that leads to a separation of charges which gives an additional contribution to the
polarization. It occurs for moderately to highly conductive systems and results in extremely
high values of the real and imaginary part of the complex dielectric permittivity (Kremer &
Schonhals, 2003). In fact Fig. 12 demonstrates the presence of very high
values equal to
10
5
-10
6
in the range of low frequencies 10
-1
-10
0
Hz for the samples with filler concentration
above 0.201%.
The comparison of conductivity and dielectric parameters (
and tan
) versus MWCNT
content in PVC/MWCNT and UHMWPE/MWCNT segregated systems is presented in Fig.
13. Dependence of electrical conductivity on the nanotubes content in the PVC/MWCNT
and UHMWPE/MWCNT composites demonstrates very low values of the percolation
threshold, equal to 0.00047 (≈0.05 vol. %) and 0.00036 (≈0.04 vol. %), respectively. It is a
result both, of high anisotropy of MWCNT with aspect ratio length/diameter
1000 and of
segregated distribution of CNT in the polymer matrix. It is interesting that the
c
value is
lower for UHMWPE/MWCNT composite although the geometrical parameters for both of
composites are identical.
Dielectric characteristics, measured at fixed frequency 1 kHz, demonstrate the percolation
behaviour as well (Fig. 13). In the region above percolation threshold
c
the sharp increase of
and tan
takes place, after that the values of dielectric parameters rich the plateau. Such
behavior is predicted by model for two-phase insulating/conducting systems and was
observed in polymer/dispersed metal composites (Mamunya et al., 2002c). Rise of
in the
region above percolation threshold was observed for the LDPE/MWCNT composites in
(Liang & Tjong, 2006). It is necessary to note that some differences for PVC/MWCNT and
UHMWPE/MWCNT composites exist. The value of
on the plateau is an order of
magnitude higher for UHMWPE/MWCNT than for PVC/MWCNT. Probably it is caused
by heightened conductivity of UHMWPE/MWCNT composite which is ten times higher
than in PVC/MWCNT composite for samples with maximal content of MWCNT. The
reason of such features is not clear since the geometry of conductive phase (the values of
D
and ratio
D/d) is the same for both of composites.