Water and Wastewater Engineering
Подождите немного. Документ загружается.


WELLS 4-33
Screen Diameter
The selection of a screen diameter equal to the casing diameter is recommended because a screen
diameter equal to the casing diameter minimizes the headloss through a restricted tube, facilitates
development and when necessary, redevelopment of the well. The selection of a screen
diameter
equal to the casing diameter also facilitates repairs and increasing well depth at a later time if the
well depth becomes necessary (RMC, 2007).
Because the cost of the screen is quite high, some designers will reduce the diameter of the
screen if the reduction does not adversely affect the entrance veloc
ity. In wells deeper than 350
m, a reduction in screen diameter of 10 cm for a nominal screen diameter (based on the casing
diameter) of 30 cm may be practical (RMC, 2007).
The length of the screen, slot opening, and diameter are used to estimate the entrance veloc-
ity. This is compared to the recommend
ed values in Table 4-5 .
Screen Entrance Velocity
The entrance veloc ity of the water is selected to avoid excessive well losses and incrustation
rates, both of which increase with increasing entrance velocity. The “optimum” values given by
Walton ( Table 4-5 ) are higher than those suggested by others. Johnson (1975) and Hunter Blair
(1970) recommend that the velocity not exceed
0.03 m/s.
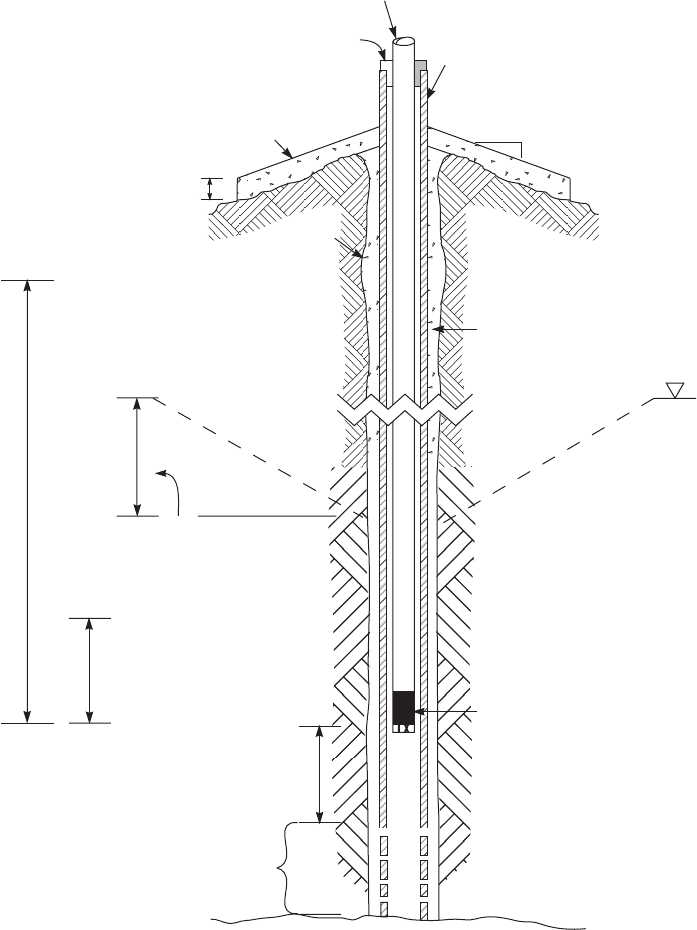
Pump Power
The selection of an appropriate pump and the calculation of the power requirement follows the
process discussed in Chapter 3. The placement of the pump is determined by the regulatory
restrictions in reference to the top of the well screen and the requirements for Net Positive Suction
Head (NPSH) as shown in Figure 4-13 .
The following example illus
trates the complete well design for a very small system.
Example 4-7. Because individual shallow wells in the community have become contaminated,
the village of Knotwell has decided to provide a well system for the community. A two-well
system with elevated storage has been proposed. Syste
m water pressure will be maintained by the
elevated storage tank. The design data are as follows:
D e sign flow rate 190 m
3
/ d for the average day
Top of reservoir 50 m above ground level
Friction losses minor losses in piping from well to top of reservoir 0.15 m
Altitude 500 m above mean sea level
Static water level before pumping 5.2 m below grade
Extract from Well Log
Strata Thickness, m Depth, m
S a n d 7.6 7.6
G l a cial till 19.8 27.4
Gravel 9.1 36.5
Dolomite 53.3 89.8
Shale 61.0 150.8
S a n d 38.7 189.5
Shale well terminated
4-34 WATER AND WASTEWATER ENGINEERING
Pump
discharge
pipe
Casing
Vented sanitary
well seal
Concrete
pad
Bore hole
0.1 m
Grout
seal
100 d drawdown
Submersible pump
1.5 m
NPSH
A
NPSH
R
Screen
FIGURE 4-13
P l a cement of pump with respect to drawdown, height above screen, and NPSH
R
.
Note: With the NPSH
R
and NPSH
A
shown, the pump could be set at a higher elevation.

WELLS 4-35
An analysis of the water indicates that it is corrosive
Sieve analysis of water-bearing sand
U.S. sieve no. Cumulative % passing
100 1.0
70 4.0
50 10.0
40 22.0
30 40.0
20 60.0
1 6 7 5.0
12 88.0
8 96.0
6 100.0
Water temperature 5 C
Pumping test results
Drawdown at observation well 300.0 m from test well pumped at 0.035 m
3
/ s
T i me, min Drawdown, m
100 3.10
500 4.70
1,700 5.90
Solution:
a . Number of wells
Two wells will be provided. One will be a duplicate well and pump. Both will be of the
same design. These will be provided to meet the regulatory requirement to have one
spare available for the maximum day demand.
b. Pump size
From the estimated average day demand, select p
umping rate based on rules of thumb for
a small system. In this instance, a six-hour pumping time is selected for each daily cycle.
Q
190
6
1 3166 32
3
3
m /d
h
day or m /h().
Therefore, one well can supply the maximum day (estimated maximum day
demand (2)(190 m
3
/ d) 380 m
3
/ d) in 12 hours.
c. Well diameter
From Table 4-4 , based on the demand, select a trial diameter of 15 cm. Note this will
have to be adjusted if the actual pump selected will not fit with the recommended clear-
ances.
d. Check for potential well failure due to dewatering aquifer
From the well log and the stati
c water level in the well, the sand layer is determined to be
an artesian aquifer. Therefore, the transient flow equations for a confined aquifer may be
4-36 WATER AND WASTEWATER ENGINEERING
used to estimate the drawd own. Estimates of the transmissivity and storage coefficient
are required to use the transient flow equations.
(1) Transmissivity
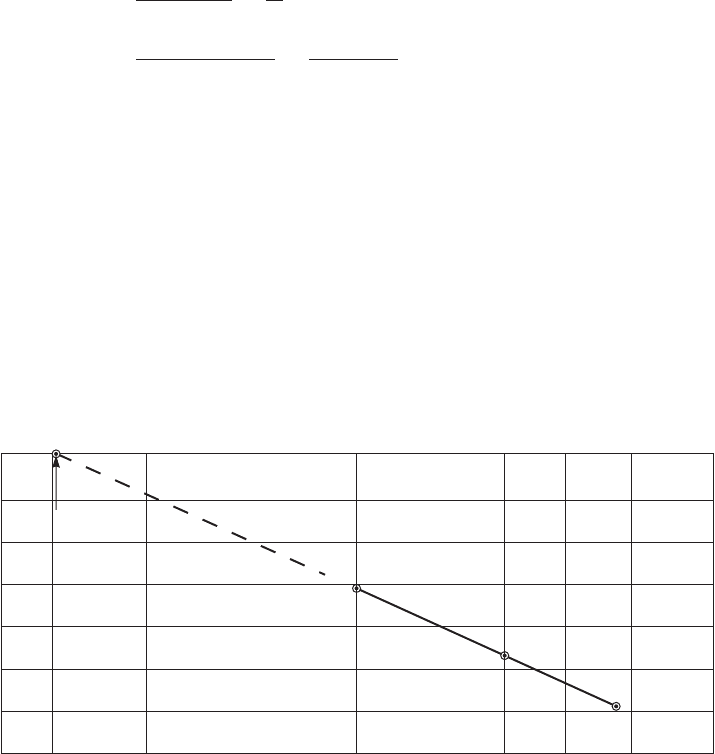
Transmissivity can be obtained from the pumping test data. The pumping test data given
in the example problem statement are plotted on s
emilog paper as shown in Figure 4-14 .
From the straight line portion of the curve, select two points and calculate the transmis-
sivity using Equation 4-5:
T
Q
ss
t
t
T
4
0035
4 5 90
21
2
1
3
p
p
()
(
ln
m/s
⎛
⎝
⎜
⎞
⎠
⎟
.
.
310
1 700
100
2 818 10
32
.
,
.
)
ln
min
min
m
⎛
⎝
⎞
⎠
//s
Note that Q i s not the design pumping rate of 32 m
3
/h. It is the pumping rate used in the
pumping test.
(2) Storage coefficient
U sing the Michigan Department of Environmental Quality rules, the drawdown must be
estimated based on 100 days of pumping. Bec ause only one pump is required to meet
the maximum day demand, only the drawdown for one operating pump is
required. The
storage coefficient ( S ) is estimated as follows:
In Figure 4-14 , extrapolate the straight line portion of the graph to the virtual starting
elevation of 0.0 m to find the virtual time: t
0
4.2 min.
U se Equation 4-6 to estimate S.
0.0
1.0
t
o
= 4.2 min
2.0
3.0
4.0
5.0
6.0
7.0
4.0 10.0
Time, min
100.0 500 1,000 2,000 5,000
Drawdown, m
FIGURE 4-14
P umping test curve for Example 4-7.

WELLS 4-37
S
()(. )( )( )225 2 818 4 2 60
3
..×
−
10 m/smin s/min
(()300
1775 10
2
5
m
= .
where r 300 m, the distance from the pumping well to the observation well.
(3) Estimate drawdown
Calculate the drawdown with Equation 4-1.
With T 2.818 10
3
m
2
/ s, S 1.775 10
5
, and a well diameter of 15 cm selected
in step (c) above ( r 15 cm/2 7.5 cm or 0.075 m), calculate u as
u
()( )
()(
0075 1775 10
4 2 818 10
2 5
3 2
..
.
m
m /s
1100 86 400
1025 10
12
d s/d)( ),
.
and
Wu()
0 577216 1 025 10 1 025 10
12 12
.. .ln
.
.
10
22
1025 10
33
27 0
12 2 12 3
)( )
??!!
33
32
1
3 600
4 2 818 1
3
s
()
()( )(
m/h
s/h,
.
⎛
⎝
⎜
⎞
⎠
⎟
p
00
27 03 6 785 68
32
m/s
or m
)
().. .
(1.025
The 6.8 m is measured from the static piezometric surface that is 5.2 m below grade. The
drawdown piezometric surface will be a total of 5.2 6.8 12.0 m below the ground
surface. The top of the artesian aquifer is 150.8 m below grade. Thus, there is no poten-
tial for failure of the well due to dewatering the aquifer.
e. Well depth, casing length, an
d grout requirements
(1) From the well log, select the water-bearing aquifer
The well penetrates an impervious layer of shale, extends through a sand layer, and
terminates in shale. From the well log and the static water level in the well, the sand
layer is determined to be an artesian aquifer.
(2) A fully penetrating well is s
elected. Therefore, the well depth is 189.5 m.
(3) The casing length and grout requirements are based on MSDWA rules, that is:
For artesian aquifers, the casing is sealed to the upper confining layer from within
1.5 m of the top of the aquifer to the ground surface.
f. Slot size
Plot the grain size analysis as
“Cumulative % Retained” versus “Grain Size, mm.” The
points in Figure 4-12 were plotted using the data provided for this example. Note that the
data are presented as “Cumulative % passing” and that they are plotted as “Cumulative

4-38 WATER AND WASTEWATER ENGINEERING
% Retained” by subtracting each value from 100 percent. From the graph, select the
grain sizes to calculate the uniformity coefficient:
U
D
D
%
%
40
90
084
0 297
283
.
.
.
For a corrosive water (from the water analysis given in the problem statement) with a
uniformity coefficient less than 3, the recommended slot size is D
50%
. From the graph,
select the 50 percent point on the graph. An acceptable slot number is 20. Note that it is
acceptable to have more percent retained than 50 percent but not less.
g. Screen diameter
Select a screen diameter equal to the casing diameter.
h. Screen length
S creen length is a function of aquifer homogeneity and aquifer depth. Based on
Johnson’s
rules of thumb, the aquifer should be screened for 80 percent of its depth. This is a screen
length of
S
L
()( )08 387 3096 31.. .m or m
This estimate must be checked using Equation 4-11.
i. Hydraulic conductivity
An estimate of the hydraulic conductivity is required to use Equation 4-11. Hydraulic
conductivity ( K ) and the transmissivity ( T
) are related (from Equation 2-6, T KD ).
Transmissivity was estimated in step c (1) above.
The hydraulic conductivity is
K
T
D
2 818 10
387
728 10
3 2
5
.
.
.
m /s
m
m/s orr m/d629.
The value of D i s the thickness of the sand layer (that is, the artesian aquifer) given in
the well boring log.
j. Check of screen length and entrance velocity
U sing Table 4-6 , a slot number of 20 and a well diameter of 15 cm has an effective
open area of 0.097 m
2
/ m of screen length. From Table 4-5 , for a hydraulic conductiv-
ity of 6.29 m/d, the screen velocity should be 0.010 m/s. The recommended screen
length is
S
L
()
()(
32
1
3 600
0 097 0 010
3
m /h
s/h
m/s
,
..
⎛
⎝
⎜
⎞
⎠
⎟
))
916. m
The selected screen length of 31 m exceeds this recommended length.
Check the entrance velocity:

WELLS 4-39
The open area of the screen is
A ()()0 097 31 3 0
22
..m /mm m
The velocity is
v
()32
1
3 600
3 0
0003
3
2
m /h
s/h
m
m/s
,
.
.
⎛
⎝
⎜
⎞
⎠
⎟
Thus, the entrance velocity criteria are met with the longer screen. The decision on
whether or not to shorten the screen (or reduce its diameter) is based on economic con-
siderations: well efficiency, the cost of the screen, and design life.
k. Pump selec
tion
The required head and discharge are used to select an appropriate pump from manufac-
turer’s data. The total dynamic head (TDH) is calculated as
TDH static lift to ground level static liftto the top of the reservoir
hhminor l
fv
oosses
The drawdown was estimated as 6.8 m in step d (3). The 6.8 m is measured from the
static piezometric surface that is 5.2 m below grade. The drawdown piezometric surface
will be a total of 5.2 6.8 12.0 m below the ground surface.
The total dynamic hea
d required for the pump is
TDH mmto the top of the reservoir 12 0 50. hhh
fv
minor losses
From the problem statement h
f
h
v
minor losses 0.15 m. Therefore,
TDH mm m m12 0 50015 62 15...
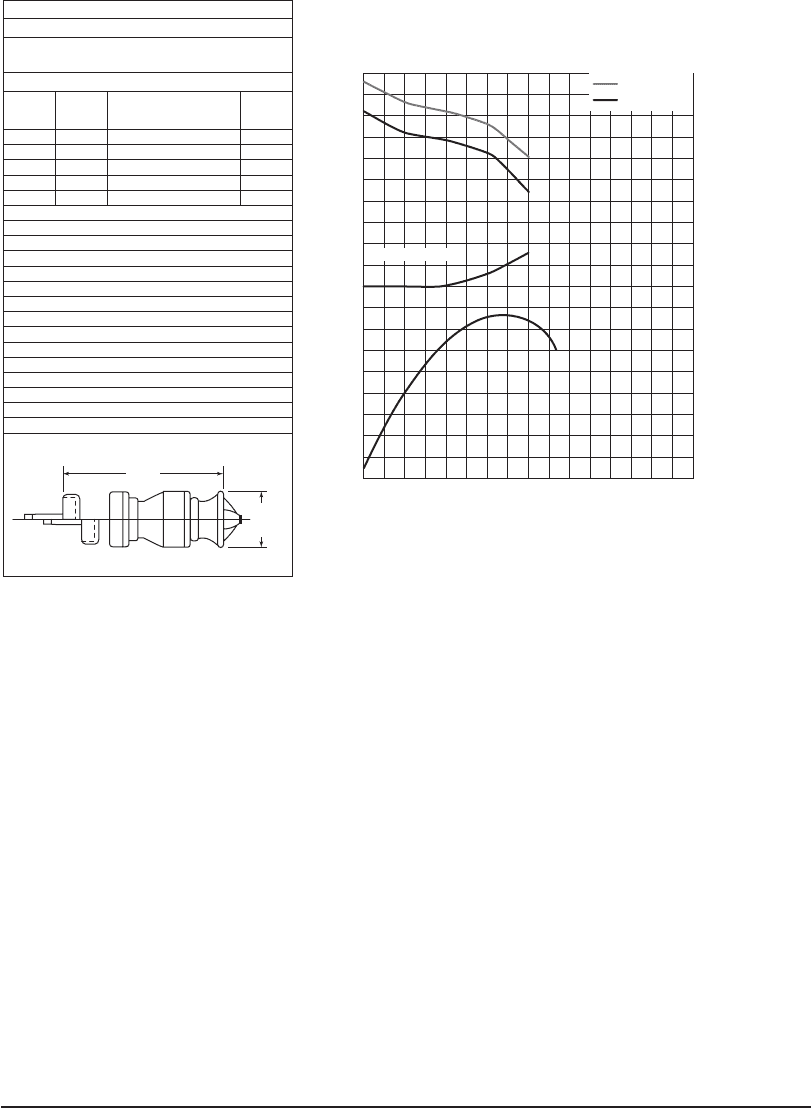
From manufacturer’s catalogs, find a pump characteristic curve with maximum effi-
ciency at 32 m
3
/h and 62.15 m TDH. For this example, the pump in Figure 4-15 on
page 40 was selected. At a discharge of 32 m
3
/h, a head per stage of 3.2 m is shown. The
number of stages to achieve the TDH is
No stages
TDH
head/stage
m
m/stage
.
.
.
62 15
3 2
19 4 20.or stages
From the box at the left of the head-discharge curve, the maximum number of stages
is 35. Therefore this pump will work.
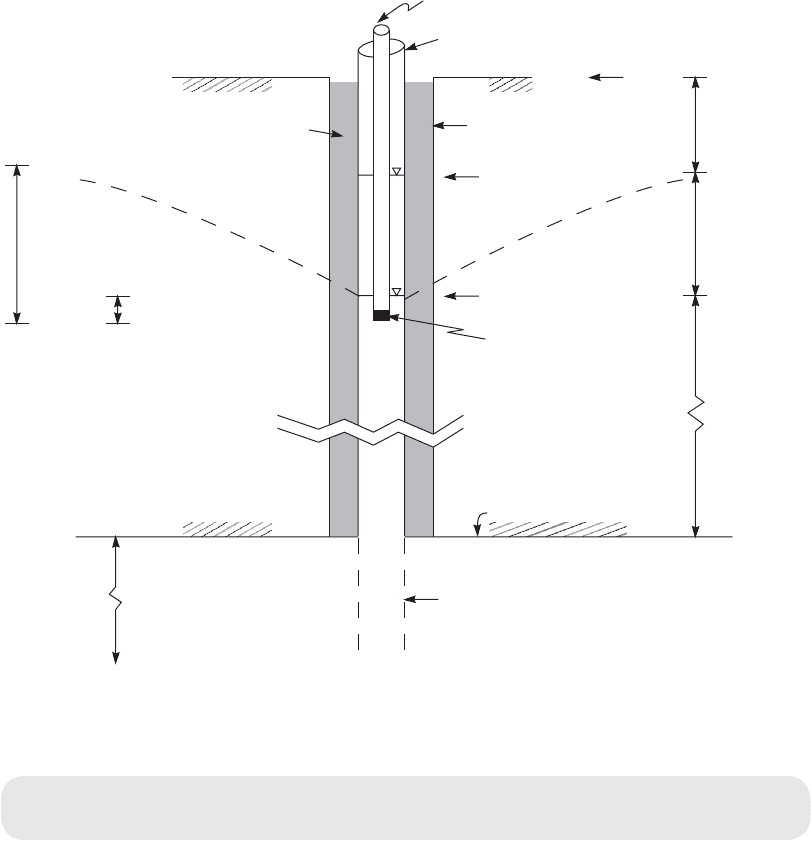
l. Elevation of pump intake
The pump intake elevation must meet both the requirements of the regulatory agency (in
thi
s instance MSDWA rules) and the NPSH.
The MSDWA requires that the pu mp be set a minimum of 1.5 m above the top of the
well screen. The required NPSH is that at run-out. For the pump in Figure 4-15 , it is
about 1.5 m. Using Tables 3-7 and 3-8 for the water temperature and altitude given
4-40 WATER AND WASTEWATER ENGINEERING
in the problem data (i.e., 5
C and altitude of 500 m), the NPSH
A
i s greater than 9.6 m.
If the pump intake is set 1.0 m below the maximum 100 day drawdown as shown in
Figure 4-16 , it will meet both requirements.
m. Check the dimension drawing for the diameter to see if the pump will fit in the casing. Its
diameter is 13 cm, and the casing inside diam
eter is 15 cm. While the pump will fit, the
recommended minimum clearance of 5 cm is not met. The next larger diameter casing
of 20 cm should be chosen and the calculations reworked for screen length, velocity, and
drawdown. Because the estimates with the smaller dia
meter casing met the guidelines
for screen length and velocity with a substantial margin of safety, in this instance they do
not need to be reevaluated. However, the drawdown calculation and TDH will need to be
adjusted to account for the larger diameter.
Comments:
1 . The number of stages for the pump is very high. A more reasonable n
umber would be on
the order of three to five stages. A more extensive search of available pumps should be
conducted.
2. For some well systems, a submersible pump may be more appropriate than a line pump.
These should also be investigated.
0
1
2
20
0
80
60
40
1.0
2.0
3.0
4.0
10.0 20.0 30.0 40.0
A
A
B
Discharge, m
3
/h
NPSH required
at pump inlet, m
Efficiency % Head per stage, m
Impeller B
Impeller A
NPSH required
Curve no. 4-15
Size 1 Rpm 1750
Single- stage lab head and horse-power with
enameled cast iron bowls and bronze impeller
Effieciency shown for 2 or more stages
No.
stages
Eff.
change
Eff.
change
Material
Eye area 32 cm
Thurst constang - A 2.3
Thurst constang - B 2.3
Thurst cons
tang - C 2.3
Max. no. std. stages 35
Max. operating pressure 3,900 kPa
Std. lateral .375
Std. shaft dia. 2.0 cm
Impeller number P-2397-10
Impeller wt. 3.6 kg
Bowl conn. - flanged
Add 10.6 cm per additional stage
Enclosed line shaft
Imp.-C.I.
Imp.-C.I. Enn
Bowl -C.I.
Bowl -Brz.
1
2
3
4
1
0
0
0
0
0
1
1
13 cm
33 cm
FIGURE 4-15
Vertical turbine head—discharge curve for Example 4-7.
WELLS 4-41
Discharge pipe
Casing vented to atmosphere
Grout
Bore hole
Grade
5.2 m
6.8 m
138.8 m
Static nonpumping
water level
100 d pumping
drawdown
Pump intake
Bottom of shale
Sand aquifer
Well screen
38.7 m
NPSH
A
9.6 m
NPSH
R
1.5 m
FIGURE 4-16
Sketch of elevations for setting pump.
Visit the text website at www.mhprofessional.com/wwe for supplementary materials
and a gallery of photos.
4-5 CHAPTER REVIEW
When you have completed studying this chapter, you should be able to do the following without
the aid of your textbooks or notes:
1 . Sketch a subsurface cross section from the results of a well boring log and identify
pertinent hydrogeologic features.
2. Define “isolation” as it applies to wells.
3. Sketch a well and label the major sanitary protection features according to this text.
4-42 WATER AND WASTEWATER ENGINEERING
4. Explain the purpose of a removable roof, auxilary heat, and ventilation in a well house.
5. Sketch a piezometric profile for a single well pumping at a high rate, and sketch a pro-
file for the same well pumping at a low rate.
6. Sketch a piezometric profile for two or more wells located close enough together to
interfere with one another.
7. Sketch a well-pumping test curve which shows ( a ) the interception of a barrier and ( b )
the interception of a rec
harge area.
W ith the use of this text, you should be able to do the following:
8 . Select the correct isolation distances for a well based on a description of the users.
9. Calculate the appropriate amount of disinfectant for a well given the diameter, depth of
water in the well, and the reagent to be used.
10. Calculate the drawdown at a pumped well or observation well if you are given the
proper input data.
11. Calcu
late the transmissivity and storage coefficient for an aquifer if you are provided
with the results of a pumping test.
12. Calculate the interference effects of two or more wells.
13. Determine the number of wells for a small community’s well field.
14. Select an appropriate type of pump and the required discharge capacity to
meet demand.
15. Select and check the appropriate diameter for a well casing.
16. Determine the required depth of a well.
17. Determine the appropriate length of well screen for a given aquifer formation.
18. Select the appropriate slot size given a grain size distribution.
19. Determine the appropriate screen diameter given the hydraulic conductivity of the aqui-
fer and the slot size.
20.
Select an appropriate pump and specify the number of stages based on a TDH calcula-
tion you have performed.
4-6 PROBLEMS
4-1. A 0.30 m diameter well fully penetrates a confined aquifer that is 28.0 m thick. The
aquifer material is fractured rock. If the drawdown in the pumped well is 6.21 m after
pumping for 48 hours at a rate of 0.0075 m
3
/ s, what will the drawdown be at the end
of 48 days of pumping at this rate?
4-2. An aquifer yields the following results from pumping a 0.61 m diameter well at
0.0303 m
3
/ s: s 0.98 m in 8 min; s 3.87 m in 24 h. Determine its transmissivity.
Report your answer to three significant figures.