Warnick C.C. Hydropower engineering
Подождите немного. Документ загружается.

Turbine Selection and Plant Capacity Determination
Chap.
6
I
Limits of Use of Turbine Types
89
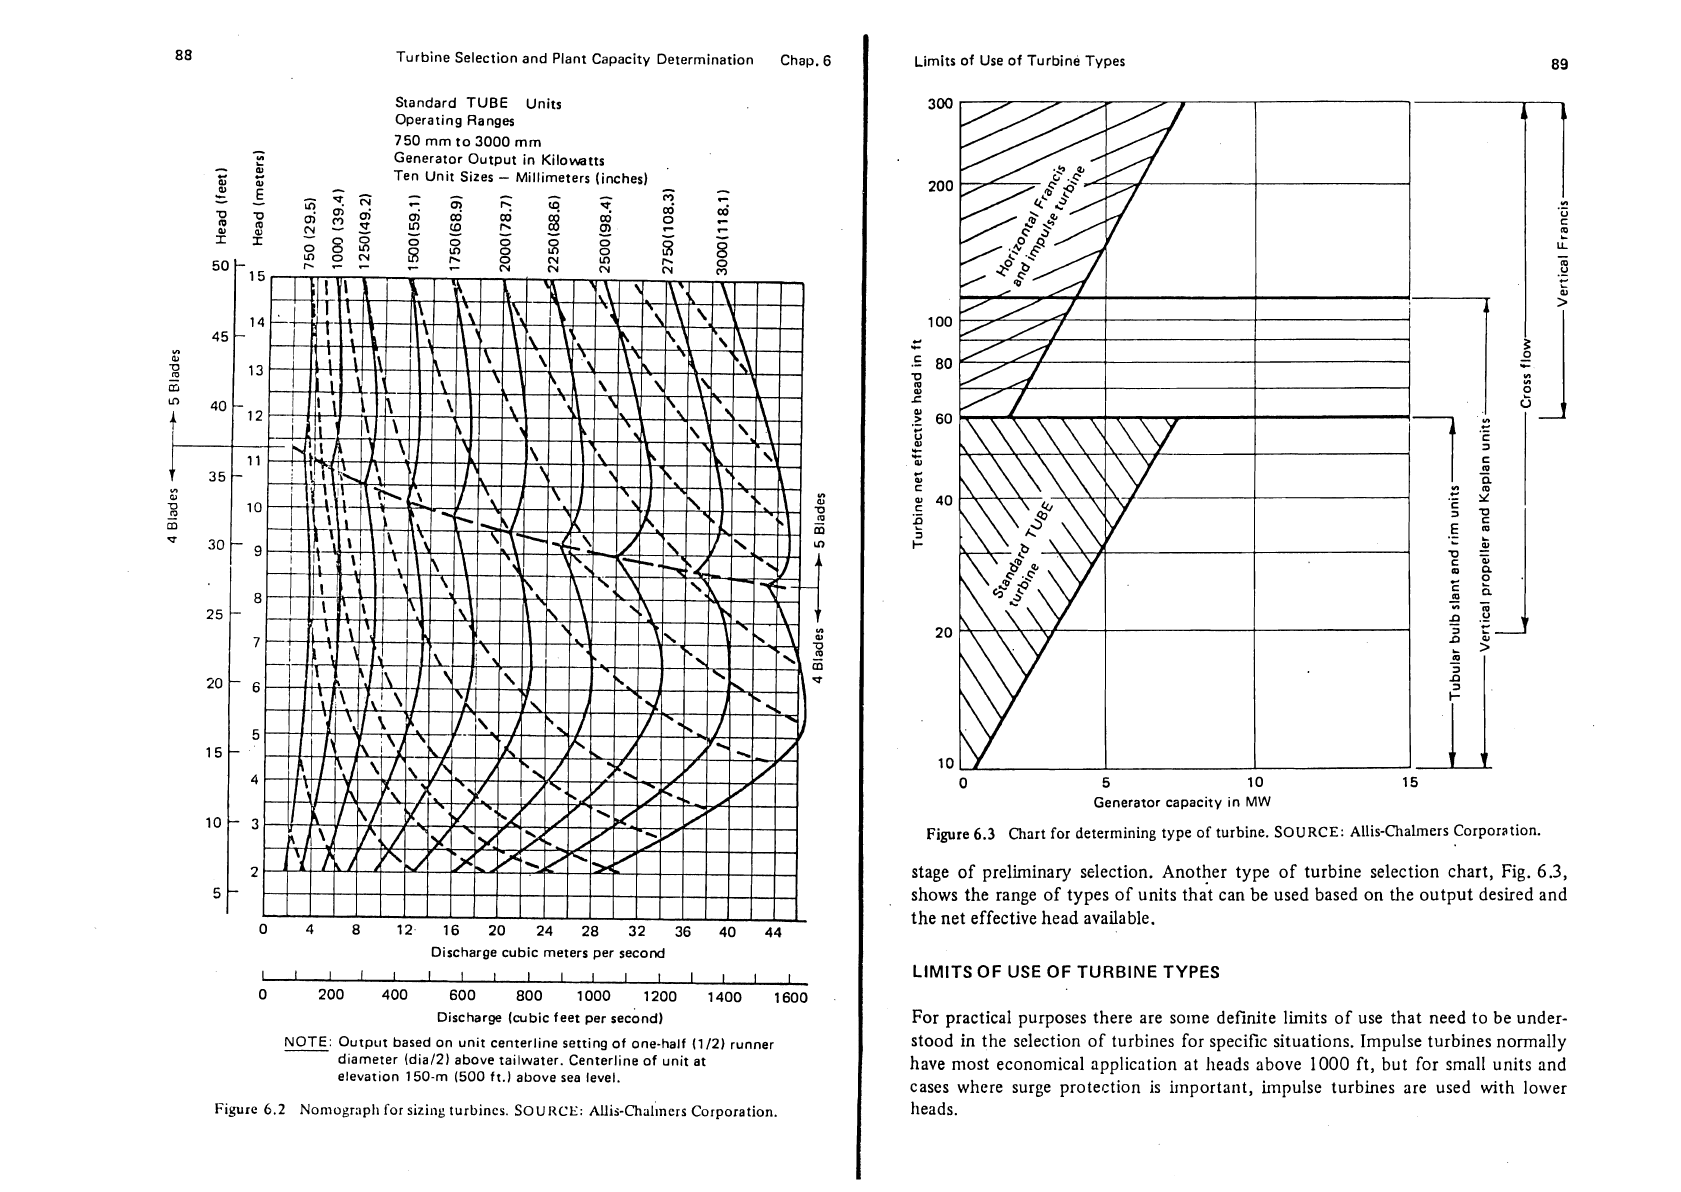
Standard TUBE Units
Operating
Rang=
750 mm to 3000 rnm
Generator Output in Kilowatts
Ten Unit Sizes
-
Millimeters (inches)
Discharge cubic meters per second
11111111111111111
0 200 400 600 800 1000 1200 1400 1600
Discharge
[cubic feet per second)
NOTE: Output based on unit centerline setting of one-half
(112) runner
diameter
(dial21 above tailwater. Centerline of unit at
elevation 150-m (500
ft.1 above sea level.
Figure
6.2
Non1ogr:lph for
sizing
turbines.
SOUIICE: Allis-Chal~ners Corporation.
0 5 10 15
Generator capacity in
MW
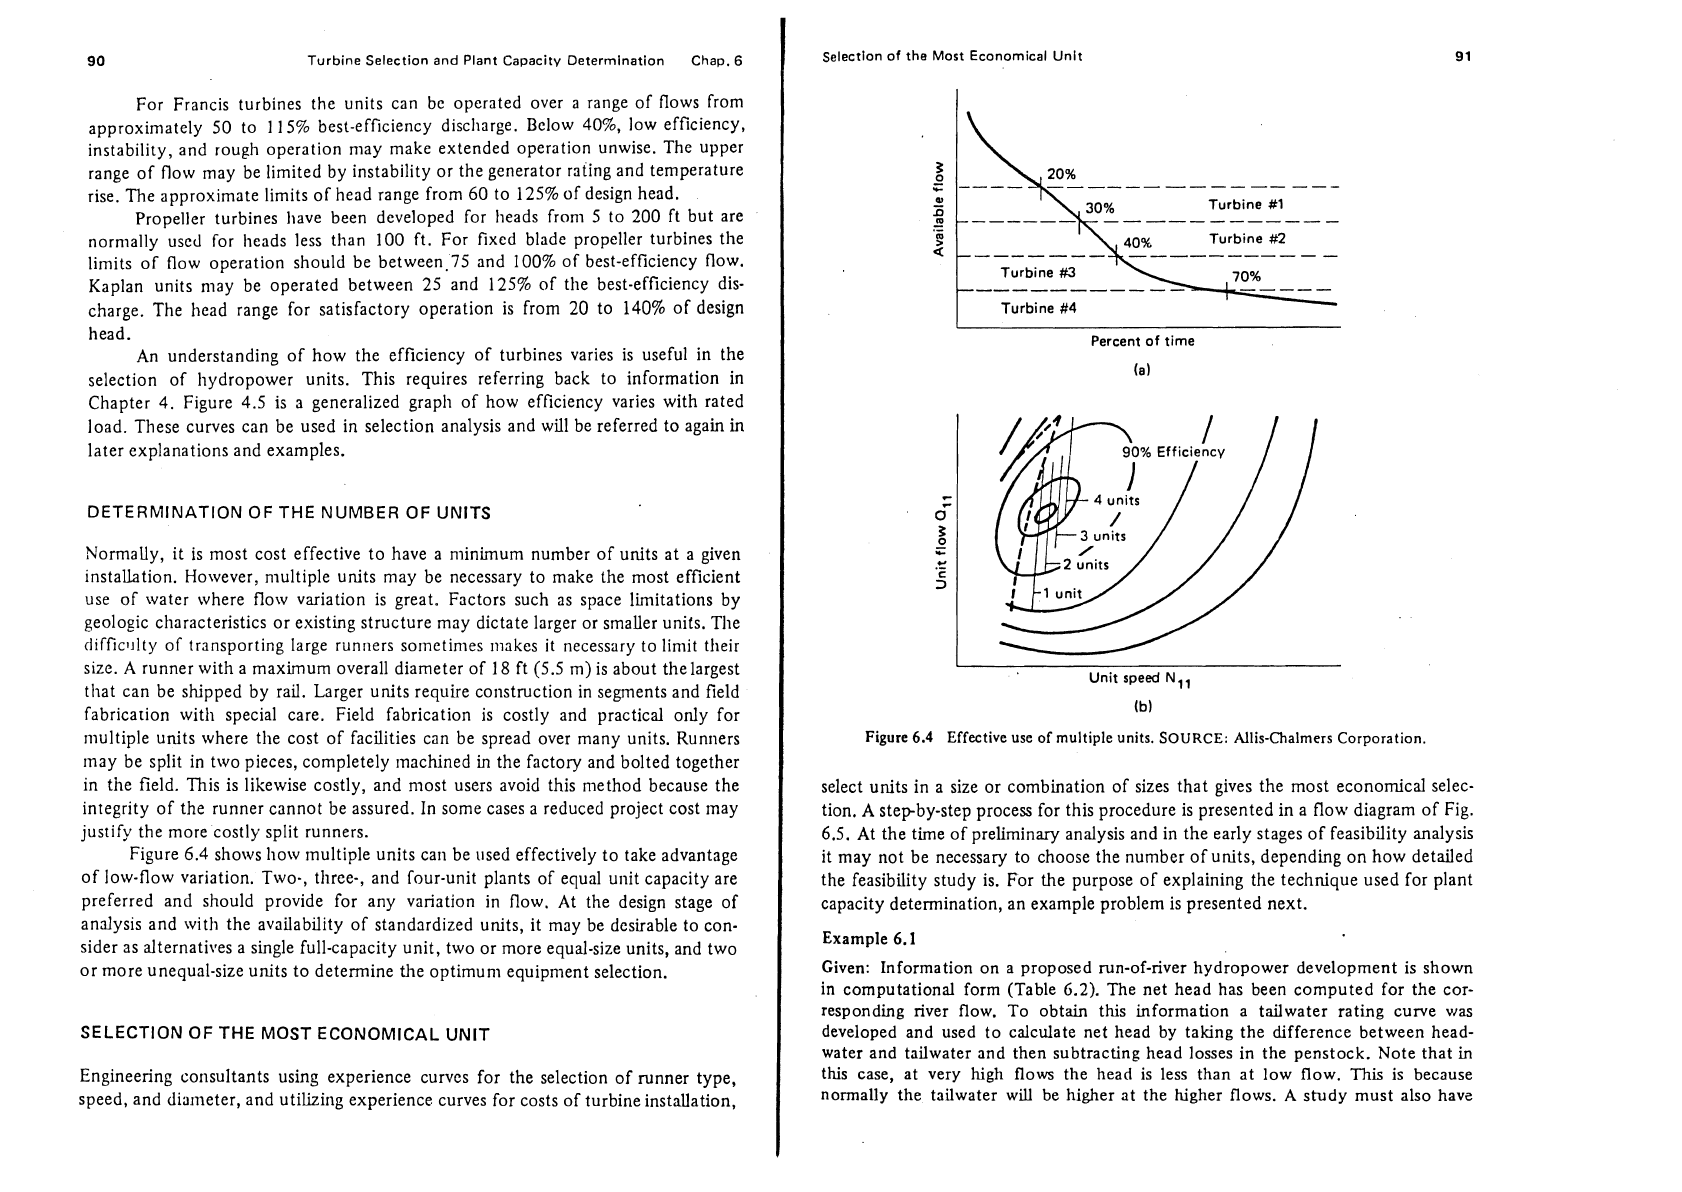
Figure
6.3
Chart for determining type of turbine. SOURCE: Allis-Chalmers Corporation.
stage of preliminary selection. Another type of turbine selection chart, Fig.
6.3,
shows the range of types of units that can be used based on the output desired and
the net effective head available.
LIMITS
OF
USE
OF
TURBINE TYPES
For practical purposes there are some definite limits of use that need to be under-
stood in the selection of turbines for specific situations. Impulse turbines normally
have
most economical application at heads above 1000 ft, but for small units and
cases where surge protection is important, impulse turbines are used with lower
heads.
90
Turbine Selection
and
Plant Capacity Determination
Chap.
6
For Francis turbines the units can be operated over a range of flows from
approximately
50 to
11
5% best-efficiency discharge. Below 40%, low efficiency,
instability, and rough operation may make extended operation unwise. The upper
range of flow may be limited by instability or the generator rating and temperature
rise. The approximate limits of head range from 60 to 125% of design head.
Propeller turbines
have been developed for heads from 5 to 200 ft but are
nornially used for heads less than 100 ft. For fixed blade propeller turbines the
limits of flow operation should be
between.75 and 100% of best-efficiency flow.
Kaplan units
niay be operated between 25 and 125% of the best-efficiency dis-
charge. The head range for satisfactory operation is from
20
to
140%
of design
head.
An understanding of how the efficiency of turbines varies is useful in the
selection of hydropower units. This requires referring back to information in
Chapter
4.
Figure 4.5 is a generalized graph of how efficiency varies with rated
load. These curves can be used in selection analysis and will be referred to again
in
later explanations and examples.
DETERMINATION OF THE NUMBER OF UNITS
Normally, it is most cost effective to have a minimum number of units at a given
installation. However,
nlultiple units may be necessary to make the most efficient
use of water where flow variation is great. Factors such as space limitations by
geologic characteristics or existing structure may dictate larger or smaller units.
The
difficl~lty of transporting large runners solnetinles ~nakes it necessary to limit their
size.
A
runner with a maximum overall diameter of
18
ft (5.5 m) is about thelargest
that can be shipped by rail. Larger units require construction in segments and field
fabrication with special care. Field fabrication is costly and practical only for
multiple units where
the cost of facilities can be spread over many units. Runners
may be split in two pieces, completely machined
in
the factory and bolted together
in the field. This is likewise costly, and most users avoid this
method because the
integrity of the runner cannot be assured. In some cases a reduced project cost may
justify the more costly split runners.
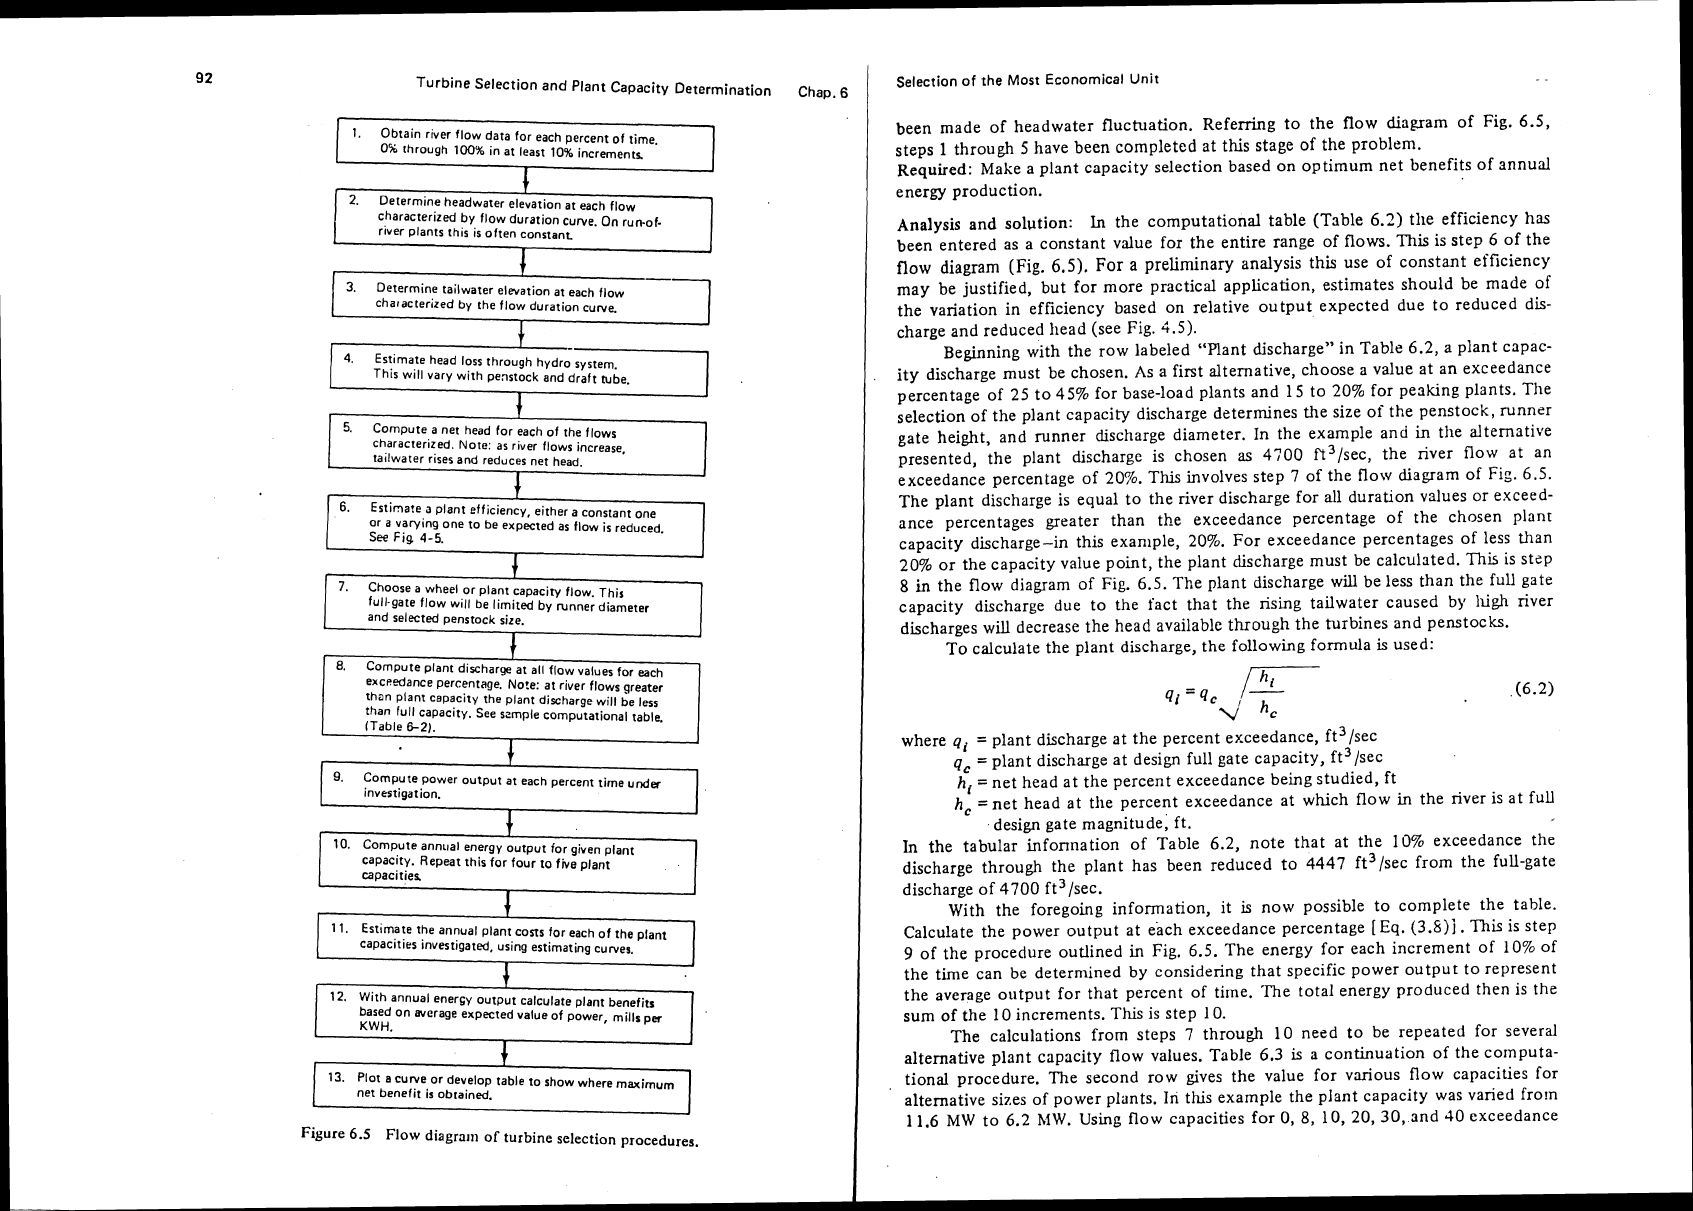
Figure 6.4 shows
how multiple units can be used effectively to take advantage
of low-flow variation.
Two-, three-, and four-unit plants of equal unit capacity are
preferred and should provide for any variation in flow. At the design stage of
analysis and with the availability of standardized units, it may be desirable to con-
sider as alternatives a single full-capacity unit, two or more equal-size units, and two
or more unequal-size units to determine the optimum equipment selection.
SELECTION OF THE MOST ECONOMICAL UNIT
Engineering consultants using experience curvcs for the selection of runner type,
speed, and diameter, and utilizing experience curves for costs of turbine installation,
Selection of the Most Economical Unit
20%
Turbine
#1
Turbine
#2
Turbine
#3
Turbine
#4
Percent
of
time
(a
1
3
units
2
units
1
unit
L
Unit speed
N,,
Figure
6.4
Effective use
of
multiple units.
SOURCE:
Allis-Chalmers
Corporation.
select units in a size or combination of sizes that gives the most economical selec-
tion. A
stepby-step process for this procedure is presented in a flow diagram of Fig.
6.5. At the time of preliminary analysis and in the early stages of feasibility analysis
it may not be necessary to choose the number of units, depending on how detailed
the feasibility study is. For the purpose of explaining the technique used for plant
capacity determination, an example problem is presented next.
Example
6.1
Given: Information on a proposed run-of-river hydropower development is shown
in computational form (Table
6.2).
The net head has been computed for the cor-
responding river flow. To obtain this information a tailwater rating curve
was
developed and used to calculate net head by taking the difference between head-
water and tailwater and then subtracting head losses in the penstock. Note that
in
this case, at very high flows the head is less than at low flow.
This
is because
normally the tailwater will be higher at the
higher flows.
A
study must also have
Turbine Selection and Plant Capacity Determination
1.
Obtain river flow data for each percent of time.
0%
through
100%
in at least
10%
increments
1
1
2.
Determine headwater elevation at each flow
characterized by flow duration curve. On
ruwoF
river plants this is often constant
1
3.
Determine tailwater elevation at each flow
characterized by the flow duration curve.
Estimate head loss through hydro system.
This will vary with penstock and draft tube.
characterized.
Note: as river flows increase,
t
6.
Ertina!e
a
plant efficiency, either a constant one
or a varying one to be expected as flow is reduced.
See
Fig
4-5.
f
7.
Choose a wheel or plant capacity flow. This
full-gate flow will be limited by runner diameter
and selected penstock sire.
I
exceedance percentage. No!e: at river flows greater
than plant capacity the plant
discharge will be less
than full capacity. See
szmple computational table.
(Table
62).
9.
Compute power output at each percent time
under
investigation.
I
Figure
6.5
Flow
diagmrn
of
turbine
selection
procedures.
Chap.
E
Selection of the Most Economical Unit
. .
been made of headwater fluctuation. Referring to the flow diagram of Fig.
6.5,
steps 1 through
5
have been completed at this stage of the problem.
Required: Make a plant capacity selection based on optimum net benefits of annual
energy production.
Analysis and solution:
ln
the computational table (Table
6.2)
tlie efficiency has
been entered as a constant value for the entire range of flows.
This
is step
6
of the
flow diagram
(Fig.
6.5).
For
a preliminary analysis this use of constant efficiency
may be justified, but for more
practical application, estimates should be made of
the variation in efficiency based on relative output expected due to reduced dis-
charge and reduced
head (see Fig.
4.5).
Beginning with the row labeled "Rant discharge" in Table
6.2,
a plant capac-
ity discharge must be chosen. As a first alternative, choose a value at an exceedance
percentage of
25
to
45%
for base-load plants and 15 to 20% for peaking plants. The
selection of the plant capacity discharge determines the size of the penstock, runner
gate height, and runner discharge diameter. In the example and
in
the alternative
presented, the plant discharge is chosen
as
4700 f13/sec, the river flow at an
exceedance percentage of
20%.
This
involves step
7
of the flow diagram of Fig.
6.5.
The plant discharge is equal to the river discharge for all duration values or exceed-
ance percentages greater than the exceedance percentage of the chosen plant
capacity discharge-in this
example, 20%. For exceedance percentages of less than
20%
or the capacity value point, the plant discharge must be calculsted.
This
is step
8
in
the flow diagram of Fig.
6.5.
The plant discharge will be less than the full gate
capacity discharge due to the fact that the rising tailwater caused by
high
river
discharges
will
decrease the head available through the turbines and penstocks.
To calculate the plant discharge, the following formula
is
used:
where
qi
=
plant discharge at the percent exceedance, ft3/sec
qc
=plant discharge at design full gate capacity, ft3/sec
hi
=
net head at the percent exceedance being studied, ft
h,
=net head at the percent exceedance at which flow in the river is at full
design gate magnitude; ft.
In the tabular infonnation of Table
6.2,
note that at the 1070 exceedance the
discharge through the plant has been reduced to 4447 ft3/sec from the full-gate
discharge of 4700 ft3/sec.
With the foregoing
information, it
is
now possible to complete the table.
Calculate the power output at
each exceedance percentage [Eq.
(3.S)j.
This
is step
9
of the procedure outlined in Fig.
6.5.
The energy for each increment of
10%
of
the time can be determined by considering that specific power output to represent
the average output for that percent of
tirne. The total energy produced then is the
sum of the 10 increments.
This
is step 10.
The calculations from steps
7
through 10 need to be repeated for several
alternative plant capacity flow values. Table 6.3 is a continuation of the
cornputa-
tional procedure. The second row gives the value for vaious
flow
capacities for
alternative
sizes of power plants. In this example the plant capacity was varied from
11.6 MW to
6.2
hlW.
Using flow capacities for
0,
8,
10,
20,
30, and 40 exceedance
Selection of the Most Economical Unit
Plant size in MW
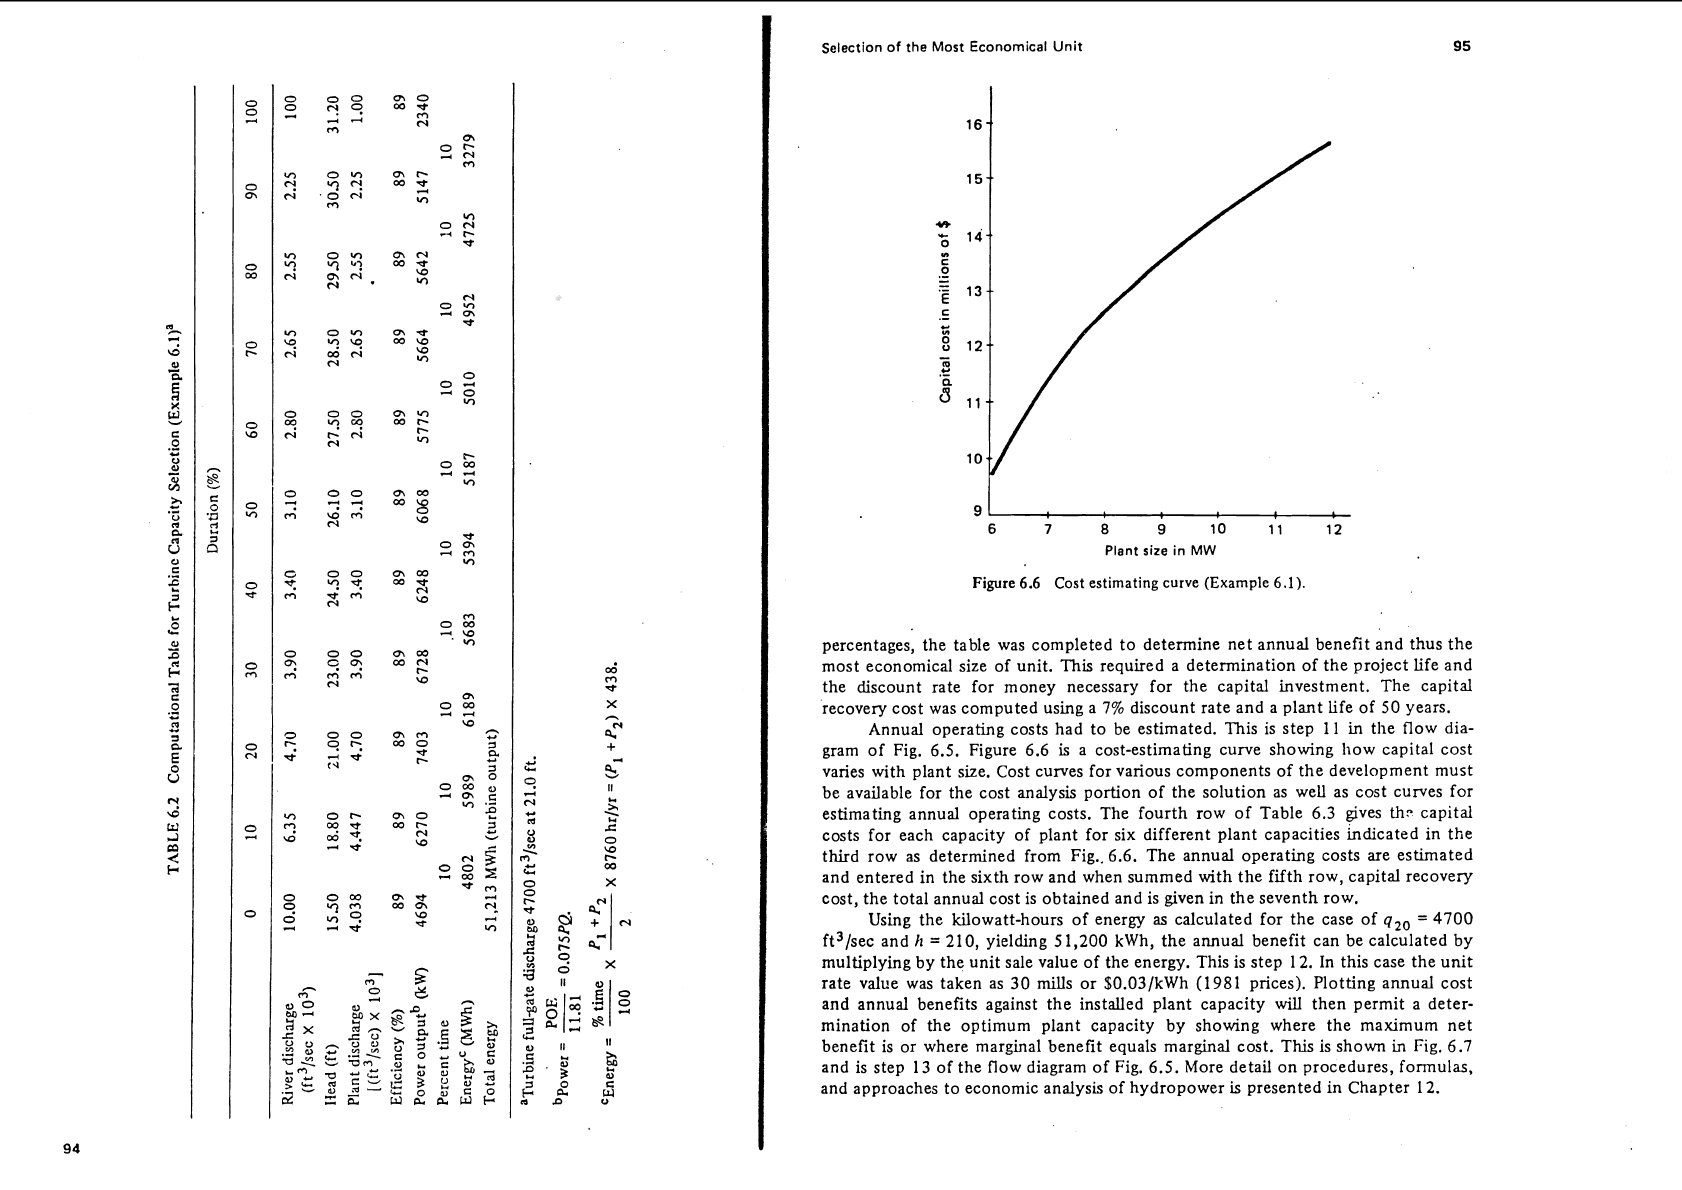
Figure
6.6
Cost estimating curve (Example
6.1).
percentages, the table was completed to determine net annual benefit and thus the
most economical size of unit.
This
required a determination of the project life and
the discount rate for money necessary for the capital investment. The capital
recovery cost was computed using a
7%
discount rate and a plant life of 50 years.
Annual operating costs had to be estimated. This is step 11 in
the flow dia-
gram of Fig.
6.5.
Figure
6.6
is
a cost-estimating curve showing how capital cost
varies with plant size. Cost curves for various components of the development must
be available for the cost analysis portion of the solution as well as cost curves for
estimating annual operating costs. The fourth row of Table 6.3 gives
th?
capital
costs for each capacity of plant for six different plant capacities indicated in the
third row as determined from Fig..
6.6.
The annual operating costs are estimated
and entered in the sixth row and when summed with the fifth row, capital recovery
cost, the total annual cost is obtained and is given in the seventh row.
Using the kilowatt-hours of energy
as
calculated for the case of
q20
=
4700
ft3/sec and
h
=
210, yielding 51,200 kwh, the annual benefit can be calculated by
multiplying by the unit sale value of the energy. This is step 12. In this case the unit
rate value was taken as 30 mills or
$0.03/kWh (1981 prices). Plotting annual cost
and annual benefits against the installed plant capacity
will
then permit a deter-
mination of the optimum plant capacity by showing where the maximum net
benefit is or where marginal benefit equals marginal cost. This is shown in Fig.
6.7
and is step 13 of the flow diagram of Fig.
6.5.
More detail on procedures, formulas,
and approaches to economic analysis of hydropower
is
presented in Chapter 12.
Turbine Selection and Plant Capacity Determination
Chap.
6
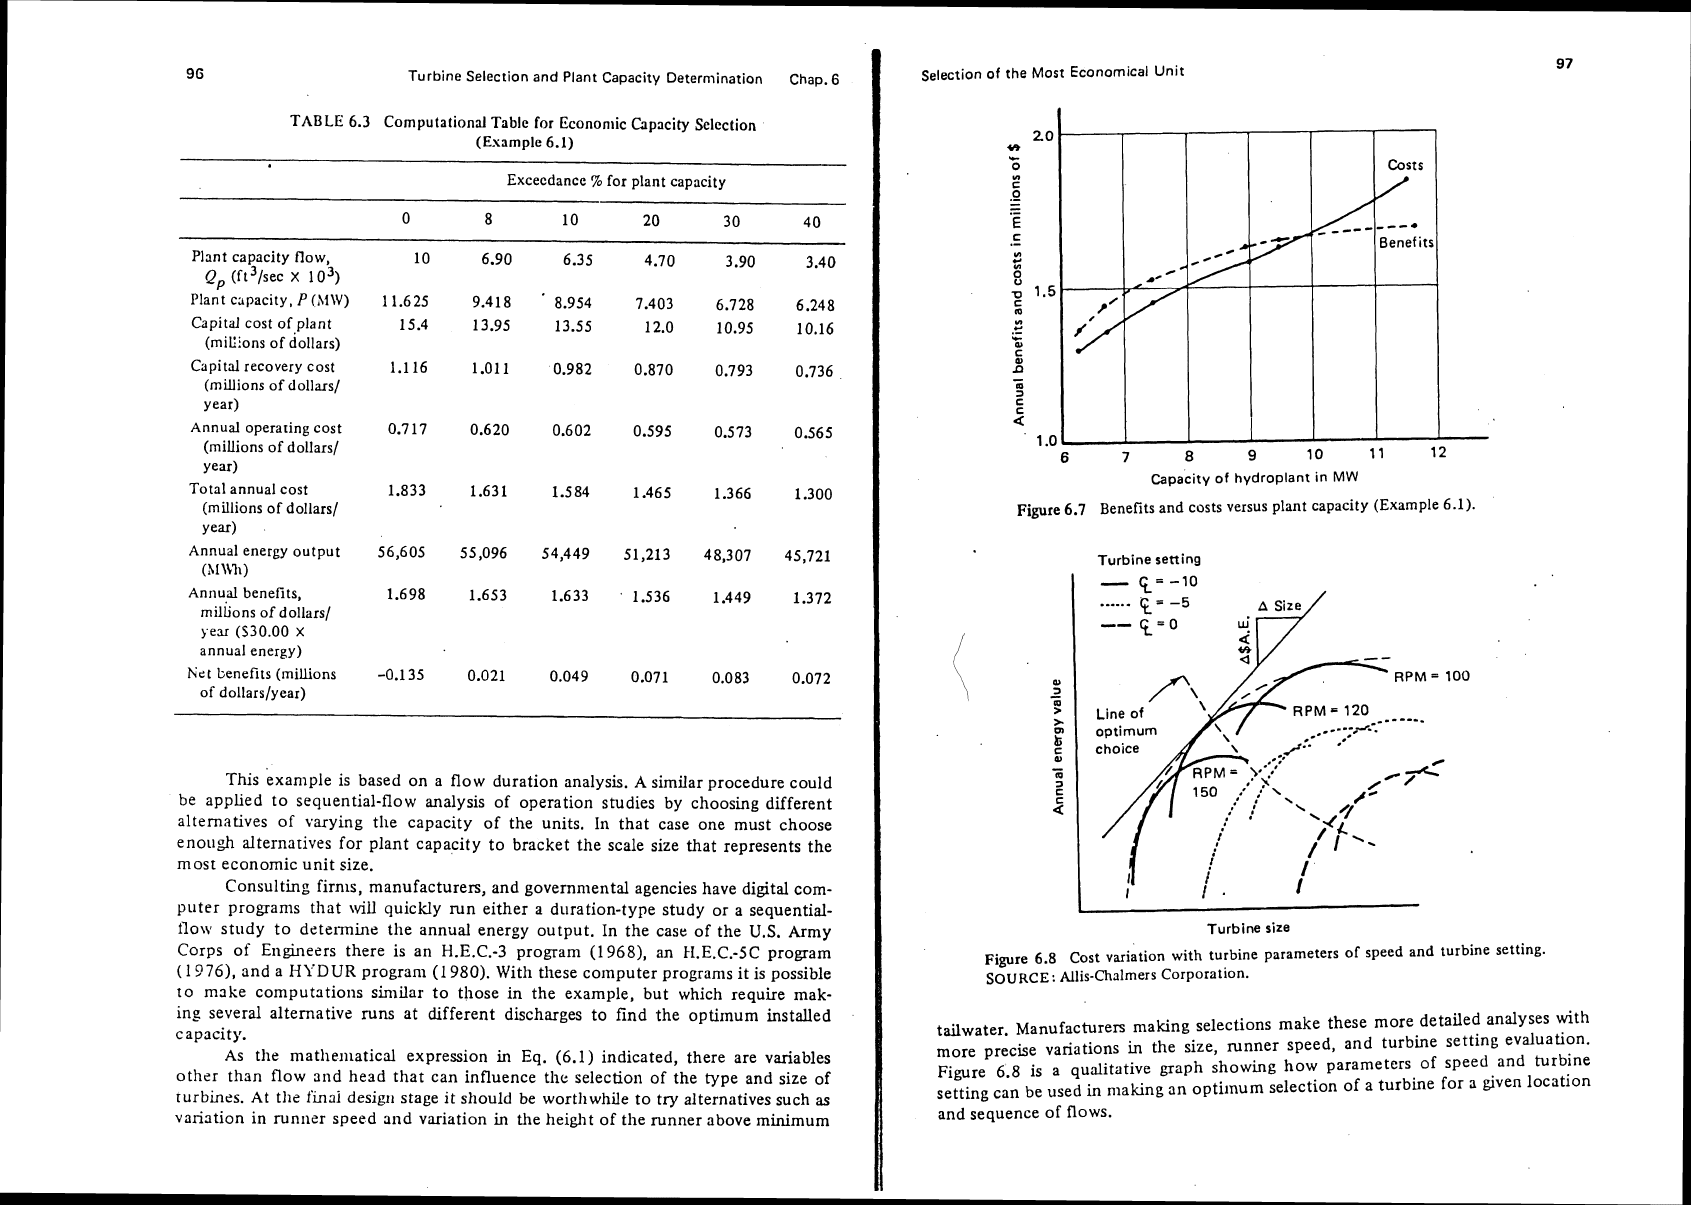
TABLE
6.3
Computational Table for Economic Ckpacity Selection
(Esample
6.1)
Excecdance
70
for plant capacity
0 8 10 20
3
0 40
Plant capacity flow,
10 6.90 6.35 4.70 3.90 3.40
Q,
(ft3/sec
x
lo3)
plait capacity,
P
OIW)
11.625 9.418
'
8.954 7.403 6.728 6.248
Capital cost of plant
15.4 13.95 13.55 12.0 10.95 10.16
(miCions of dollars)
Capital recovery cost
1.1
16 1.011 0.982 0.870 0.793 0.736
(millions of dollars/
year)
Annualoperaringcost
0.717 0.620 0.602 0.595 0.573 0.565
(millions of dollars/
year)
Total annual cost
1.833 1.631 1.584 1.465 1.366 1.300
(millions of dollars/
year)
Annual energy output
56,605 55,096 54,449 51,213 48,307 45,721
(Al\Ch)
Annu,al benefits,
1.698 1.653 1.633
'
1.536 1.449 1.372
millions of dollars/
year
(S30.00
X
annual energy)
Ku'2t
benefits (millions
-0.135 0.021 0.049 0.071 0.083 0.072
of dollarslyear)
This example is based on a flow duration analysis.
A
similar procedure could
be applied to sequential-flow
analysis of operation studies by choosing different
alternatives of varying
the capacity of the units.
In that case one must choose
enough alternatives for plant capacity to bracket the scale size that represents the
most economic unit size.
Consulting firms, manufacturers, and governnlental agencies have digital com-
puter
progranls that will quickly run either
a
duration-type study or a sequential-
flowv study to determine the annual energy output. In the case of the
U.S.
Army
Corps of
Engineers there is an
H.E.C.-3
program (1968), an
I-1.E.C.-SC
program
(1?76), and a
I-IYDUR
program (1980). With these computer programs it is possible
to make computations similar to those in the example, but which require mak-
ing several alternative
runs at different discharges to find .the
optimum
installed
capacity.
As
the matlie~~latical expression in Eq. (6.1) indicated, there are variables
other than flow and head that can influence the selection of the type and size of
turbines. At the
fmai
design stage it should be worthwhile to try alternatives such
as
variation in runner speed and variation
in
the height of the runner above minimum
Selection
of
the Most Economical Unit
Capacity of hydroplant in
MW
Figure
6.7
Benefits and costs versus plant capacity (Example
6.1).
Turbine setting
I
c=-10
A
Size
+"
Line of
optimum
choice
RPM
=
RPM
=
120
.-..*
---.-------
..--
.
i
i
I
1.
I
L
Turbine
size
Figure
6.8
Cost variation with turbine parameters of speed and turbine setting.
SOURCE:
Allis-Chalmers Corporation.
tailwater. Manufacturers making selections make these more detailed analyses
with
more precise variations
in
the size, runner speed, and turbine setting evaluation.
Figure
6.8
is
a qualitative graph showing how parameters of speed and turbine
setting can be used in making an
optimum selection of a turbine for a given location
and sequence of flows.
98
Turbine Selection and Plant Capacity Determination Chap.
6
REFERENCES
Fisher,
R.
K.,
"Optimization and Selection of Hydro-turbines Based on Considera-
tions of Annual Energy,"
Lorv-Head Hydroporver Developrl~ent Seminar.
York,
Pa.:
Allis-Clialmers Corporation, 1979.
O'Brien,
E.,
A. C. George, and C.
C.
Purdy, "Evaluation of Small Hydroelectric
Potential." Brochure. New York:
Tlppetts-Abbett-McCartl~y-Stratton,
1979.
U.S.
Army Corps of Engineers, "Determination of Power and Energy Output."
Chapters
1
and
2
in
Hydropower,
EM
'1 1 10-2-1701. Washington, D.C.: U.S.
Army Corps of Engineers, 1952.
U.S. Army Corps of Engineers, "Reservoir System Analysis,"
Generalized Computer
Program
Davis, Calif.: The Hydrologic Engineering Center, U.S. Army Corps of
Engineers, 1968.
U.S. Army Corps of Engineers, "Simulation of Flood Control and Conservation
Systems,"
U~ers'
hlanual.
Davis, Calif.: U.S. Army Corps of Engineers, 1976.
U.S. Army Corps of Engineers, '"HYDUR,' Hydropower Analysis Using
Stream-
flow Duration Procedure,"
Users' Manual Preliminary Version.
Davis, Calif.: The
Hydrologic Engineering Center, U.S. Army Corps of Engineers, 1980.
U.S. Department of the Interior, "Selecting Hydraulic Reaction Turbines," A Water
Resources Technical Publication.
Engineerrrrg Monograph No.
20.
Denver, Colo.:
U.S.
Department of the Interior, Bureau of Reclamation, 1976.
PROBLEMS
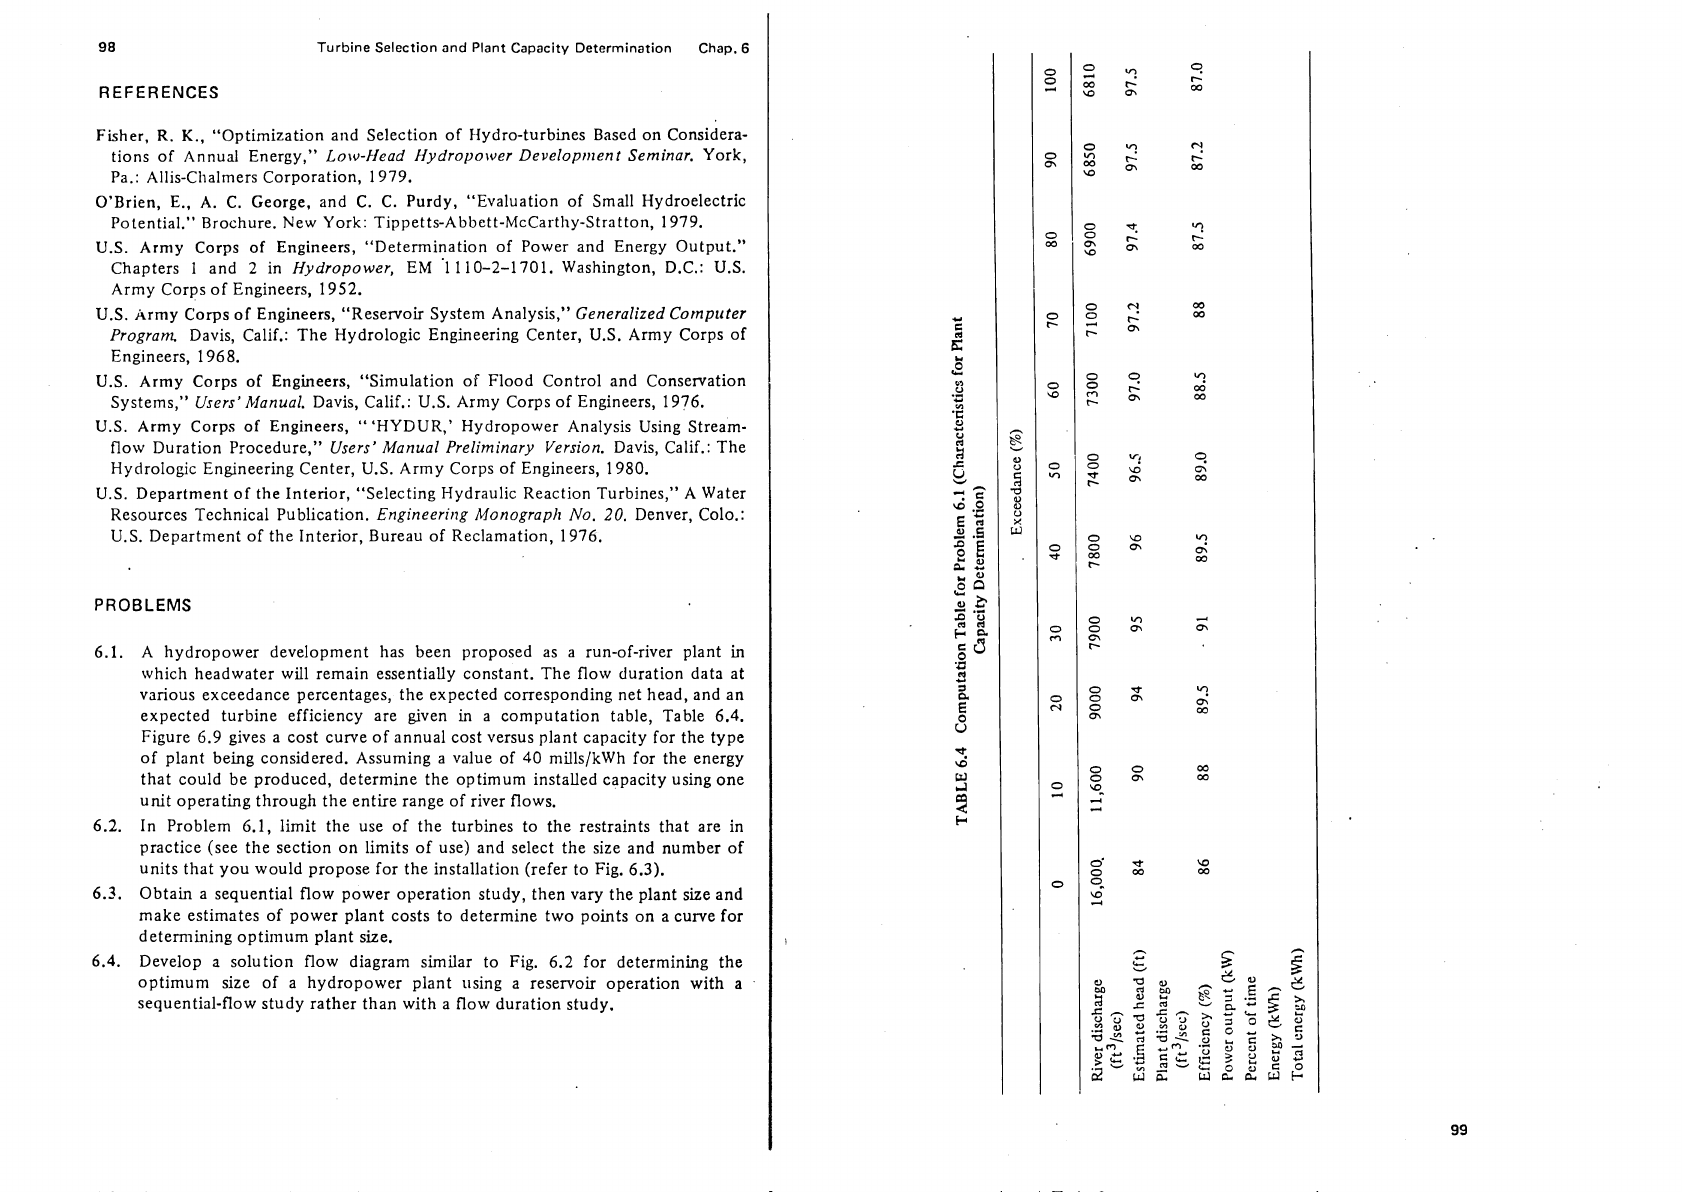
6.1.
A hydropower development has been
proposed as a run-of-river plant in
which headwater will remain essentially constant. The flow duration data at
various exceedance percentages, the expected corresponding net head, and an
expected turbine efficiency are given in a computation table, Table 6.4.
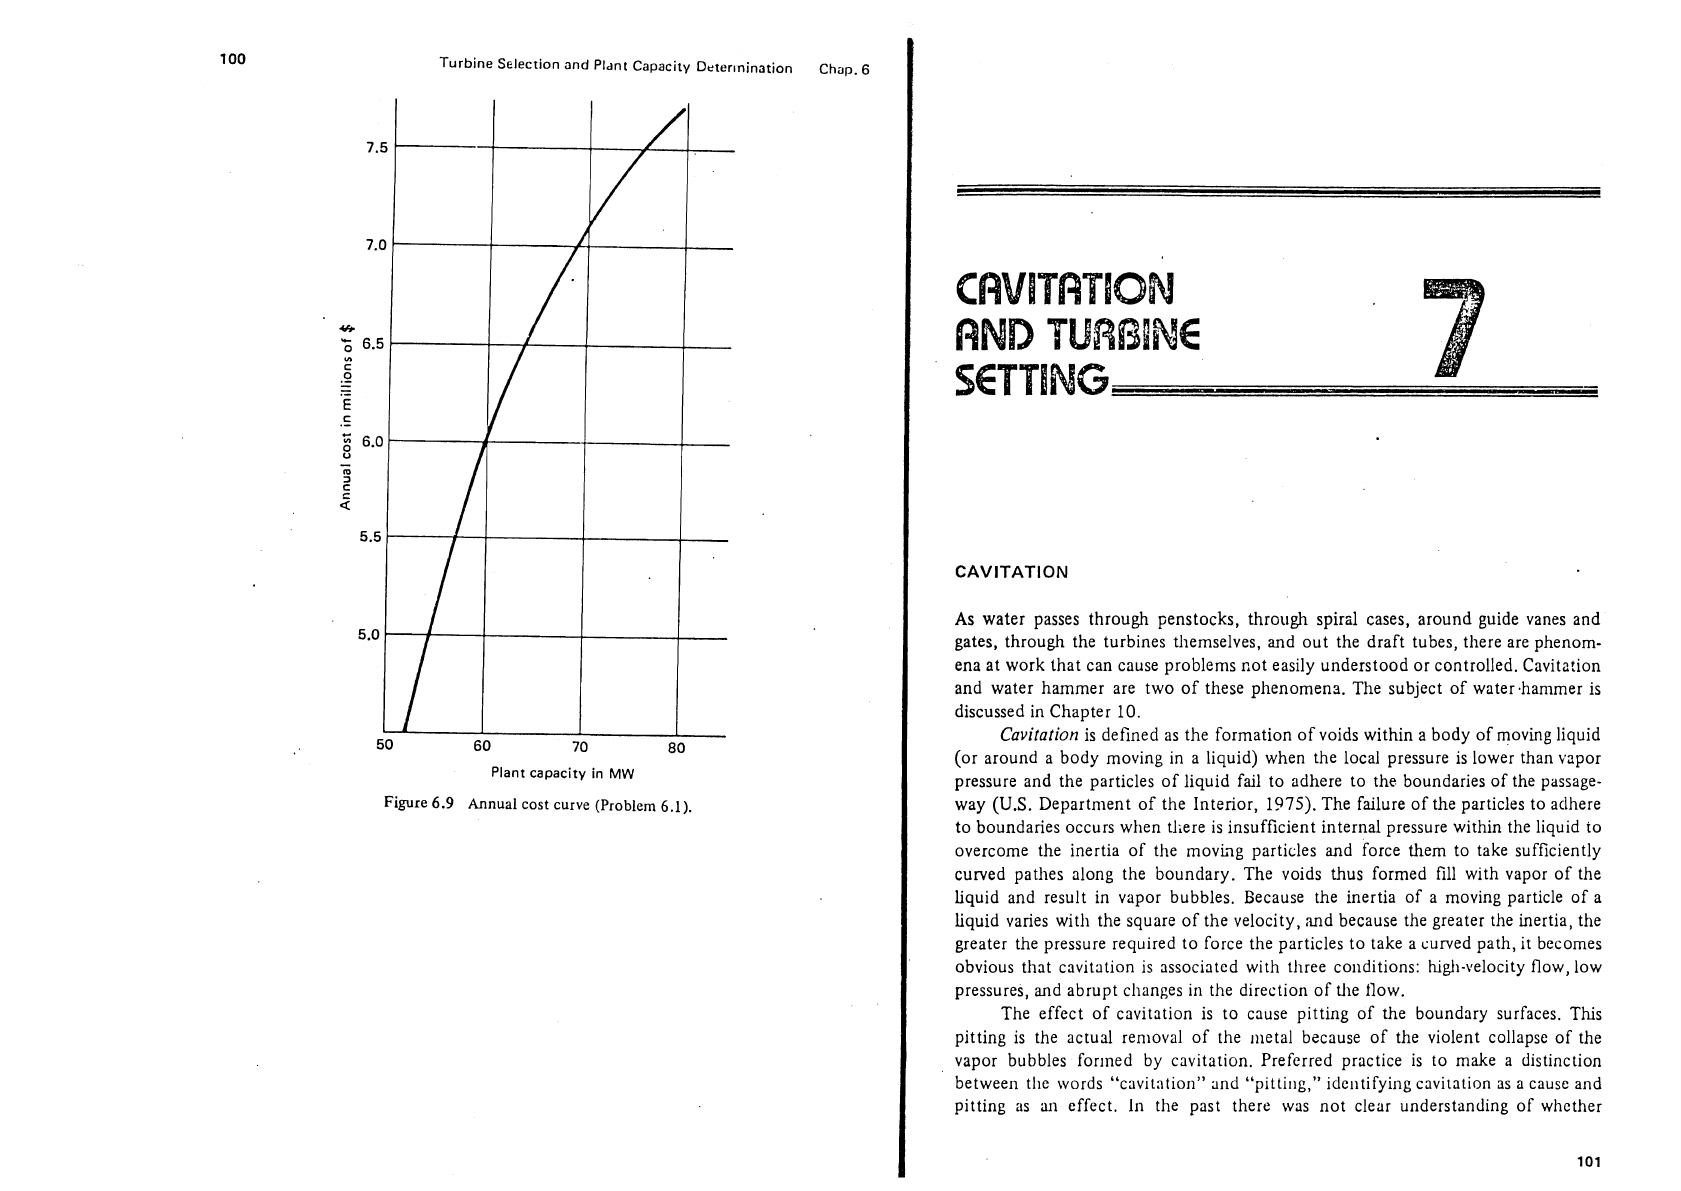
Figure 6.9 gives a cost curve of annual cost versus plant capacity for the type
of plant being considered. Assuming a value of
40
mills/kWh for the energy
that could be produced, determine the optimum installed capacity using one
unit operating through the entire range of river flows.
6.2. In Problem
G.1, limit the use of the turbines to the restraints that are in
practice (see the section on limits of use) and select the size and number of
units that you would propose for the installation (refer to Fig. 6.3).
6.3.
Obtain a sequential flow power operation study, then vary the plant size and
make estimates of power plant costs to determine two points on a curve for
determining
opti~num plant size.
6.4. Develop a solution flow diagram similar to Fig. 6.2 for determining the
optimum size of a hydropower plant using a reservoir operation with a
sequential-flow study rather than with a flow duration study.
Turbine S~lection and Pldnt Capacity Drter~ninotion
Chap.
6
Plant
capacity
in
MW
Figure
6.9
Annual cost curve (Problem
6.1).
CAW
BBATBOM
RND
TURBINE
SETTING
-
CAVITATION
As
water passes through penstocks, through spirsl cases, around guide vanes and
gates, through the turbines themselves, and out the draft tubes, there are phenom-
ena at work that can cause problems
cot easily understood or controlled. Cavitation
and water hammer are two of these phenomena. The subject of
water.hammer is
discussed in Chapter
10.
Cavitation
is
defined as the formation of voids within a body of moving liquid
(or around a body moving in a liquid) when the local pressure is lower than vapor
pressure and the particles of liquid fail to adhere to the boundaries of the passage-
way
(U.S.
Department of the Interior,
1975).
The failure of the particles to adhere
to boundaries occurs when tliere is insufficient internal pressure within the liquid to
overcome the inertia of the
movi~g particles and force them to take sufficiently
curved pathes along the boundary. The voids thus formed fill with vapor of the
liquid and result in vapor bubbles.
Eecause the inertia of a moving particle of a
liquid varies with the square of the velocity,
,md because the greater the inertia, the
greater the pressure required to force the particles to take a curved path, it becomes
obvious that cavitation is
associatcd with three conditions: tugll-velocity flow, low
pressures, and abrupt changes in the direction of the
flow.
The effect of cavitation is to cause pitting of the boundary surfaces. This
pitting is the actual
removal of the metal because of the violent collapse of the
vapor bubbles
formed by cavitation. Preferred practice is to make a distinction
between
tile
words "cavitation" and "pitli~~g," idc~~tifying cavitation as a cause and
pitting as
an
effect.
In
the past there was not clear understanding of whether
102
Cavitation
and
Turbine
Setting
Chap.
7
destructive pitting was caused by the chemical action of oxygcn being released
fro111 water under a
liigli
vacuum, or by collapse of bubbles, or by both actions. The
lack of knowledge was due to the difficulty of observing the phenomenon.
As
reported
by
the
U.S.
Department of the Interior (1975), Knapp and Ilollander
(1948) made very high speed photographic studies of the cavitation pl~enonienon in
a laboratory. Their pictures revealed the formation, growth, and collapse of indi-
vidual bubbles. These bubbles had diameters of about 0.25 in. and had life spans of
only 0.003
sec; their velocity of collapse was calculated to be 765 ft/sec. Using
water
hammer theory, it was calcu]atcd that the bubbles' collapse could cause
pressures of at least 50,000
1b/in2. The resulting pressure was concentrated on a
microscopically
small boundary area of metal. This then resulted in fatigue-like
destruction and failure of
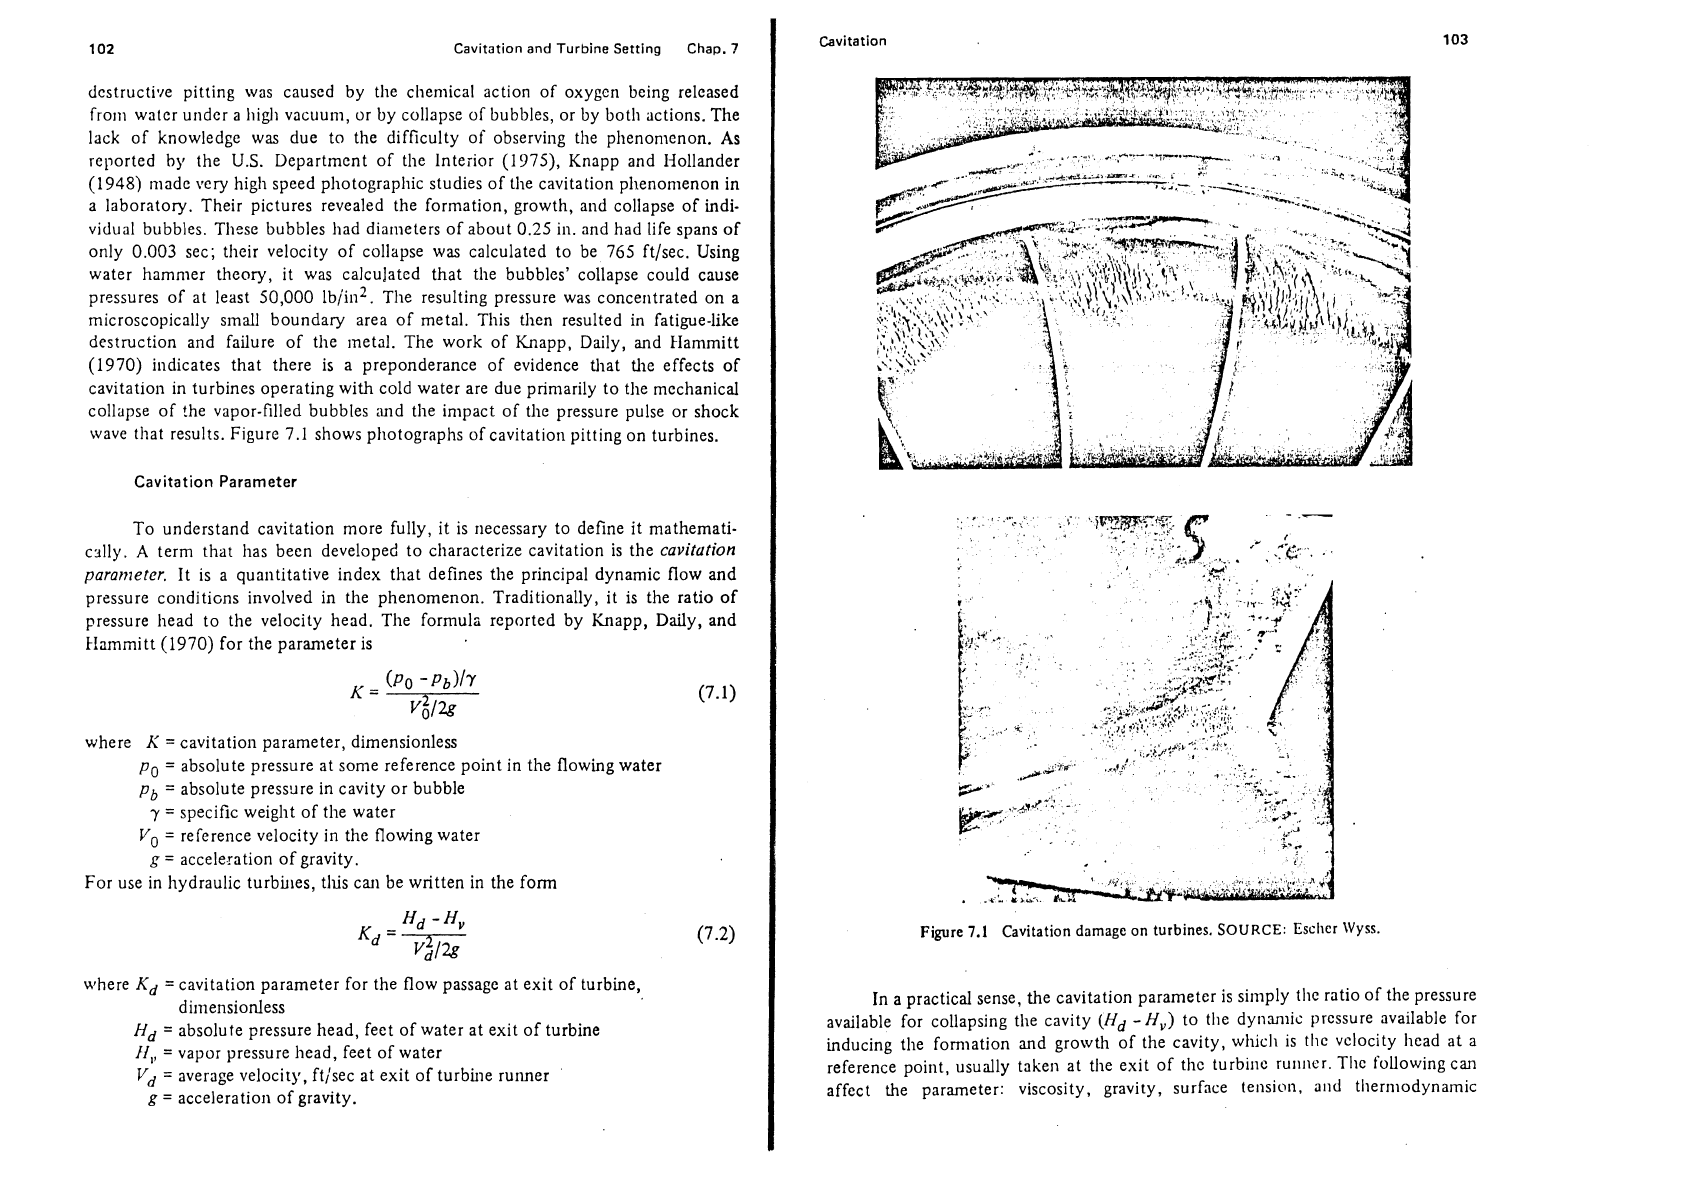
the lnetal. The work of Knapp, Daily, and Hammitt
(1970) indicates that there is
a
preponderance of evidence that the effects of
cavitation in turbines operating with cold water are due primarily to
the mechanical
collapse of !he vapor-filled bubbles
rmd the impact of the pressure pulse or shock
wave that results. Figure 7.1 shows photographs of cavitation pitting on turbines.
Cavitation Parameter
To understand cavitation more fully, it is necessary to define it
mathemati-
c~lly.
A
term that Izas been developed to characterize cavitation is the
cavitution
paran~eter.
It is a quantitative index that defines the principal dynamic flow and
pressure
conditicns involved in the phenomenon. Traditionally, it is the ratio of
pressure head to the velocity head. The formula reported by Knapp, Daily, and
Hammitt (1970) for the parameter is
where
K
=
cavitation parameter, dimensionless
p,,
=
absolute pressure at some reference point in the flowing water
pb
=
absolute pressyre in cavity or bubble
y
=
specific weight of the water
Vo
=
reference velocity in the flowing water
g
=
acceleration of gravity.
For use in hydraulic
turbuies, this can be written in the form
where
Kd
=cavitation parameter for the flow passage at exit of turbine,
dimensionless
Hd
=
absolute pressure head, feet of water at exit of turbine
ti,,
=
vapor pressure head, feet of water
lfd
=
average velocity, ftisec at exit of turbine runner
g
=
acceleration of gravity.
Cavitation
I
"i
,
---'--LAP
.
.st..
&>&&~
#&.A
Figure
7.1
Cavitation damage on turbines.
SOURCE.
Eschcr
Wyss.
In a practical sense, the cavitation parameter is sirnply the ratio of the pressure
available for collapsing
the cavity
(Hd
-
H,)
to tlie dynamic: prcssure available for
inducing the
fornlation
and
growth of the cavity, whicll is tllc vclocity head at a
reference point, usually taken at
tlle exit of thc turblnc rullncr. Thc following can
affect the parameter: viscosity, gravity, surface tensioll, and tllermodynamic
I
Cavitation
Cavitation
and
Turbine Setting
Chap.
7
properties of the water and vapor, as well as contaminants within the water
and
changes in the boundary conditions that will alter the velocity, V,,. For cold water
the thermodynamic effects play a minor role.
Cavitation
Coefficient
More used in the turbine industry and engineering profession than "cavitation
parameter" is a coefficient or turbine constant known variously as the
plant
signla,
Thoma number, or cavitation coefficient. Mathematical development of the equa-
tion of the plant sigma is
iinportant to
an
understanding of cavitation and gives
emphasis to the use of the plant sigma in the selection of the turbine setting.
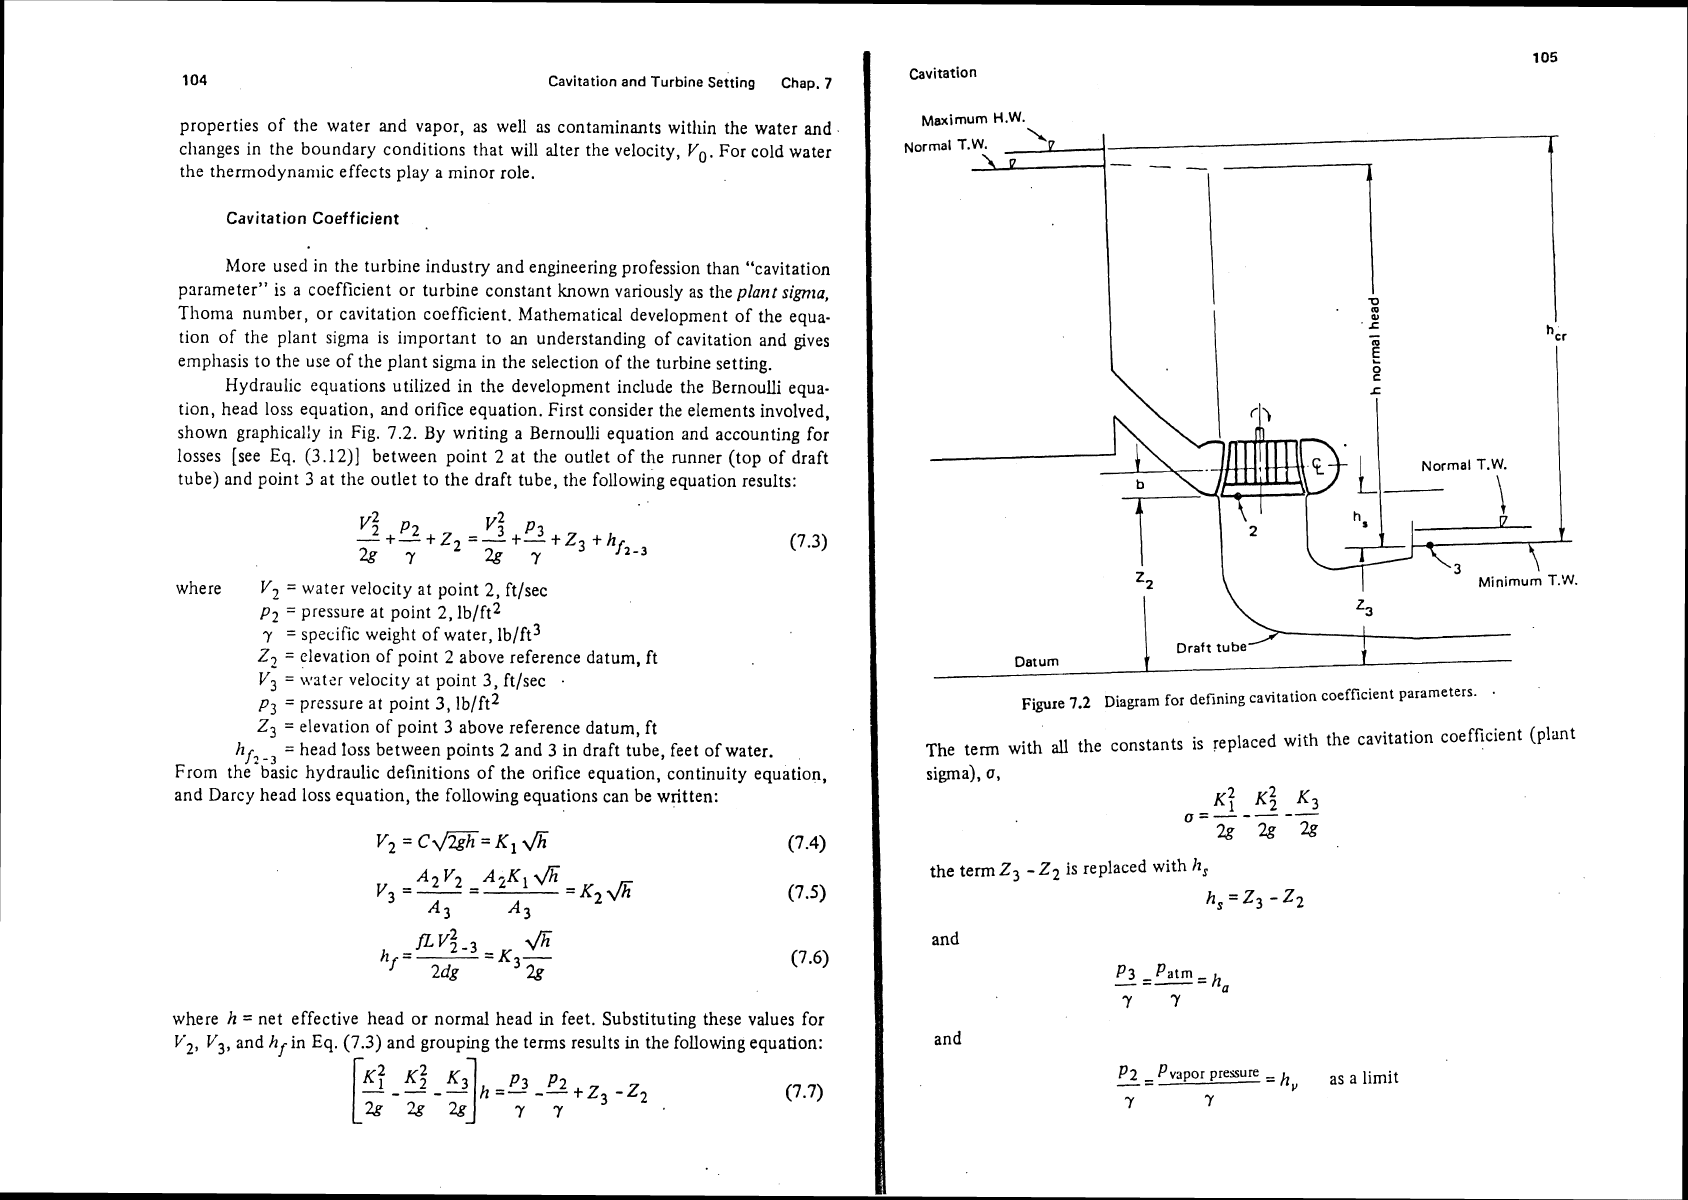
Hydraulic equations utilized in the development include the Bernoulli equa-
tion, head loss equation, and orifice equation. First consider the elements involved,
shown
graphical!^
in Fig. 7.2. By writing a Bernoulli equation and accounting for
losses [see Eq.
(3.12)]
between point
2
at the outlet of the runner (top of draft
tube) and point 3 at the outlet to the draft tube, the following equation results:
where
V2
=
water velocity at point
2,
ftlsec
p2
=
pressure at point 2,1b/ft2
y
=
specific weight of water, lb/ft3
Z2
=
elevation of point 2 above reference datum, ft
V3
=
watzr velocity at point 3, ftlsec
.
p3
=
pressure at point
3,
lb/ft2
Z3
=
elevation of point
3
above reference datum, ft
=
head
toss
between points
2
and
3
in draft tube, feet of water.
From the basic hydraulic definitions of the orifice equation, continuity equation,
and Darcy head loss equation, the following equations can be written:
where
h
=
net effective head or normal head
in
feet. Substituting these values for
V2,
V3,
and hfin
Eq.
(7.3) and grouping the terms results in the following equation:
-
-
Maximum
H.W.
Normal T.W.
Draft
tube
Datum
Figu~e
7.2
Diagram for defining cavitation coefficient parameters.
.
The term with
all
the constants is replaced with the cavitation coefficient
(plmt
sigma),
0,
the term
Z3 -Z2
is replaced with
h,
h,=Z3
-Z2
and
1
and
P2
-
Pvapor
pressure
=
--
h,
asalimit
Y
Y
106
Cavitation and Turbine Setting Chap.
7
The resulting convenient equation is
where
a
=
cavitation coefficient (plant sigma)
h,
=
difference in elevation between minimum tailwater and the cavitation
reference point at the outflow from the turbine, ft
h,
=
atmospheric pressure head, ft
11,
=
vapor pressure head at temperature of water issuing from the turbine, ft.
In the metric system
where all the heads are expressed in meters of water head.
In practice, the term
h,
net effective head, is replaced with a term called
critical
head,
hc,
(see Fig.
7.2).
It should be noted that as the headwater or forebay
water level rises and the tailwater lowers, there is an operating head greater than the
normal design head that will be functioning at times. This condition must be
allowed for in the design of the turbine setting.
A
later discussion on turbine setting
will
require use of the plant sigma equation [Eq. (7.9)] and the use of critical head.
The occurrence of cavitation and its inception is usually associated with in-
creased noise, vibration, and a loss in performance of the turbine. Often it is diffi-
cult to identify where the cavitation starts because the vapor bubbles may grow
rapidly and be swept downstream to the place where collapse occurs and damage
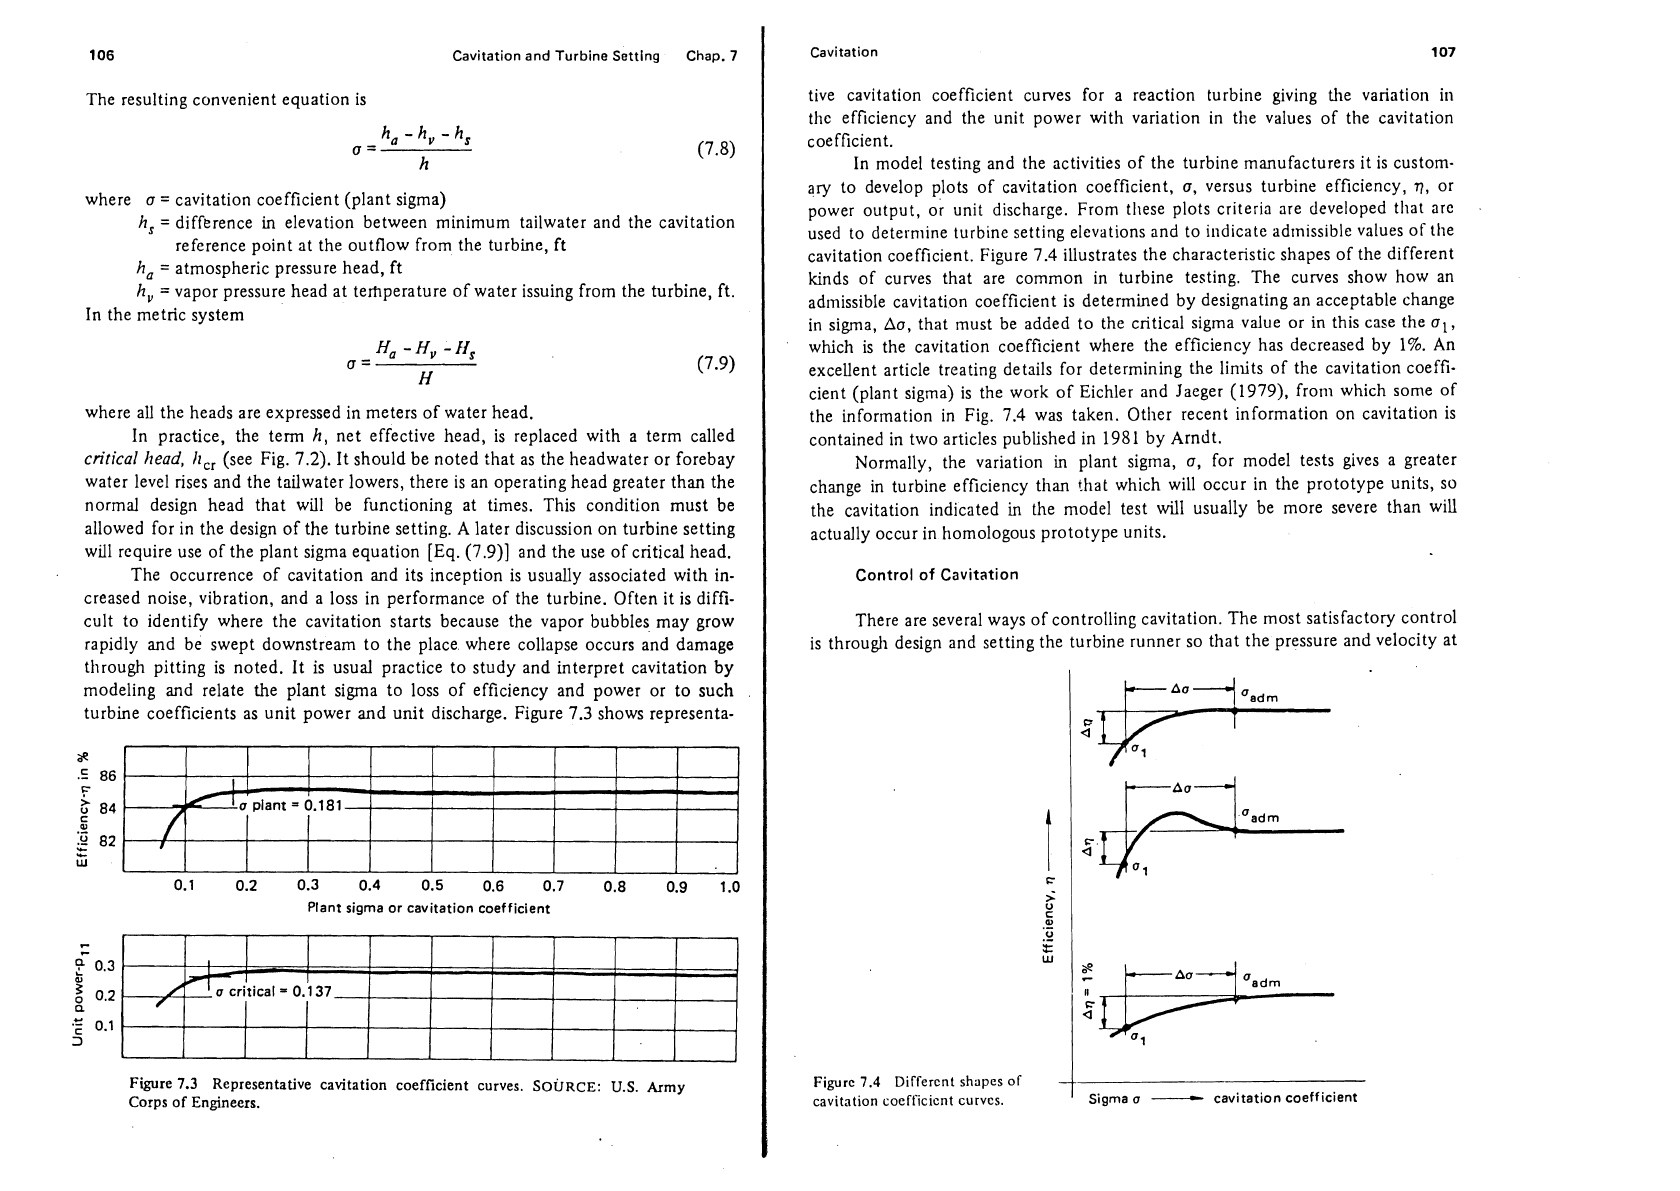
through pitting is noted. It is usual practice to study and interpret cavitation by
modeling and relate the plant sigma to loss of efficiency and power or to such
turbine coefficients as unit power and unit discharge. Figure
7.3
shows representa-
Plant sigma or cavitation coefficient
Figure
7.3
Representative cavitation coefficient curves.
SOURCE:
U.S.
Army
Corps of Engineers.
Cavitation
107
tive
cavitation coefficient curves for a reaction turbine giving the variation in
the efficiency and the unit power with variation in the values of the cavitation
coefficient.
In model testing and the activities of the turbine manufacturers it is custom-
ary to develop plots of cavitation coefficient,
a,
versus turbine efficiency,
7,
or
power output,
or unit discharge. From these plots criteria are developed that are
used to
deterniine turbine setting elevations and to indicate admissible values of the
cavitation coefficient. Figure 7.4 illustrates the characteristic shapes of the different
kinds of curves that are common in turbine testing. The curves show how an
admissible cavitation coefficient is determined by designating an acceptable change
in sigma,
Ao,
that must be added to the critical sigma value or in this case the
01,
which is the cavitation coefficient where the efficiency has decreased by
1%.
An
excellent article treating details for determining the
limits of the cavitation coeffi-
cient (plant sigma) is the work of Eichler and Jaeger
(1979),
from which some of
the information in Fig. 7.4 was taken.
Other recent information on cavitation is
contained in two articles published in
1981
by Arndt.
Normally, the variation in plant sigma,
a,
for model tests gives a greater
change in turbine efficiency than !hat which will occur in the prototype units, so
the cavitation indicated
in
the model test will usually be more severe than will
actually occur in homologous prototype units.
Control of Cavitation
There are several ways of controlling cavitation. The most satisfactory control
is through design and setting the turbine runner so that the pressure and velocity at
Figurc
7.4
Different
shapes
of
cavitation coefficient curves.
Sgma
0
-
cavitation coefficient