Vij D.R. Handbook of Applied Solid State Spectroscopy
Подождите немного. Документ загружается.

6.5 INTERACTIONS OF CRYSTAL FIELD SPLIT IONS
6.5.1. Introductory Remarks
In the preceding sections, we considered crystal field effects for non-
interacting rare earth ions. However, the crystal field states are usually subject
to interactions with phonons, spin fluctuations, conduction electrons (or more
generally charge carriers), etc., which limit the lifetime of the crystal field
states, thus the observed crystal field transitions exhibit line broadening. This
has major consequences for the cross-section formulae, which have been
derived to interpret spectroscopic experiments. More specifically, in the
neutron cross-section formulae (6.53) and (6.54) the G-function describing the
energy conservation has to be replaced by a Lorentzian with a finite linewidth
whose temperature dependence is characteristic of the particular type of
interaction. Moreover, if the rare earth ions are coupled by the exchange
interaction, the crystal field excitations can propagate through the lattice. All
these effects will be discussed in the following subsections.
6.5.2 Interaction with Phonons
Theoretical models of the effects of lattice vibrations in distorting the crystal
field have been suggested since the early 1930s by Heitler and Teller [57],
Kronig [58], and van Vleck [59]. A more detailed and general approach was
developed later by Orbach [60]. His main idea was to treat the spin-lattice
interaction as a dynamic crystal field effect, which produces deformations of
the equilibrium charge configuration of the surrounding ions. Orbach
proposed to expand the crystal field potential V in powers of the fluctuating
strain H caused by the lattice vibrations [60]:
(0) (1) 2 (2)
VV V V
,
HH
!
(6.56)
where V
(0)
is the static term, V
(1)
and V
(2)
represent the dynamical part of the
magnetic ion-lattice interaction generated by the strain in first- and second-
order, respectively. In these calculations the spin-orbit coupling has to be
included. The terms V
(n)
in equation (6.56) turned out to be of the same order
as the static V
(0)
. These calculations made it possible to evaluate the spin-
lattice relaxation time in terms of a few constants. However, the additional
distinction of whether the rare earth ion has an odd (Kramers ion) or an even
number of electrons must be made.
Orbach considered in detail one-phonon (or direct) and two-phonon
processes. Suppose that the ground state J-multiplet of the rare earth ion is
split into two low-lying states |a² and |b², energetically separated from the
excited state |c². In a direct process a single transition ¨ is made from |b² to |a²
and a phonon of energy
KZ
0
is emitted (see Figure 6.16a). This process will
6.5 Interactions of Crystal Field Split Ions
287
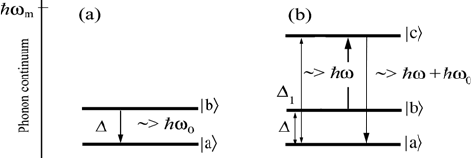
6. Crystal Field Spectroscopy
be dominant only at the lowest temperatures, for most rare earth compounds
typically around 1 K. The spin-lattice relaxation time
W
1
for the direct process
in an external field H exhibits the typical behavior
W
1
~ T
–1
H
–4
and W
1
~ T
-
1
H
-
2
for the Kramers and non-Kramers ions, respectively.
system and an intermediate transition from |b² to |c² occurs. To complete the
0
then emitted as shown in Figure 6.16b. In this case the spin-lattice relaxation
time
W
1
turns out to be W
1
~ exp(¨
1
/k
B
T).
Figure 6.16 Schematic diagram for the direct (a) and the two-phonon (b) process. Only the
anti-Stokes process is shown.
m
Z= is the maximum allowed phonon energy in the phonon
continuum.
The basic difference between the Raman (see Section 6.3.3) and the
Orbach processes is that in the former process “virtual” transitions are
involved, i.e., the crystal field state |c² has an energy ¨
1
! k
B
T
D
that lies
outside the continuum of allowed phonon frequencies (compare Figures 6.6
and 6.16b. For this case the relaxation times turn out to be
W
1
~T
–9
and W
1
~T
–7
for the Kramers and non-Kramers ions, respectively. The relaxation time of
the Raman process is independent of a magnetic field. Note that the Raman
process dominates the Orbach process at high temperatures. For further
discussion and bibliography the reader is referred to some classical textbooks
(see, e.g., [1]).
6.5.3 Interaction with Conduction Electrons
The interaction with the charge carriers is by far the dominating relaxation
mechanism in metallic rare earth compounds. The corresponding linewidth
*
n
(T) increases almost linearly with temperature according to the well-known
Korringa law [61]:
*
n
(T) 4S(g1)
2
J(J 1) N(E
F
) j
ex
>@
2
T ,
(6.57)
where g denotes the Landé factor, N(E
F
) the density-of-states of the charge
carriers at the Fermi energy E
F
, and j
ex
the exchange integral between the
charge carriers and the 4f electrons of the rare earth ions. The inclusion of
crystal field effects slightly modifies the low-temperature limit of equation
(6.57) according to the theory of Becker, Fulde, and Keller [62]:
process a transition from |c² to |a² occurs and a phonon of energy
Z + Z is
In the two-phonon process a phonon of energy
Z is absorbed by the spin
=
=
=
288
6.5 Interactions Of Crystal Field Split Ions
*
n
ij
(T) 2j
ex
2
M
ij
2
coth
ij
2k
B
T
§
©
¨
·
¹
¸
ij
M
ik
2
ik
)
exp
ik
k
B
T
^`
1
izk
¦
ª
¬
«
«
«
M
kj
2
kj
)
exp
kj
k
B
T
^`
1
§
©
¨
·
¹
¸
kz j
¦
º
¼
»
»
»
,
(6.58)
where
ij i j
summed over the Brillouin zone. For a noninteracting Fermi liquid we have
2
ij ij
"( ) N (E )
F
FZ S Z==.
(6.59)
The situation is anomalous for superconducting compounds because the
Cooper pairing of the charge carriers creates an energy gap ' below the
superconducting transition temperature T
c
, thus crystal field excitations with
there is no interaction with the charge carriers. For an isotropic gap, the
intrinsic linewidth in the superconducting state is then given by
*
s
(T) *
n
(T) exp
'
k
B
T
®
¯
½
¾
¿
.
(6.60)
This means that *
s
(T<<T
c
) § 0, and line broadening sets in just below T
c
where the superconducting gap opens. The exponential temperature
dependence of *
s
(T) was nicely demonstrated in the first neutron
spectroscopic study on the classical superconductor La
1–x
Tb
x
Al
2
[63] (see
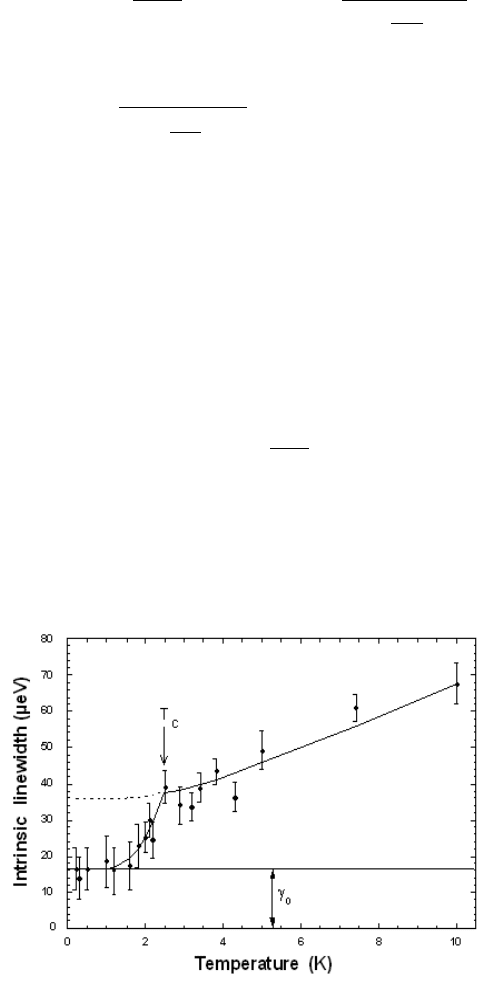
Figure 6.17).
Figure 6.17 Observed linewidth of the crystal field transition at 0.68 meV in La
0.997
Tb
0.003
Al
2
vs. temperature. The superconducting transition temperature T
c
is indicated by an arrow. The
solid curve results from a fit to eqs. (58) and (60) (after [63]) for T > T
c
and T < T
c
,
respectively. The calculations assume a constant additive contribution J
0
due to local structural
Z
=
F" Z
=
F"( Z
=
Z
=
F"( Z
=
Z
=
Z
=
E E , and F"( Z) is the imaginary part of the susceptibility
=
energy Z2' do not have enough energy to span the gap, and consequently
=
distortions.
289
6. Crystal Field Spectroscopy
6.5.4. Magnetic Exchange Interaction
In extended, undiluted systems the exchange coupling between the rare earth
ions is often of the same order of magnitude as the crystal field interaction,
thus it has to be considered in the total spin Hamiltonian: H = H
CF
+ H
EX
. The
most widely used approximation for the exchange interaction is the
Heisenberg model:
ij i j
ij
EX
HJ
¦
JJ . (6.61)
The random phase approximation is then used to express the generalized
dynamical susceptibility tensor in the following form [64]:
)()(J21
)(
),(
0
0
ZF
ZF
ZF
DE
DE
DE
q
q
,
(6.62)
where J(q) is the Fourier transform of the exchange couplings J
ij
, q the
wavevector of the propagating magnetic excitation, and
F
0
DE
(Z) the single-ion
susceptibility:
F
0
DE
(Z) gP
B
2
*
n
|J
D
|*
m
*
m
|J
E
|*
n
E
n
E
m
n,m
¦
p
*
n
p
*
m
.
(6.63)
Here E
n
and *
n
denote the energy and the wavefunction of the crystal field
states, respectively, and
p
*
n
the Boltzmann population factor. The magnetic
excitation energies are determined by the poles of equation (6.62) which
yields the dispersion relation
22
*
n
p
*
m
>@
,
(6.64)
where ' = E
m
–E
n
and M is the transition matrix element between the two
crystal field states.
Figure 6.18 shows neutron spectroscopy data observed for the
*
4
o*
5
(1)
crystal field transition in PrNi
5
[46] which gave rise to a well-defined peak in
the PCS spectra of Figure 6.8. The full dispersion measured for different
wavevectors q allowed to determine the exchange coupling parameters
parallel and perpendicular to the hexagonal c-axis. Figure 6.18 nicely shows
the flattening of the dispersion curve with increasing temperature which is due
Z
=
Z(q) '2'MJ(q) p
=
290
to the increasing thermal population of the excited state (see equation (6.64)).
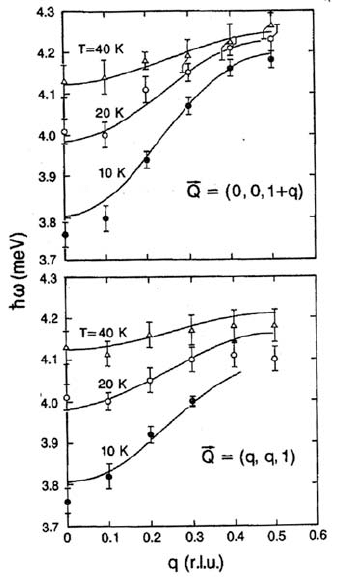
6.6 Crystal Field Effects Related
Figure 6.18 Dispersion of the *
4
o*
5
(1)
crystal field transition in PrNi
5
as a function of Q
scanned parallel and perpendicular to the hexagonal c-axis for different temperatures. The lines
represent fits to eq. (64) (after [46]).
6.6 CRYSTAL FIELD EFFECTS RELATED
TO HIGH-TEMPERATURE SUPERCONDUCTIVITY
6.6.1 Introductory Remarks
The discovery of high-temperature superconductivity in the copper-oxide
perovskites [65] has given rise to a huge amount of materials research. In
particular, there have been myriad publications reporting on the change of the
superconducting properties upon ion substitution at various sites in these
compounds. For the compounds YBa
2
Cu
3
O
x
the surprising observation was
made that the superconducting transition temperature T
c
is essentially
unchanged upon replacing the Y
3+
ions by paramagnetic rare earth (R
3+
) ions,
in contrast to conventional superconductors, for which paramagnetic ions
usually have a large detrimental effect on superconductivity. It is therefore
important to achieve a detailed understanding of the low-energy electronic
properties which define the magnetic ground state of the R
3+
ions. In
particular, information on the crystal field interaction at the R site is highly
desirable, for the following reasons:
291
6. Crystal Field Spectroscopy
(i) For many high-T
c
compounds, superconductivity and long-range three-
dimensional magnetic ordering of the R ion sublattice coexist at low
temperatures (with the exception of R = Ce and R = Pr which have a drastic
detrimental effect on superconductivity). An understanding of both the
nature of the magnetic ordering and its apparent lack of influence on T
c
requires a detailed knowledge of the crystal field states of the R ions.
(ii) In most high-T
c
compounds the R ions are situated close to the
superconducting copper-oxide planes where the superconducting carriers
are located, thus the crystal field interaction at the R sites constitutes an
ideal probe of the local symmetry as well as the local charge distribution
of the superconducting CuO
2
planes and thereby monitors directly
changes of the carrier concentration induced by doping. This property
results from the short-range nature of the leading fourth- and sixth-order
terms in the crystal field potential.
(iii) The temperature dependence of the intrinsic linewidths of crystal field
transitions reflects essentially the density-of-states associated with the
charge carriers at the Fermi energy. Linewidth studies can therefore
reveal information about the opening as well as the symmetry of the
energy gap.
In the following subsections we focus on aspects (ii) and (iii), which
provide crucial information on two important issues of the phenomenon of
high-T
c
superconductivity, namely the inhomogeneous evolution of the
superconducting state upon doping and the existence of the so-called
pseudogap, respectively.
6.6.2 The Crystal Field as a Local Probe: Evidence for
Materials Inhomogeneities
One of the most interesting aspects of the superconductivity in the compounds
of type YBa
2
Cu
3
O
x
is the relation between the superconducting transition
temperature T
c
and the oxygen stoichiometry x [66]. Annealed systems exhibit
a two-plateau structure of T
c
as visualized in Figure 6.19f. Charge transfer
from the CuO chains to the CuO
2
planes certainly plays a crucial role in the
oxygen vacancy-induced suppression of superconductivity in YBa
2
Cu
3
O
x
, and
this should manifest itself in the oxygen stoichiometry dependence of the
observed crystal field energy spectra. This is exemplified for ErBa
2
Cu
3
O
x
in
Figure 6.20 [51]. When going from x = 6 to x = 7, the transitions B, D, E shift
slightly to lower energies and the transitions A, F, G move up to higher
energies, whereas the energy of the transition C remains unchanged. By
analyzing the crystal field parameters on the basis of equation (6.18) it could
be shown that the observed shifts of the crystal field transitions are due to
both structural changes and charge transfer effects [51]. In particular, it was
found that a charge of 0.07 |e|/O is transferred into the planes when going
292
6.6 Crystal Field Effects Related
from x = 6 to x = 7, which means that about 28% of the created holes go into
the planes. Similar conclusions have been obtained for the related compound
HoBa
2
Cu
3
O
x
[67]. These results show an almost linear dependence of the
charge transferred as a function of x. This is in agreement with the results of
neutron diffraction experiments on ErBa
2
Cu
3
O
x
which give evidence for a
linear decrease of the c-axis upon hole doping [68], but it is in contrast to the
conclusions of bond valence sum arguments derived in similar experiments on
YBa
2
Cu
3
O
x
where the two-plateau structure of T
c
has been suggested to be
due to the nonlinearity of the hole transfer into the planes [66].
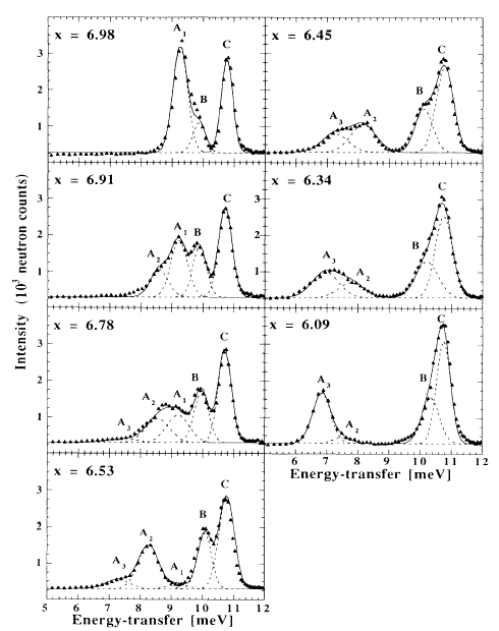
Figure 6.21 displays the low-energy part of the energy spectra of
ErBa
2
Cu
3
O
x
upon increased resolution conditions [69], which show that the
lowest crystal field transition A is actually built up of three different
components, A
1
, A
2
, and A
3
, whose main characteristics can be summarized
as follows:
(i) Intensities: The individual components A
i
have maximum weight close to
x = 7.0, x = 6.5, and x = 6.0, respectively. With the crystal field
interaction being a local probe, there is no doubt that these substructures
originate from different local environments of the Er
3+
ions which
obviously coexist in the compound ErBa
2
Cu
3
O
x
.
(ii) Energies: Whereas all the crystal field transitions are independent of
energy for oxygen content x 6.5 within experimental error, they shift
slightly when going from x § 6.5 to x § 6.0. This may be due to the
structural discontinuities at the orthorhombic to tetragonal phase
transition at x § 6.4.
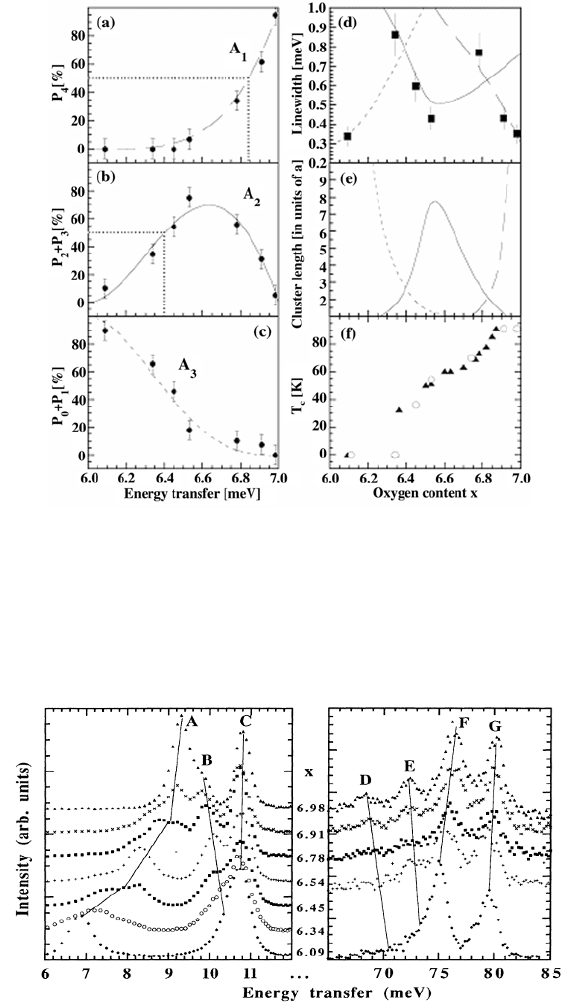
(iii) Linewidth: As visualized in Figure 6.19d, the intrinsic linewidths of the
transitions A
i
are much smaller for oxygen contents where these
transitions individually reach their maximum weight, namely for x § 6.0,
6.5, and 7.0.
All these facts and their interpretation provide clear experimental evidence
for cluster formation. It is tempting to identify the three clusters associated
with the transitions A
1
, A
2
, and A
3
by two local regions of metallic (T
c
§ 90 K,
T
c
§ 60 K) and a local region of semiconducting character, respectively [69].
Figures 19a,b,c show the fractional proportions of the three cluster types that
exhibit a continuous behavior versus oxygen content x, consistent with the
earlier conclusion that the transfer of holes into the CuO
2
planes is linearly
related to the oxygenation process [51]. Furthermore, the continuous increase
of the metallic states A
1
and A
2
can explain the increase of the
superconducting volume fraction as observed by magnetic susceptibility
measurements [68] when the oxygen content is raised from x = 6 to x = 7. It
should be mentioned that these results have been nicely confirmed by PSR
experiments [70] showing the coexistence of superconductivity and
antiferromagnetism at low doping.
,
293
6. Crystal Field Spectroscopy
Figure 6.19 (a,b,c) Proportions (expressed as a percentage) of the lowest-lying crystal field
transitions A
i
of ErBa
2
Cu
3
O
x
as a function of the oxygen content x. The full, dashed, and broken
lines refer to geometrical probability functions as explained in the text. The dotted lines mark
the critical concentration for bond percolation. d) Intrinsic linewidths of the crystal field
transitions A
i
at T=10 K. e) Mean cluster length versus oxygen content x determined by a
Monte Carlo simulation [75]. f) Superconducting transition temperature T
c
versus oxygen
content x for ErBa
2
Cu
3
O
x
(after [50]).
Figure 6.20 Energy spectra of neutrons scattered from ErBa
2
Cu
3
O
x
at T=10 K. The lines
indicate the x dependence of the observed crystal field transitions (after [51]).
294
6.6 Crystal Field Effects Related
Figure 6.21 Energy spectra of neutrons scattered from ErBa
2
Cu
3
O
x
at T = 10 K. The full lines
are the result of a least squares fitting procedure. The broken lines indicate the subdivision into
individual crystal field transitions (after [69]).
Our current understanding of the superconducting properties of
ErBa
2
Cu
3
O
x
(and more generally all the RBa
2
Cu
3
O
x
compounds) involves a
percolation mechanism of electric conductivity as discussed in both
theoretical [71] and experimental [72] work. For x = 6 the system is a perfect
semiconductor. When adding oxygen ions into the chains, holes are
continuously transferred into the CuO
2
planes. By this mechanism the number
of local regions with metallic character (associated with the crystal field
transition A
2
) rises, which can partially combine to form larger regions. For
some critical concentration a percolative network is built up, and the system
undergoes a transition from the semiconducting to the conducting state (with
T
c
§ 60 K). Upon further increasing of hole concentration a second (different)
type of metallic cluster (associated with the crystal field transition A
1
) is
formed, which start to attach to each other and induce a transition into another
conducting state (with T
c
§ 90 K) at the percolation limit.
For a two-dimensional square structure the critical concentration for bond
percolation is p
c
= 50% [73]. From the fractional proportions of A
2
and A
1
295
6. Crystal Field Spectroscopy
displayed in Figures 6.19a,b,c we can then immediately determine the critical
oxygen concentrations for the transitions from the semiconducting to the
T
c
§ 60 K superconducting state and to the T
c
§ 90 K superconducting state to
be x
2
= 6.40 and x
1
= 6.84, respectively, which is in excellent agreement with
the observed two-plateau structure of T
c
(see Figures 6.19a,b,f). For three-
dimensional structures, on the other hand, the critical concentration for bond
percolation is 20% (face-centered cubic) < p
c
< 30% (simple cubic) [73],
resulting in 6.21 < x
2
< 6.31 and 6.64 < x
1
< 6.73, which is inconsistent with
the observed two-plateau structure of T
c
. This reinforces the well known fact
that the superconductivity in the perovskite-type compounds has indeed a
two-dimensional character.
Combined statistical and geometrical considerations may be useful to
understand the x-dependent profiles of the fractional proportions of the three
cluster types visualized in Figures 19a,b,c. A local symmetry model [74] was
developed that defines specific probabilities P
k
(y) to have, for a given oxygen
content x = 6 + y, k of the four oxygen chain sites (0,1/2,0), (1,1/2,0),
(0,1/2,1), and (1,1/2,1) nearest to the R
3+
ion occupied:
P
k
(y)
4
k
§
©
¨
·
¹
¸
y
k
(1 y)
4k
, 0d k d 4 .
(6.65)
The fractional proportion of the cluster type A
1
exhibits the behavior
predicted by the probability function P
4
(y) (i.e., all the oxygen chain sites
being occupied). Similarly, the fractional proportions of the cluster types A
2
and A
3
follow the sum of the probability functions P
3
(y) + P
2
(y) (i.e., one or
two empty oxygen chain sites) and P
1
(y) + P
0
(y) (i.e., one or no oxygen chain
site occupied), respectively. The above probability functions are shown in
Figures 6.19a,b,c by lines which excellently reproduce the experimental data.
The x-dependent linewidth of the crystal field transitions allows one to
estimate the size of the clusters, since a line broadening is due to structural
inhomogeneities and gradients in the charge distribution, which occur
predominantly at the border lines between different cluster types. For a cluster
of mean length L (in units of the lattice parameter a) in the (a,b)-plane the
fraction of unit cells at the border of the cluster and inside the cluster is
4(L–1)/L
2
and [(L – 2)/L]
2
, respectively. In a first approximation the total
linewidth is then given by [75]
*
1
L
(L 2)
2
*
0
2
4(L 1)
'E
2
§
©
¨
·
¹
¸
2
*
0
2
ª
¬
«
«
º
¼
»
»
,
(6.66)
where *
0
is the intrinsic linewidth for infinite cluster size (i.e., for x = 6 and
x = 7 exactly realized), and 'E corresponds to the energetic separation of the
crystal field transitions A
i
for two coexisting cluster types. More specifically,
from Figure 6.21 we derive 'E = E(A
1
) – E(A
2
) § 1.0 meV and 'E = E(A
2
) –
296