Vij D.R. Handbook of Applied Solid State Spectroscopy
Подождите немного. Документ загружается.

6.3 Experimental Techniques
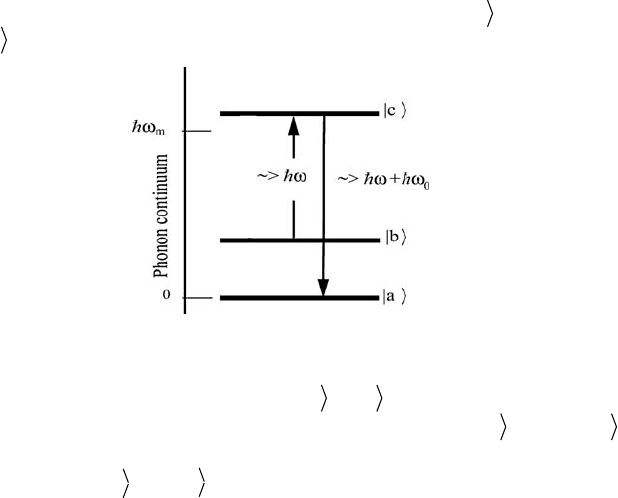
when the photon causes an induced transition from state | b to an excited
state
| c whose energy is higher than the Debye energy k
BTD. This excitation
Figure 6.6 A schematic diagram for the anti-Stokes Raman process.
is followed by a second virtual transition | c o| a , as indicated in Figure 6.6.
This gives an indirect two-stage transfer of an ion from state
| b to state | a ,
which could become an important relaxation process if the direct process
between the states
| a and | b is negligible.
Raman processes are governed by two conservation laws as in neutron
spectroscopy (see equations (6.37) and (6.38)): energy conservation and
momentum conservation, i.e., the energy and momentum of the scattered
radiation and the elementary excitation created (absorbed) in the interaction
process equals the energy and momentum of the exciting photon. As the
photon wavevector is about 10
3
times smaller than a typical reciprocal lattice
vector, only excitations at the center of the Brillouin zone are observed by
Raman scattering.
The Raman spectroscopy obeys characteristic selection rules, which reflect
the symmetry properties of the elementary excitations. Crystal field excita-
tions are forbidden if the rare earth ions occupy a center of inversion. This
explains the difficulties of detecting crystal field excitations in hole-doped,
high-temperature superconductors of type RBa
2
Cu
3
O
7–x
. On the other hand,
this drawback does not exist for electron-doped, high-temperature
superconductors as reported, e.g., for Raman spectroscopy studies carried out
for the compounds R
2
CuO
4
(R = Pr, Nd, Sm) [28, 29] and R
2 – x
Ce
x
CuO
4
[40].
Other interesting examples are the elpasolites Cs
2
NaRX
6
(R = rare earth;
X = Cl, Br), which will be highlighted in Section 6.4.1. For Cs
2
NaTbCl
6
a
most comprehensive data set was collected with a total of 125 levels, which
include states originating from 10 of the 17 terms and 36 of the 87 multiplets
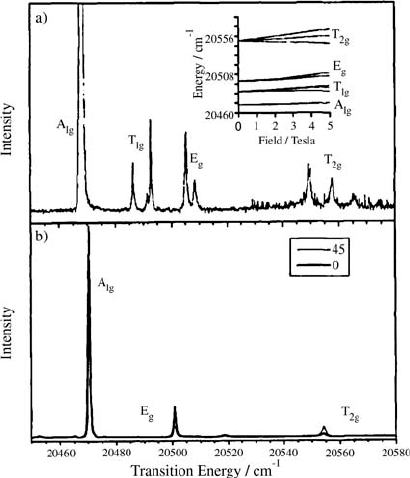
[41]. Figure 6.7 displays transitions in the
5
D
4
-multiplet obtained by
luminescence spectroscopy, emphasizing the ability to resolve Zeeman
splittings as well as the effect of linear polarizations.
277
6. Crystal Field Spectroscopy
Figure 6.7 Two-photon excitation spectra of a single crystal of Cs
2
NaTbC1
6
, at ~ 6 K (a) in the
presence of a 4.5 T field along [110] and (b) in zero-field but in two linear polarizations making
the angle indicated to [001]. The inset shows the experimental field dependence of the Zeeman
energies (after [41]).
The calculation of intensities of the observed Raman-active crystal field
transitions is a nontrivial task. This is in contrast to neutron spectroscopy
where the intensities of crystal field transitions are directly proportional to the
square of the magnetic dipole matrix elements (see equations (6.53) and
(6.54)). Since Raman scattering is always at least a two-step process, it
involves intermediate states that are often not known, thus approximate
models have to be employed for the calculation of transition matrix elements
[42]. On the other hand, as a laser is usually used for Raman experiments, the
specific polarization of the exciting source can be exploited to obtain extra
information from the spectra as exemplified in [28].
6.3.4 Point-Contact Spectroscopy
Electrical point-contact spectroscopy (PCS) is a technique to study the
interaction mechanism of electrons with all kinds of elementary excitations in
metals. Small constrictions between two metals show deviations from the
linearity governed by Ohm’s law. The nonlinearity is a measure of the
inelastic scattering of the conduction electrons, where the applied voltage
defines the energy scale for the interaction process. Yanson [43] discovered
these nonlinearities in the I–V characteristics of microcontacts between metals
278
6.3 Experimental Techniques
and used them for a direct microscopic measurement of the energy
dependence of the interaction between conduction electrons and quasiparticle
excitations such as phonons, magnons, paramagnetic impurities, crystal field
excitations, and so on. For the ballistic electron transport (i.e., both the
inelastic and the elastic mean free paths are larger than the contact size) the
second derivative d
2
V/dI
2
of the voltage with respect to the current turns out
to be proportional to the spectral function of the interaction process. For
instance, in the case of the electron-phonon interaction, the spectral function is
the well known Eliashberg function D
2
F [44]. In case of crystal field
interactions the point-contact spectra show additional maxima associated with
the allowed crystal field transitions.
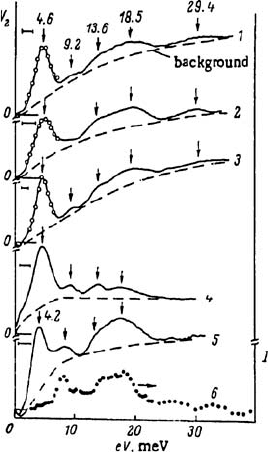
As an example we quote the splitting of the Pr
3+
ions which were directly
observed in the hexagonal van Vleck paramagnet PrNi
5
[45]. Figure 6.8
displays the corresponding PCS spectra, which exhibit several maxima and
kinks marked by arrows, however, only the peaks at 4.6, 13.6, and 29.4 meV
can be associated with crystal field transitions (see [46] and Section 6.5.1),
whereas the peaks at 9.2 and 18.5 meV are due to electron-phonon interaction.
The PCS was subsequently used to measure the Zeeman splitting of the crystal
field excitations in external magnetic fields up to 20 T for the same compound
[47].
Figure 6.8 Microcontact PrNi
5
spectra (after [45]).
Nowadays the PCS has become a standard technique for the study of the
electron-phonon interaction in conductors (for a review see [48]), but at
present it seems to be limited to simple metals and intermetallic compounds.
279
6. Crystal Field Spectroscopy
The limitation of the PCS as a spectroscopic tool is due to the fact that the
contact diameter has to be smaller than the inelastic electron mean free path,
which is hardly fulfilled in most of the strongly correlated electron systems, so
that the data analysis becomes ambiguous and complicated. Moreover, the
PCS technique cannot discriminate a priori between crystal field and electron-
phonon interactions, i.e., a proper identification of the observed PCS spectra
strongly relies on the availability of other spectroscopic data.
6.4 DETERMINATION OF CRYSTAL FIELD
PARAMETERS FROM EXPERIMENTAL DATA
In this section we present a simple crystal field problem in order to exemplify
the way in which the crystal field parameters can be determined from
spectroscopic data. We choose the insulating compound series Cs
2
NaRBr
6
(R = rare earth) called (bromo-)elpasolites, which were investigated by
several experimental techniques, so that we can compare the results and
thereby obtain information about the performance of the different
experimental methods.
The crystal field is the dominant interaction for the rare earth elpasolites,
since no magnetic ordering is observed down to the lowest temperatures, thus
exchange effects can be neglected. Moreover, the elpasolites have a cubic
crystal structure with the R
3+
ions situated at the sites of octahedral symmetry,
i.e., each R
3+
ion is hexacoordinated by six nearest Br
–
ions. Thus the crystal
field problem is rather simple with only two independent crystal field
parameters (see equation (6.9)).
Figures 6.9 and 6.10 show the results of neutron spectroscopic
investigations for Cs
2
NaErBr
6
(J
Er
=
15
/
2
) [25]. The cubic crystal field splits the
16-fold degenerate ground state
4
I
15/2
-multiplet of the Er
3+
ion into two
doublets
*
6
and *
7
and three quartets *
8
(1)
, *
8
(2)
,
and
*
8
(3)
. The low-
temperature spectra of Figure 6.9 give evidence for two inelastic lines A and
B at 3.0 and 5.8 meV, respectively, that can be attributed to crystal field
transitions out of the ground state. Upon raising the temperature the intensity
of line B decreases as expected (because of the decreasing Boltzmann
population factor), whereas the intensity of line A increases slightly because
of an excited crystal field transition that occurs accidentally at the same
energy. For Er
3+
the higher lying crystal field states usually have very small
matrix elements for transitions out of the ground state, thus their energies can
be determined only in connection with excited-state transitions. This is
demonstrated in Figure 6.10 by lines C and D at 21 and 25 meV, respectively,
whose intensities clearly increase with increasing temperature.
6.4.1 A Simple Two-Parameter Crystal Field Problem
280
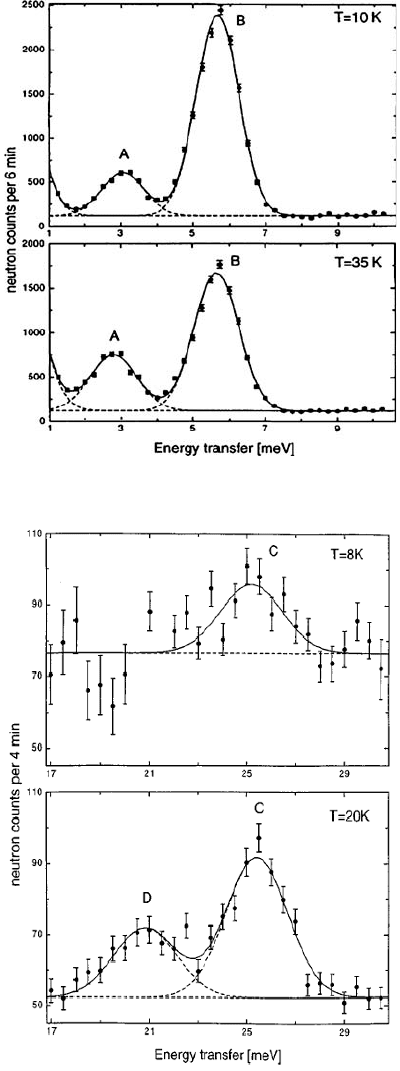
Figure 6.9 Low-energy spectra of neutrons scattered from Cs
2
NaErBr
6
observed with use of a
triple-axis spectrometer. The analyzer energy and the modulus of the scattering vector were set
to E
A
=13.7 meV and Q =1.25 Å
-1
, respectively (after [25]).
Figure 6.10 Medium-energy spectra of neutrons scattered from Cs
2
NaErBr
6
with E
A
=13.7 meV
and Q = 2.4 Å
-1
(after [25]).
281
6.4 Determination of Crystal Field Parameters
6. Crystal Field Spectroscopy
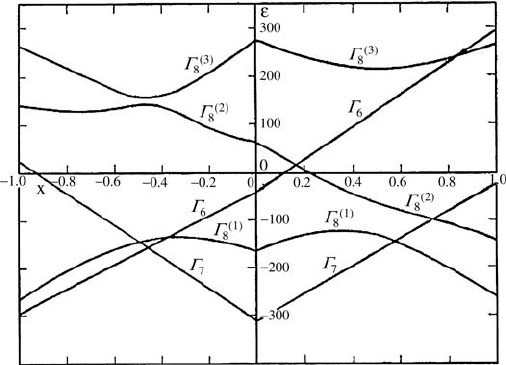
These experiments tell us immediately that the crystal field splitting
crystal field states by their correct representations, an inspection of the energy
level sequence in terms of the parameters W and x (see equation (6.10)) is
most useful. Figure 6.11 offers at least two sets of parameters that are
compatible with the spectroscopic data, namely x § –0.6 with a
*
6
ground
state and x § 0.65 with a
)1(
8
* ground state, both with W > 0. This means that a
unique identification of the crystal field states is not possible by consideration
of the energy splittings alone. In addition, we have to consider the intensities
of the observed crystal field transitions (as tabulated in [38]), which in the
present case unambiguously favor the parameter set {x § 0.65, W > 0}. By
doing this, we can completely reconstruct the crystal field level scheme of
Cs
2
NaErBr
6
from the spectroscopic data (see Figure 6.12). The resulting
crystal field parameters, mainly determined from neutron (N) and optical (O)
spectro-scopic measurements, which are presently available for the rare earth
bromo-elpasolites, are listed in Table 6.1. The agreement between N and O is
rather good for R = Ho, R = Tm, and R = Yb, with a maximum deviation of
0.5 meV for all crystal field levels (which can readily be calculated from
equation (6.9)). For R = Pr there is a discrepancy for the highest crystal field
5
whereas an energy of 77 meV was derived from the luminescence spectrum.
The discrepancies for R = Tb can be explained by the fact that neutron
spectroscopy was able to establish only the low-energy part of the crystal field
level structure.
Figure 6.11 Eigenvalues of Eq. (10) (after [12]) for Er
3+
.
level * , which is located at 55 meV in the neutron-scattering experiments,
comprises three low-lying states in the energy range 0 <
Z < 6 meV,
=
separated from two high-lying states at Z > 20 meV. In order to identify the
=
282
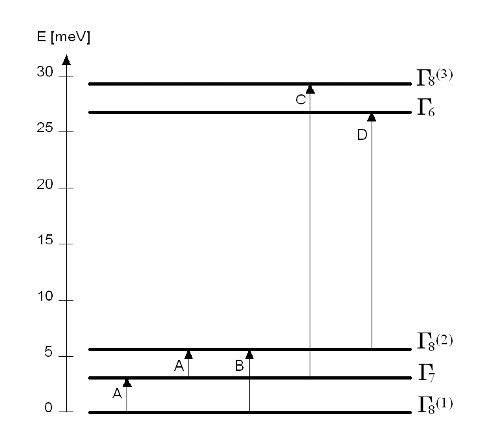
Figure 6.12 Crystal field level scheme of Cs
2
NaErBr
6
. The arrows and corresponding labels
denote the transitions observed by neutron spectroscopy.
We may conclude that both N and O spectroscopies have their merits for
the determination of crystal field splittings in the ground state J-multiplet of
rare earth compounds; however, the correct identification of the observed
crystal field states is more reliable in neutron spectroscopic experiments, since
no approximations have to be applied to calculate the transition matrix
elements. On the other hand, optical spectroscopies have distinct advantages
for measurements of intermultiplet crystal field excitations. Finally, the data
for R = Yb show that a reliable determination of crystal field parameters from
thermodynamic magnetic data is usually not possible.
The crystal field parameters listed in Table 6.1 are found to follow nicely
the extrapolation scheme of equation (6.32). However, there is a slight
increase of the parameters from the light to the heavy rare earth ions. This was
explained in terms of dipolar polarizability and covalency [49], which seem to
have an increased relative importance for the heavy rare earth compounds.
In this section we exemplify the crystal field procedure for a metallic
compound with low symmetry at the rare earth site, for which the use of
neutron spectroscopy is indispensable. This is particularly true for the rare
earth-based high-temperature superconductors for which early attempts to
unravel and to parametrize the crystal field interaction by other techniques
failed completely. We choose as an example the compound ErBa
2
Cu
3
O
7
6.4.2 A Complicated Many-Parameter Crystal Field Problem
283
6.4 Determination of Crystal Field Parameters

6. Crystal Field Spectroscopy
Table 6.1 Crystal field parameters and of the elpasolites Cs
2
NaRBr
6
determined by
different experimental techniques (N: neutron spectroscopy; O: optical spectroscopies; M:
magnetic susceptibility).
(J
Er
=
15
/
2
) which has orthorhombic symmetry at the Er
3+
site, i.e., the crystal
field Hamiltonian is defined by equation (6.12) with nine independent
parameters. The crystal field splits the 16-fold degenerate ground state
4
I
multiplet of Er
3+
into eight Kramers doublets. All seven crystal field
transitions out of the ground state have been observed by neutron
spectroscopy as shown in Figure 6.13 [50, 51], thus the crystal field level
splitting is completely established. Yet the crystal field states have to be
characterized by their proper representations, which is a highly nontrivial task
in view of the large number of adjustable crystal field parameters. This is due
to the difficult problem of any nonlinear least squares fitting procedure of
choosing reasonable start values of the fitting parameters, which, however,
can be achieved as described below.
0
4
B
0
6
B
R
0
4
B (meV)
0
6
B (meV)
Technique Ref.
Ce 0.162 ± 0.002 0 N A
P
r
(
–
1.32 ± 0.06
)
·10
(
1.39 ± 0.13
)
·10 N A
(–1.93 ± 0.10)·10 (1.20 ± 0.29)·10 O B
N
d
(
–
7.6 ± 0.2
)
·10
(
–
7.2 ± 0.3
)
·10 N A
Tb
(
2.1 ± 0.2
)
·10
(
–
1.5 ± 0.4
)
·10 N A
(2.96 ± 0.05)·10 (–1.35 ± 0.17)·10 O C
D
y
(
–
1.3 ± 0.1
)
·10
(
1.5 ± 0.3
)
·10 N A
Ho
(
–
6.2 ± 0.5
)
·10
(
–
1.4 ± 0.2
)
·10 N A
(–6.56 ± 0.08)·10 (–1.58 ± 0.10)·10 O B
E
r
(
8.1 ± 0.3
)
·10
(
1.8 ± 0.1
)
·10 N A
Tm
(
3.0 ± 0.4
)
·10
(
–
4.2 ± 0.8
)
·10 N A
(3.32 ± 0.18)·10 (–4.06 ± 2.18)·10 O B
Yb
(
–
3.1 ± 0.1
)
·10
(
1.1 ± 0.3
)
·10 N A
(–3.53 ± 0.31)·10 0 O B
–2.13·10 1.38·10
4
M D
A: Furrer A and Güdel H U 1997 Phys. Rev. B 56 15062–72
B: Tanner P A, Ravi Kanth Kumar V V, Jayasankar C K, and Reid M F 1994 J. Alloys Compd. 215 349–70
C: Berry A J, McCaw C S, Morrison I D, and Denning R G 1996 J. Lumin. 66 & 67 272–7
D: Urland W 1979 Z. Naturforsch. 34a 1507–11
15/2
-
4
–
4
–
4
–
–
4
–
4
–
4
–
–2
–2
–2
–2
–3
–3
–3
–3
–3
–3
–3
–5
–6
–6
–6
–6
–6
–6
–6
–6
284
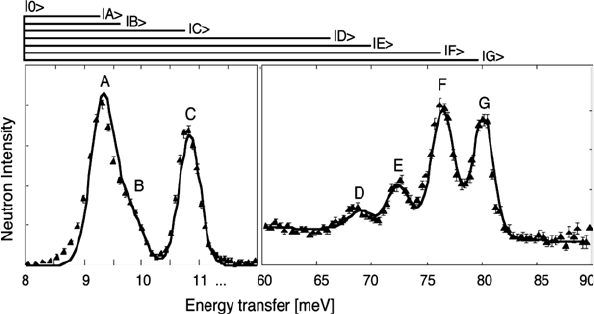
Figure 6.13 Energy spectra of neutrons scattered from ErBa
2
Cu
3
O
7
at T=10 K. The lines
represent the calculated spectra. The arrows on top of the figure denote the observed ground
state transitions (after [50]).
The coordination polyhedra of Er
3+
in ErBa
2
Cu
3
O
7
formed by the nearest
neighbors (eight oxygen ions) as well as by the next-nearest neighbors (eight
copper ions) are slightly distorted cubes. Thus we expect the overall features
of the crystal field potential to be reasonably described in a first
approximation by cubic point symmetry, which limits the number of
disposable parameters to two as for Cs
2
NaErBr
6
discussed in the preceding
section. Now we make use of the fact that the crystal field transitions occur in
a low-energy window (
KZ
< 12 meV, lines A–C) and in a high-energy
window (65 <
KZ
< 82 meV, lines D–G), i.e., the crystal field splitting is
characterized by four low-lying doublets and four doublets at much higher
energies. Inspection of Figure 6.11 tells us that this particular situation can
only be realized for the parameter x § –0.45 with either W > 0 or W < 0 (note
that in cubic symmetry six doublets merge into three quartets). When
considering the intensities, the parameter set with W < 0 has to be discarded,
thus the set {x § –0.45, W > 0} gives us a good estimate of the dominant
crystal field parameters
B
4
0
and B
6
0
. In a second step we make use of equation
(6.30) in order to arrive at reasonable values for the remaining
“orthorhombic” crystal field parameters. After having determined
reasonable start values of the crystal field parameters as outlined above, a
least squares fitting procedure is then applied to the observed energy spectra,
which usually converges successfully to a final, appropriate set of crystal field
parameters (see [51]).
Another useful scheme to predict crystal field parameters in metallic
systems is based on the extended point-charge model (see Section 6.2.2.2). As
shown by Mesot and Furrer [52], the crystal field parameters of ErBa
2
Cu
3
O
7
calculated from equation (6.24), with the inverse screening length adjusted to
N = 1.25 Å
–1
, provide values very close to the fitted ones.
285
6.4 Determination of Crystal Field Parameters
6. Crystal Field Spectroscopy
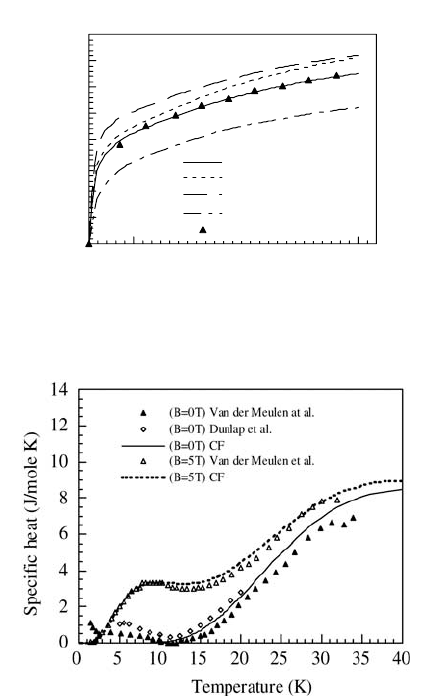
In order to check the reliability of the derived crystal field parameters it is
important to calculate various thermodynamic properties with the help of
equations (6.33)–(6.34) and to compare the results with experimental data.
Figures 6.14 and 6.15 [51] show the good agreement between high-field
magnetization [53] and specific heat [54, 55] measurements of powder
samples and calculations using the crystal field parameters determined by
neutron spectroscopy [51]. Moreover, the crystal field interaction reduces the
zero-field moment of Er
3+
in ErBa
2
Cu
3
O
7
drastically below the free ion value
of 9 P
B
. A mean-field calculation based on equation (6.33) yields 4.2 P
B
, in
agreement with the value derived from Mössbauer experiments [56].
0
1
2
3
4
5
6
7
8
0 5 10 15 20 25 30
<M>=1/3(M
x
+M
y
+M
z
)
M
y
- CF
M
x
- CF
M
z
- CF
<M>- Roeland et al.
B [Tesla]
M [µ
B
]
Figure 6.14 High-field magnetization observed and calculated for ErBa
2
Cu
3
O
7
(after [51]).
Figure 6.15 Schottky anomaly of the heat capacity observed and calculated for ErBa
2
Cu
3
O
7
(after [51]).
286