Vij D.R. Handbook of Applied Solid State Spectroscopy
Подождите немного. Документ загружается.

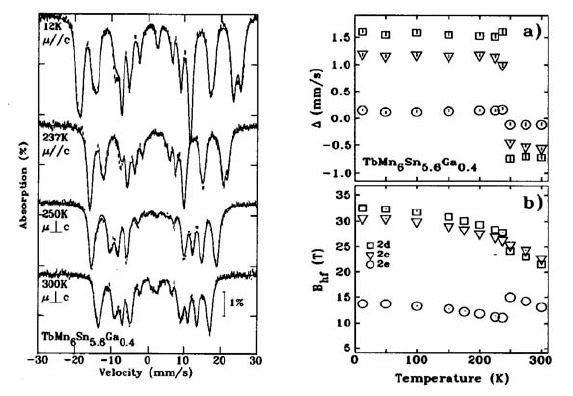
5.3.2 Magnetic Reorientations
As explained in Section 5.1, the Mössbauer spectrum in the presence of both
magnetic and quadrupole effect depends critically on the angle between the
quantization axes of the respective Hamiltonians, thereby allowing one to
investigate reorientations of the magnetic structures. The
119
Sn spectra of the
hexagonal intermetallic compound TbMn
6
Sn
5.6
Ga
0.4
, obtained over
the temperature range 12 K to 300 K and shown in Figure 5.19 [37], illustrate
clearly the effect of magnetic reorientation. At low temperatures the easy
direction of magnetization is along the hexagonal c-axis. This compound
undergoes a spin-reorientation to the hexagonal basal plane at 244 K. An axis
(T = 0°) to plane (T = 90°) reorientation leads to a change in the measured
spectroscopy. The temperature dependences of the hyperfine fields and
quadrupole splittings of the three Sn sites in this structure are also shown in
Figure 5.19. At each site we see the expected change in quadrupole splitting.
The hyperfine field “seen” by the
119
Sn nuclei is a transferred field from its
magnetic neighbors (Sn is nonmagnetic) and clear changes occur at the spin-
reorientation transition, which are related to orbital magnetism effects.
Figure 5.19 Left ––
119
6
5.6
. Right –– Temperature
dependences of the hyperfine field and the quadrupole splitting at each of the Sn sites [37].
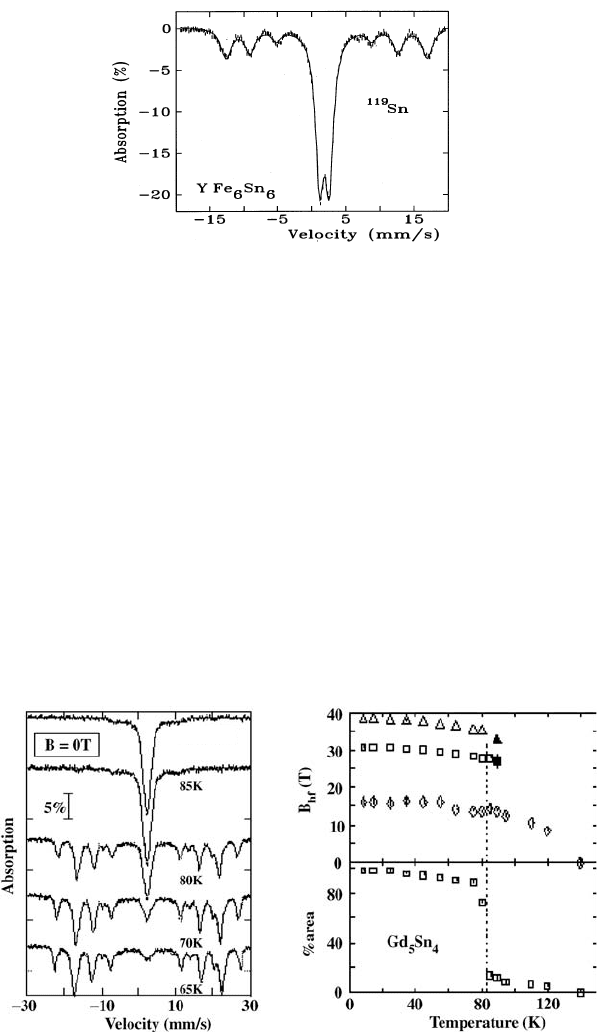
Continuing this theme of transferred hyperfine fields, in Figure 5.20 we
show the
119
Sn RT spectrum of the intermetallic compound YFe
6
Sn
6
.
There are eight Sn crystallographic sites in this orthorhombic structure and
the spectrum shows that 1/3 of the Sn nuclei experience quite a large
hyperfine field of 24.6 T, transferred from the surrounding magnetic Fe sites,
5.3 Applications 237
quadrupole splitting by a factor of –1/2, easily observed by Mössbauer
4
Sn spectra of hexagonal TbMn Sn Ga
0
.
5. Mössbauer Spectroscopy
while the remaining 2/3 experience no field. This finding provided
confirmation of the suggested antiferromagnetic structure of the Fe sublattice
in YFe
6
Sn
6
, deduced by neutron diffraction [38].
Figure 5.20
119
Sn spectrum (RT) of YFe
6
Sn
6
[38].
The temperature dependences of the hyperfine parameters can also be used
to great effect to study the nature of magnetic transitions, including the
ordering transition. In Figure 5.21 we show a series of
119
Sn spectra of the
intermetallic compound Gd
5
Sn
4
obtained at various temperatures [39]. We
also show the temperature dependences of the
119
Sn hyperfine magnetic field
and the relative fraction of the magnetic component subspectra. This
compound, and related compounds, are currently of interest due to their “giant
magnetocaloric” behavior, which opens up the possibility of future
applications as refrigerant materials [40]. The
119
Sn spectra clearly
demonstrate the first-order magnetic ordering at 82 K, in addition to magnetic
inhomogeneity over a wide range of temperature.
Figure 5.21
119
Sn spectra of Gd
5
Sn
4
together with the temperature dependences of the
hyperfine field and the quadrupole splittings at the three Sn sites [39].
238
T=90K
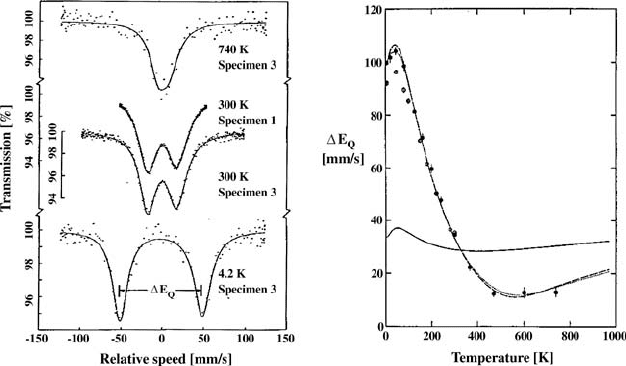
5.3.3 Crystal Fields
We have already mentioned the use of Mössbauer spectroscopy to study
crystal-field effects. The form of the crystal-field Hamiltonian of a rare earth
ion in a compound is determined by the point-symmetry at the rare earth
crystallographic site. Thus, a study of the temperature-dependences of
hyperfine parameters, not only allows one to deduce crystal-field parameters
but can also distinguish clearly between different crystallographic models. To
illustrate this, in Figure 5.22 we show
169
Tm spectra of Tm
2
Ge
2
O
7
[41]. This
structure had been suggested to exhibit five-fold crystal symmetry, forbidden
in extended crystal structures [42]. The
169
Tm spectra allowed us to test this
claim by measuring the electric quadrupole splitting at the
169
Tm nucleus and
analyzing these data with a model for the crystal field at the parent Tm
3+
site.
Our crystal field fit to the quadrupole splitting clearly shows that the proposed
5-fold symmetry is incorrect and the site symmetry is in fact triclinic.
Figure 5.22 Left ––
169
Tm spectra of Tm
2
Ge
2
O
7
. Right –– temperature dependence of the
169
Tm
quadrupole splitting, with a triclinic crystal-field fit. Also shown is the temperature-dependence
predicted by the 5-fold symmetry model [41].
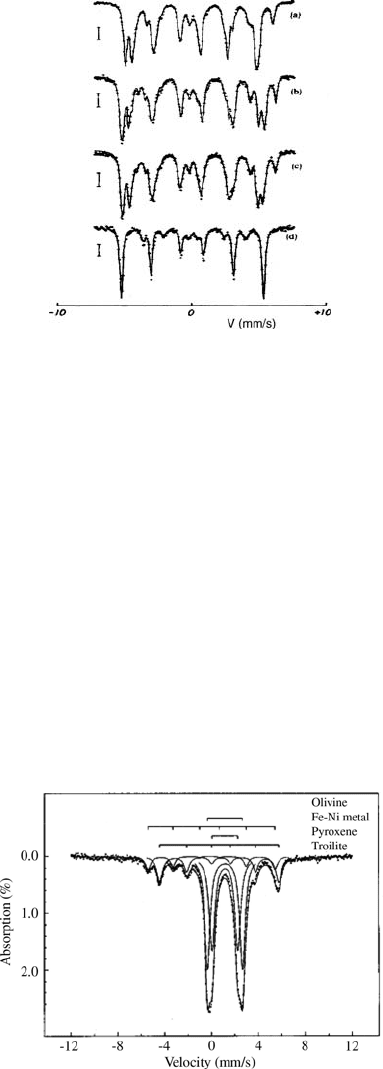
5.3.4 Phase Analysis
Mössbauer spectroscopy is well suited to the problem of phase analysis, in
particular in Fe-bearing materials. Not only can individual phases present in a
sample be identified, but a quantitative analysis can often be achieved,
keeping in mind the caveat related to the recoil-free fractions of the individual
phases, mentioned in Section 5.1. As an example of the use of
57
Fe Mössbauer
spectroscopy for phase analysis, in Figure 5.23 we show a series of RT
57
Fe
spectra of Nd-Fe-B, with the commercial composition Nd
15
Fe
77
B
8
, after
various stages in the HDDR process (hydrogen disproportionation desorption
5.3 Applications 239
5. Mössbauer Spectroscopy
recombination) used in the preparation of permanent-magnet materials.
Heating the starting Nd-Fe-B material to about 200°C in hydrogen gas leads
to absorption, with a resulting slight increase in magnetic ordering
temperature. Further heating to above 700°C leads to the complete
disproportionation of the Nd
2
Fe
14
B phase into D-Fe, Fe
2
B, and NdH
2
(identified by X-ray diffraction) [43]. The presence of D-Fe completely
dominates the disproportionated spectrum.
Figure 5.23 RT
57
Fe Mössbauer spectra of Nd
15
Fe
77
B
8
in the virgin, unhydrogenated state
(spectrum (a)) and following hydrogenation up to (b) 320°C, (c) 650°C and (d) 1000°C [43].
As an example of quantitative phase analysis, we show in Figure 5.24 the
RT spectrum of the Allegan meteorite which was found in Allegan County,
Michigan, US [44]. Four distinct Fe-bearing phases are observed (Olivine
38.9 r 1.0 area-%, Pyroxene 34.1 r 0.8 area-%, Troilite 20.3 r 1.3 area-%,
and Fe-Ni metal 7.0 r 2.4 area-%).
Figure 5.24 RT
57
Fe spectrum of the Allegan meteorite with the individual spectral components
identified [44].
240
5.3.5 Amorphous Materials
As mentioned in Section 5.1, the Mössbauer spectra of amorphous materials
are broad due to the distribution of hyperfine parameters such as hyperfine
magnetic field or quadrupole splitting. A typical hyperfine field distribution
fit involves 15–30 subspectral components and the shape of the fitted
distribution depends on numerous factors, not only related to the actual
sample. However, the average field of such a distribution is fairly robust.
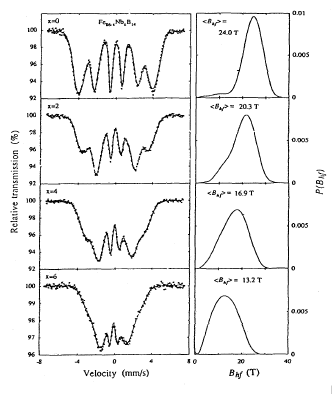
In Figure 5.25 we show a series of room temperature Mössbauer spectra of
amorphous Fe
86-x
Nb
x
B
14
ribbons, prepared by the melt-spinning technique
[45]. These materials are precursors for the preparation, by controlled
crystallization, of soft-magnetic materials similar to the FINEMET alloys.
These spectra are broad (refer to the crystalline D-Fe spectrum in Figure 5.4)
and their respective hyperfine field distributions clearly show the effect of the
increasing Nb content in reducing the Curie temperature and hence the
average hyperfine field.
Figure 5.25 RT
57
Fe spectra of amorphous Fe
86-x
Nb
x
B
14
ribbons [45].
The preceding set of room temperature spectra showed the effect of
Fe
92
Zr
8
by obtaining a series of spectra at various temperatures above room
temperature [46] (see Figure 5.26). The hyperfine field distributions shown in
temperature dependences are analyzed in terms of a modified Brillouin
function, taking into account the effects of the distribution of environments in
the amorphous state, which manifest themselves as a distribution of the
magnetic exchange [47].
5.3 Applications 241
have also followed the collapse of the magnetic spectrum of amorphous
Figure 5.26 provide a dramatic representation of this collapse. Often, such
reducing the Curie temperature in a series of Fe-Nb-B amorphous alloys. We
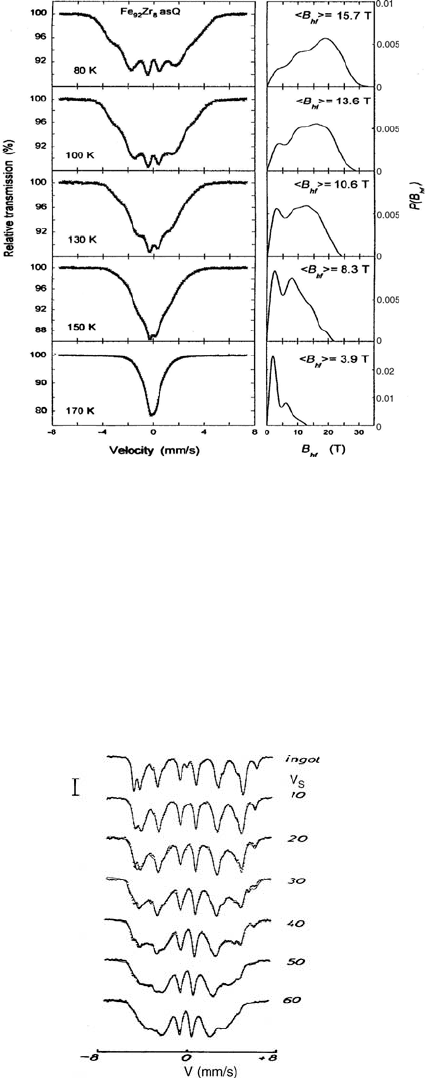
5. Mössbauer Spectroscopy
Figure 5.26
57
Fe spectra of amorphous Fe
92
Zr
8
ribbons over the temperature range 80 K to
170 K [46].
It is clear the
57
Fe Mössbauer spectroscopy is ideally suited to the
comparative study of crystalline and amorphous materials and mixtures of the
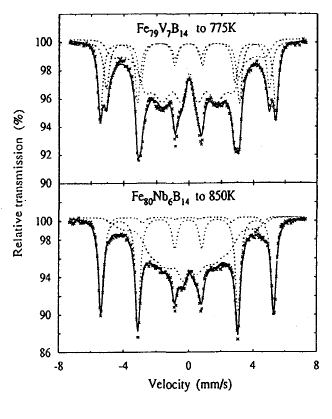
two. In Figure 5.27 we show a series of room temperature Mössbauer spectra
of the permanent-magnet material Nd-Fe-B, as previously illustrated in
Figure 5.23 [48]. Here, we prepared a series of samples by melt-spinning at
various wheel speeds, and hence quench rates, and the transition from
crystalline through microcrystalline to amorphous with increasing quench rate
is clearly reflected in the broadening of the spectrum.
Figure 5.27
57
Fe spectra of Nd-Fe-B prepared at various melt-spinning wheel speeds V
S
(m/s)
[48].
242
To illustrate the quantitative fitting of spectra comprising both broad
amorphous and sharper nano-crystalline components, we show in Figure 5.28
the room temperature Mössbauer spectra of (i) Fe
79
V
7
B
14
and (ii) Fe
80
Nb
6
B
14
ribbons, prepared fully amorphous by the melt-spinning technique and
subsequently partially crystallized to produce bcc-Fe(V,Nb,B) nanocrysta-
llites, embedded in an amorphous matrix [49]. These spectra show the
combined features of the broad amorphous phase and the sharper nano-
crystalline precipitates. Fitting these combinations allow one to deduce the
volume fractions of the amorphous and nano-crystalline phases in these
materials. Such data are important in the development of a comprehensive
model for the random anisotropy in such commercially important soft-
magnetic materials [16, 50].
Figure 5.28
57
Fe spectra of partially crystallized (top) Fe
79
V
7
B
14
and (bottom) Fe
80
Nb
6
B
14
ribbons [49].
Mössbauer spectroscopy also provides a simple method for estimating the
magnetic ordering temperature of a material. The “thermal scan” technique
consists of switching off the velocity drive unit and counting for fixed periods
of time in the zero-velocity channel at various temperatures. As the
temperature increases, the magnetic spectrum collapses towards a quadrupole
doublet or a singlet, depending on the crystallographic site symmetry. Thus,
the J absorption increases at zero-velocity and the number of counts registered
in the given time period falls. This is illustrated in Figure 5.29 where we show
spectra of amorphous Fe
90
Sc
10
obtained at 4.2 K and 300 K [51]. The
temperature dependence of the average hyperfine field yields a Curie
temperature of 98 K. The spectrum at 300 K is a paramagnetic, broad doublet
due to the distribution of the electric quadrupole splitting. This figure also
5.3 Applications 243
shows the Curie temperature determination using the thermal scan technique,
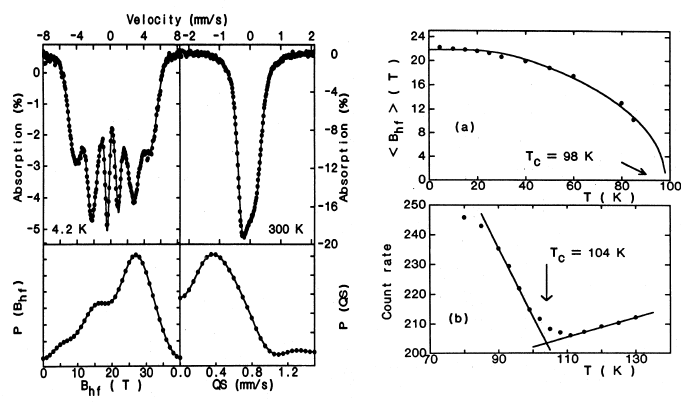
5. Mössbauer Spectroscopy
nonetheless useful as a quick method of obtaining a reasonable estimate of the
magnetic ordering temperature.
Figure 5.29 Left––
57
Fe spectra of a-Fe
90
Sc
10
at 4 K and 300 K, together with their respective
hyperfine field or quadrupole splitting distributions. Top right–– Temperature dependence of
the
57
Fe average hyperfine field. Bottom right–– Thermal scan determination of the magnetic
ordering temperature [51].
A further example of quantitative phase analysis in a mixed
amorphous/crystalline sample is shown in Figure 5.30, where we present a
series of RT (and 4.2 K)
57
Fe Mössbauer spectra obtained on amorphous and
crystallized Sc
2
Fe
14
B [52]. This experiment was an attempt to prepare
crystalline Sc
2
Fe
14
B by crystallizing an amorphous precursor, since Sc
2
Fe
14
B
does not form by traditional processing routes. Differential scanning
calorimetry had shown that the crystallization of amorphous Sc
2
Fe
14
B is a
two-stage process with crystallization temperatures of 600°C and 685°C.
Spectrum (a) was obtained with the amorphous, as-quenched sample at 4.2 K
and shows a well-split broad magnetic sextet, indicative of magnetic order
with a distribution of hyperfine field. Spectrum (b) is the RT spectrum of the
as-quenched amorphous sample and is a broad, very weakly magnetically split
was obtained after annealing the sample at the first crystallization stage and
clearly shows the growth of crystalline D-Fe, superimposed on a residual
amorphous component. The final spectrum (d) shows the sample after
annealing at 700°C. This fully crystallized material comprises D-Fe, ScFe
2
,
and ScB
6
(the latter phase being identified by X-ray diffraction).
244
yielding a value of 104 K, slightly higher than the previous value but
spectrum, obtained just below the Curie temperature of 328 K. Spectrum (c)
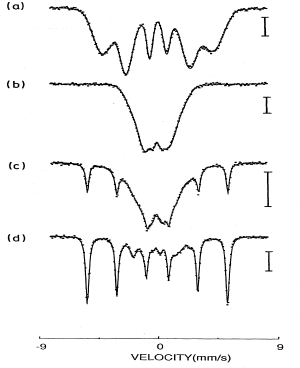
Figure 5.30
57
Fe spectra of Sc
2
Fe
14
B: (a) as-quenched amorphous ribbons at 4 K, (b) as-
quenched amorphous ribbons at 295 K, (c) partially crystallized, and (d) fully crystallized [52].
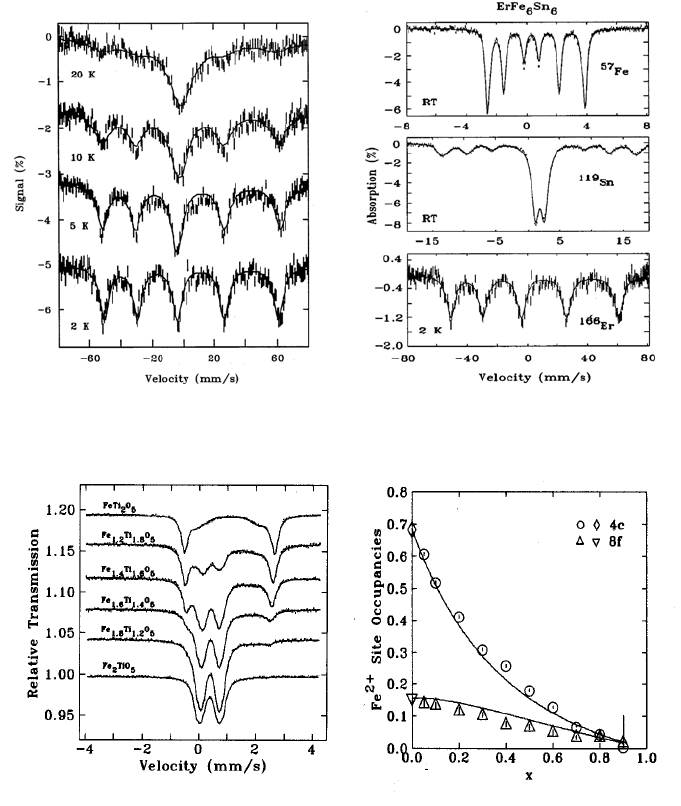
5.3.6 Electronic Relaxation
In Figure 5.31 we show the
166
Er spectra obtained in the temperature range
2–20 K of the intermetallic phase ErFe
6
Sn
6
[53]. The magnetic ordering
temperature of the Er sublattice, deduced by neutron diffraction, is 4.5 K. The
166
Er spectra show the collapse of the spectrum with increasing temperature,
but more noticeable is the fact that virtually the full magnetic splitting is seen
well above the magnetic ordering temperature. Er
3+
is prone to slow electronic
relaxation effects, yielding the hyperfine splitting observed in the
paramagnetic regime. Similar effects have been observed by
169
Tm
spectroscopy in Tm
3
Al
2
[54] and Tm
2
Al [55]. ErFe
6
Sn
6
provided a rare
opportunity to study all crystallographic sites in a compound by Mössbauer
spectroscopy, and in Figure 5.31 we also show the
57
Fe,
119
Sn, and
166
Er
spectra of this intermetallic.
5.3.7 Electronic Valence
As mentioned in Section 5.1, hyperfine parameters such as quadrupole
splitting and isomer shift can be quite sensitive to the electronic valence of the
parent ion.
To illustrate this sensitivity to electronic valence, we show in Figure 5.32 a
series of
57
Fe Mössbauer spectra obtained at room temperature on a number of
compounds in the pseudobrookite series Fe
1+x
Ti
2–x
O
5
[56]. In the Fe
2
TiO
5
end-member, Fe is ferric, i.e., Fe
3+
, and a broad, nonmagnetic doublet is
5.3 Applications 245
5. Mössbauer Spectroscopy
observed with a quadrupole splitting of ~ 0.55 mm/s. The other end-member
FeTi
2
O
5
comprises Fe
2+
, and produces a sharper, nonmagnetic doublet with a
much larger quadrupole splitting of ~ 2.16 mm/s. Pseudobrookite contains
two crystallographic sites available to the Fe ions and we also show the site
occupancies of Fe
2+
deduced from the Mössbauer spectra. These site
occupancies are in excellent agreement with those derived from neutron
diffraction measurements.
Figure 5.31 Left––
166
Er spectra of ErFe
6
Sn
6
. Right––
57
Fe,
119
Sn, and
166
Er spectra of ErFe
6
Sn
6
Figure 5.32 Left–– RT
57
Fe spectra of the pseudobrookite series Fe
1–x
Ti
2–x
O
5
. Right–– Relative
Fe
2+
site occupancies as a function of x [56].
(note the different velocity scales) [53].
246