Vij D.R. Handbook of Applied Solid State Spectroscopy
Подождите немного. Документ загружается.


accomplished by a study of the angular dependence of the ENDOR lines,
which were observed in the 0.5–26 MHz range. The hyperfine couplings to
the nuclei in some shells have characteristically different angular
dependencies. When the angular dependence of the hyperfine coupling of
two shells is similar, the magnitudes of the hyperfine coupling are usually
very different and the line pairs can be assigned.
i. Signs of the hyperfine coupling constants: In general, only the magnitude
of the hyperfine coupling constants can be determined by EPR and ENDOR.
The sign, however, is especially important, because it is related to the sign of
the unpaired spin density and consequently to the electronic structure of the
radical. The general TRIPLE resonance method is very helpful in
determining the relative sign.
ii. Second-order shifts: Second-order effects in the hyperfine couplings
measured by ENDOR can generally be detected for A 30 MHz. Although
they do not contain any additional information, second order shifts must be
included in the analysis in order to avoid errors in the calculated values of the
elements of the hyperfine tensors.
4.3.1.2 Quadrupole Couplings
Nuclei having spin I 1 (e.g.,
2
H,
14
N,
63
Cu, see Tables 4.1 and 4.2) possess
an electric quadrupole moment in addition to a magnetic moment. If the
interaction of a quadrupole moment with the electric field gradient at the
nucleus is smaller than the hyperfine interaction, it will not affect the EPR
spectra, to first order. However, in ENDOR spectra this interaction will lead
to additional splittings. For an electron and a single nucleus with I 1, the
quadrupole term, H
Q
, should be added to the spin-Hamiltonian.
H = H
EZ
+
H
HF Z
.
(4.29)
where Q is the quadrupole coupling tensor. It is often assumed that the
hyperfine coupling tensor à and the quadrupole coupling tensor Q have the
same principal axis system. This coincidence of these à and Q tensors may
be imposed by symmetry.
The energy level diagrams for an electron coupled to a nucleus with I = 1
are given in [1] page 185. The resonance condition for the four ENDOR
transitions is given by
1
n
2
||
QQ AQ
zz
(4.30)
4. ENDOR Spectroscopy
.
+ H + hIQ I
166

Table 4.2 Electronic and nuclear properties of the transition metal ions.
Ion
Electron
configuration
Total
spin
S
Spin-
orbit
constant
(cm
–1
)
Nucleus
Abun-
dance
(%)
Nuclear
spin I
g
n
Quadruple
moment
(10
24
cm
2
)
Ti
3
+
3d
1
1/2 154
47
Ti
7.32 5/2 –0.3153 ...
49
Ti
5.46 7/2 –0.3154 ...
V
3+
3d
2
1 209
51
V
99.8 7/2 1.471 0.25
V
2+
3d
3
3/2 167
Cr
3+
3d
3
3/2 273
53
Cr
9.55 3/2 –0.3163 ...
Cr
2+
3d
4
2 230
Mn
3+
3d
4
2 352
55
Mn 100 5/2 1.387 0.3
Mn
2+
3d
5
5/2 347
Fe
3+
3d
5
5/2 ...
57
Fe
2.21 1/2 <0.10 ...
Fe
2+
3d
6
2 410
Co
3+
3d
6
2 ...
59
Co
100 7/2 1.328 0.5
Co
2+
3d
7
3/2 533
Ni
2+
3d
8
1 649
Cu
2+
3d
9
1/2 829
63
Cu
69.1 3/2 1.484 –0.16
65
Cu 30.9 3/2 1.590 –0.15
The number of observed lines depends on which levels are common for a
given EPR transition. All four lines are expected for the m
I
= 0 EPR
transition. Two ENDOR lines are observed for the m
I
= 1 EPR (low field)
transition, while for the m
I
= –1 EPR (high field) transition another two
ENDOR lines are observed. This separation of the ENDOR frequencies into
two groups allows determination of the relative signs of the quadrupole and
hyperfine interactions.
For I > 1, there are 4 × I ENDOR transitions given by
Q =
1
2
A ± Q
n
± Q(2m
I
+ 1) (4.31)
Quadrupole couplings result from the electric field gradients at the nucleus
and therefore give information about charge distribution in nearby chemical
bonds.
4.3.2 Organic Free Radicals
Free radicals produced by ionizing radiation of organic single crystals, have
been extensively studied. An ENDOR study results in the radical’s
identification and its orientation in the crystal. The radical formation and
transformation mechanism can also be derived. The occurrence of
167
4.3 ENDOR in the Solid State
overlapping radical spectra is more common in single crystals than in liquids,
hence the ENDOR-induced EPR technique shown in [1], pages 97–98 is
especially useful. Most radicals in single crystals exhibit g values with little
anisotropy and range from 2.0023 to 2.0080.
4.3.2.1 Interpretation of the Hyperfine Tensors for Organic Free Radicals
The magnitudes of the hyperfine tensor components are determined from the
ENDOR spectra. The relative signs can be obtained with the general TRIPLE
method. The absolute sign of the principal values is often given on the basis
of theoretical considerations. The isotropic and anisotropic parts of the tensor
are usually separately listed. The orientation of the principal axes relative to
the crystal axis is defined in terms of the direction cosines.
Because protons are the most extensively studied nuclei, the proton
hyperfine tensors will be considered. Protons are labeled by Greek letters
depending on how many bonds away they are from the radical center; the
proton attached directly to the free radical center is labeled D. The D-proton
dipolar tensors exhibit large anisotropy amounting to about 50% of the
isotropic coupling for unit spin density at the radical center. The anisotropy
results from electron dipole-nuclear dipole magnetic interactions. The a
iso
of
D-protons is characterized by a negative sign.
The anisotropy of protons attached to a Ecarbon atom is typically about
10% of the a
iso
, for unit spin density. This small anisotropy is the result of the
greater (two bonds) distance of the Eproton from the atom on which the
unpaired spin density is located. E-proton coupling constants are characterized
by a positive sign of a
iso
. The isotropic coupling to E-protons varies as cos
2
T
equation (4.33) where Tis the dihedral angle between two planes, both of
which contain the D-carbon-E-carbon bond axis. The magnitude of a
iso
protons is related to the radical geometry. It is therefore possible to study the
internal rotation of the radical fragment by analyzing the E-proton coupling
constants. A typical example is the methyl group rotation. Methyl protons
appear equivalent at high temperatures, i.e., their hyperfine interaction can be
described by one tensor with axial symmetry around the C
3
axis of rotation.
On lowering the temperature, however, it is often observed that methyl group
rotation is stopped (on the EPR time scale). The hyperfine interactions for the
protons are then described by their individual hyperfine tensors. The
orientation of the “static” protons with respect to the rest of the radical can be
determined.
J-proton couplings are generally much smaller than those of Dprotons (by
about two orders of magnitude), so they usually cannot be directly measured
by EPR, but can be detected by ENDOR methods.
The special advantage of single-crystal ENDOR over EPR measurements
is the detection of small hyperfine coupling constants (typically from 100
4. ENDOR Spectroscopy
of
E
-
168
kHz). These small couplings are assigned to weakly coupled protons within
the molecule or lattice protons that are dipolar-coupled to the free radical.
From such couplings accurate dipole-dipole distances can be deduced and
from these, in turn, the precise structure and location of the radical can be
determined.
4.3.3 Transition Metal Ions
EPR spectra are routinely observed for paramagnetic transition metal ions in
crystals, chemical complexes, and biomolecules. For ions with large spin-
orbit coupling constants (see Table 4.2), the spin system is strongly coupled to
the lattice vibrations so that spin relaxation is very effective. Consequently,
the EPR lines are sometimes too broad to be observed at room temperature,
and EPR and ENDOR studies of such compounds are usually carried out at
much lower temperatures.
The central problem in EPR studies of transition metal ions is the effect of
the surrounding atoms, by means of symmetry, on their electronic levels. The
EPR spectra are characteristic of the transition metal ion itself rather than the
hidden in the inhomogeneously broadened EPR line. In contrast, ENDOR
spectra provide both strong and weak hyperfine as well as quadrupole
transition metal ions in crystals or in molecular environments are anisotropic.
the usual hyperfine term: H
HF
= hS
.
Ã
.
I, where I is the spin of the nucleus (see
The isotropic coupling is due to mixing of the ground and excited state
configurations. In the absence of covalent bonding, the spin densities at the
ion are not very sensitive to the environment of the ion. The typical situation
for transition metal ion ENDOR is that H
HF
> H
NZ
, so the ENDOR lines
appear asymmetrically around the value of A/2 (for S =½) because of the
second-order effects. On the other hand, for ligand-ENDOR often H
HF
< H
NZ
so the ENDOR lines are centered about the free nuclear frequency Q
n
. The
identity of the ligand nuclei can be determined from the number of ENDOR
transitions and the value of Q
n
.
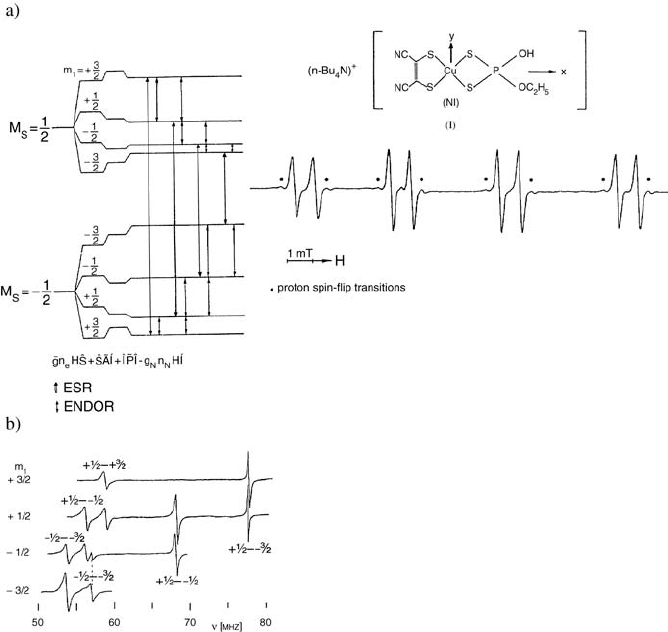
As an example, the
63
Cu ENDOR study for a Cu mixed-ligand complex
doped into the corresponding Ni complex single crystal is shown in Figure 4.5
[5]. The observed
63
Cu ENDOR spectrum Figure (4.5c) depends on which
EPR line is saturated, provided both EPR and NMR transitions have levels in
common Figure (4.5a). The
31
P ENDOR lines appear in a different frequency
range (5.5–7 and 17–18.5 MHz).] The spectra were analyzed in terms of the
Table 4.2). The isotropic and dipolar part of the à tensor can be separated.
surroundings. Weak hyperfine couplings to more distant nuclei are usually
mostly localized on the metal ion. The magnetic moments and the g factors of
The hyperfine interaction for the transition metal ion itself is described by
coupling tensors. The unpaired electron in transition metal complexes is
169
4.3 ENDOR in the Solid State
Hamiltonian expressed as the sum of the following interactions: electron
Zeeman, Cu hyperfine, Cu nuclear Zeeman, Cu quadrupole, P hyperfine, and
P nuclear Zeeman:
H = EB
.
g
.
S + S
.
Ã
Cu
.
I
Cu
–
g
Cu
E
n
B
.
I
Cu
+ I
Cu
.
Q
Cu
.
I
Cu
+ S
.
Ã
P
.
I
P
– g
p
E
n
B
.
I
p
(4.32)
Figure 4.5 (a)
63
Cu energy levels and ENDOR transitions for each saturated EPR line. To the
right is a typical single-crystal EPR spectrum of the Cu complex I at 27.2 K. The Cu hyperfine
lines are split into doublets because of hyperfine interaction of the unpaired electron with
31
P.
Proton spin flip transitions correspond to 'm
s
= 1, and 'm
I
= 1, the so-called forbidden
transitions (b) Complete
63
Cu ENDOR spectrum recorded for each EPR line saturated as
indicated in (a) (for B
A
g
i,
i.e., in the plane of smallest g anisotropy). From [5].
The analysis gave very precise values of the Cu hyperfine and quadrupole
tensors as well as of the phosphorus hyperfine coupling tensor. The principal
axes Ã
Cu
tensor were found to coincide with those of g. Further, the relative
orientations of the principal axes of Q
Cu
and Ã
P
with respect to those of g
were determined so that the structure and symmetry of the Cu complex were
established [5].
4. ENDOR Spectroscopy
170

4.3.3.1 Triplet State ENDOR
An atom or a molecule with the total spin of the electrons S = 1 is said to be
in a triplet state. The multiplicity of such a state is (2S + 1) = 3. Triplet
systems occur in both excited and ground state molecules, in transition metal
ions with S = 1, in pairs of paramagnetic centers, and in some defects in
solids.
For a system with S = 1, there are three sublevels characterized by m
s
= ±
1 and m
s
= 0. In the absence of an external magnetic field, these sublevels, in
contrast to the systems with S = ½, may not be degenerate. The lifting of
degeneracy of the spin states in the absence of a magnetic field is called zero-
field splitting, and it is common for systems with S 1.
The zero-field splitting (or fine structure) term must be included in a spin-
Hamiltonian when S 1. It can be expressed as a tensor interaction of the
total effective spin with itself, i.e.,
H
SS
= S
.
D
.
S. (4.33)
The spin-spin coupling (or zero-field splitting) tensor D is a symmetric and
traceless tensor. The fine structure term is often written in terms of zero-field
constants D and E in a principal axis system:
222
ss
1
(1) ,
3
ÎÞ
Ïß
Ðà
SSS SS
zx
y
HD E (4.34)
where D is the axial and E is the rhombic zero-field parameter. When
222
2
ss
3
1, ( ) ( ) SSSS
zx
y
HD E . With B parallel to either the x, y, or z
axis, a pair of EPR lines will be observed with couplings equal to ѿ D – E,
ѿD + E, and –2/3D. For axial symmetry, E = 0, and two of the states will
remain degenerate at zero magnetic field. The zero-field parameters D and E
can, in general, be determined from the EPR spectrum (for H
SS
< H
EZ
).
ENDOR studies of triplet states are especially useful because the hyperfine
structure is rarely revealed in the EPR spectrum.
The total spin-Hamiltonian for the triplet system is given by:
H = H
EZ
+ H
SS
+ H
HF
+ H
NZ
(4.35)
with the H
SS
term the second largest one because typically H
SS
> H
HF
and H
NZ
,
and H
SS
< H
EZ
. For triplet states of aromatic molecules, g is nearly isotropic
because of the small spin-orbit interaction. Thus, most of the observed
anisotropy is due to spin-spin coupling as a result of magnetic dipolar
interactions of the unpaired electrons in the triplet state.
In general, for metal ions with S 1 in crystals, g may be quite anisotropic.
The spin-orbit couplings are appreciable and account for the zero-field
splitting. The zero-field splittings for transition metal ions may be much
larger than for organic molecules, and may even exceed the Zeeman energy.
171
4.3 ENDOR in the Solid State
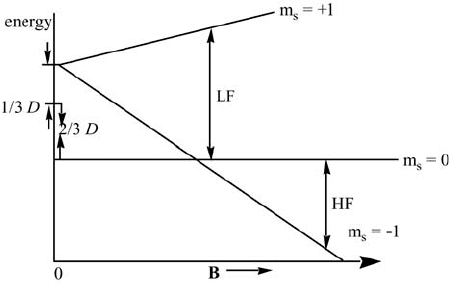
The energy level diagram for the triplet state corresponding to the zero-
field and electron Zeeman splittings is given in Figure 4.6, while the energy
levels with hyperfine and nuclear Zeeman interactions, to illustrate the
ENDOR spectrum, are shown in Figure 4.7. Saturation of the EPR lines will
produce an ENDOR line at the free nuclear frequency, and one other ENDOR
line. When the high-field EPR transitions are observed, the respective two
ENDOR lines will be detected, one of them at the free nuclear frequency.
Neglecting the ENDOR line at Q
n
, the general expression for the ENDOR
frequencies is
Q
triplet ENDOR
= »A ± Q
n
», (4.36)
where either the plus or the minus sign is used when a single EPR triplet
transition is observed.
ENDOR studies of triplet systems must be preceded by an EPR study to
determine the D tensor. In general, it appears that ENDOR lines of triplets
are observable only when the magnetic field is almost perpendicular to a
principal axis of the hyperfine tensor, often being parallel to the principal axis
of the D tensor.
Figure 4.6 Energy of the triplet state with axial symmetry (E = 0, D > 0) for B»» z. The EPR
'm
s
= ±1 transitions are indicated by LF (low-field) and HF (high- field). The electron Zeeman
and spin-spin interaction are taken into account, and H
SS
< H
EZ
. At zero magnetic field the
triplet energy levels m
s
= 0 and m
s
= ±1 are split by D. Because the symmetry is assumed to
be axial, two of the states remain degenerate.
4. ENDOR Spectroscopy
172
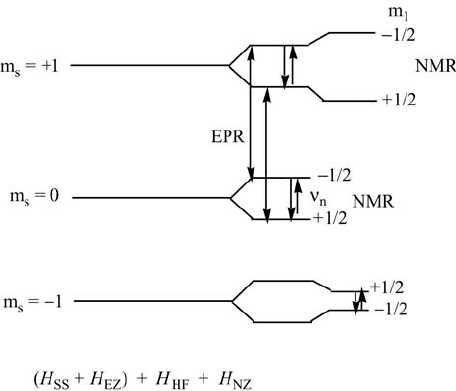
Figure 4.7 Energy levels for the triplet state at a fixed magnetic field and microwave frequency
appropriate for the indicated EPR transitions. The EPR transitions correspond to the low-field
(LF) EPR line in Figure 4.6. The additional splittings of the triplet state energy levels come
from hyperfine (H
HF
) and nuclear Zeeman (H
NZ
) interactions. The two upper NMR transitions
will be observed as an ENDOR spectrum.
In the ideal case, only one ENDOR line below or above the free nuclear
frequency is observed for each group of equivalent protons. So if the sign of
the dipolar tensor D is known, the sign of the hyperfine component can be
determined from the ENDOR spectra. From the hyperfine tensors both spin
density and geometrical information can be obtained.
4.3.4 Disordered Solids
ENDOR experiments in disordered solids are usually carried out in two
cases: the paramagnetic ion or molecule can be used to probe its environment
or the paramagnetic system is studied in frozen or solid solution because
dilute single crystals are not available.
There are, in general, two different types of ENDOR spectra in disordered
solids: (1) A powder-type spectrum is observed when all orientations
contribute equally to the spectrum; the ENDOR spectrum is the same no
matter which portion of the EPR line is saturated; a powder-type spectrum is
also obtained when all regions of the EPR spectrum are saturated at the same
time even if not all orientations contribute equally to the EPR powder pattern.
(2) A crystal-like spectrum can be observed when the various orientations of
paramagnetic molecules do not contribute equally to the EPR powder
173
4.3 ENDOR in the Solid State

spectrum; the ENDOR pattern depends on the portion of the EPR spectrum
being saturated; the EPR transitions can be saturated selectively.
A characteristic feature of ENDOR spectra of disordered solids is the
appearance of a strong line occurring at the free nuclear frequency, called a
matrix ENDOR line. It originates from purely dipolar coupling of the unpaired
electron with magnetic nuclei of the surrounding matrix at distances within
roughly 6 Å. In liquids this line is averaged to zero by the rapid tumbling of
the radical. The molecular motions in disordered solids, in general, affect the
intensity of the matrix ENDOR.
4.3.4.1 Powder-Type Spectra
When all orientations of the paramagnetic molecules with respect to the
direction of the magnetic field are present, the ENDOR lines are broadened
and may be very weak. An average of all orientations of the hyperfine
coupling tensors for each individual nucleus can be measured. Thus, the
ENDOR spectrum for a nucleus extends over the whole range of the hyperfine
values with some build-up of intensity at the principal values of the hyperfine
tensor. Narrow lines are observed if the anisotropy is small. For an D proton
in organic radicals the anisotropy typically amounts to 50% of the isotropic
value of a unit spin density, and hyperfine principal values are roughly a/2, a,
and 3a/2. Thus the D-proton powder lines are rarely observed. The anisotropy
of E protons is much smaller, typically about 10% of the isotropic value.
For a system of S = ½ and one proton with axially symmetric hyperfine
coupling to the electron spin, if the coupling is small, the ENDOR frequency
can be expressed by
Q
±
(T) = Q
n
±
1
2
[A
»»
cos
2
T + A
A
sin
2
T], (4.49)
where T is the angle between the magnetic field and the symmetry axis.
When all orientations are equally probable, the powder-type spectrum is
observed (Figure 4.8) giving the principal values of the hyperfine tensor.
This favorable situation typically occurs for the protons of a rotating
methyl group. When the protons are equivalent on the EPR time scale, the
hyperfine tensor is often axially symmetric with the largest component along
the C-C bond direction.
4. ENDOR Spectroscopy
174
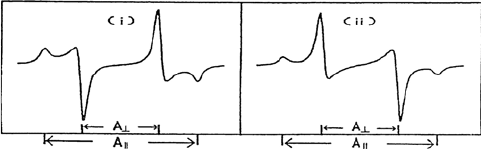
Figure 4.8 ENDOR powder lines for a proton with axially symmetric hyperfine interaction;
(i) A
dip
˙˙
= 2A
dip
A
and (ii) A
dip
˙˙
= – 2A
dip
A
. From [6].
4.3.4.2 Crystal-like Spectra
Crystal-like ENDOR spectra in disordered systems can be observed when the
magnetic field is set at the so-called turning points in the EPR powder pattern
[6]. This is realized in the systems with considerable anisotropy of the
magnetic interaction, i.e., in the following favorable situations: (1) the
anisotropy of the g tensor dominates other magnetic interactions; this situation
is typical for biomolecules; (2) when the anisotropy of the g tensor is small,
but the hyperfine anisotropy is considerable (free radicals); (3) the anisotropy
of the electron spin-spin interaction (described by the D tensor) is dominant
(organic biradicals); and (4) the anisotropies of two magnetic interactions are
of the same order of magnitude, but the axes with the largest anisotropy
coincide (e.g., Cu
2+
complexes).
Because of the anisotropy of the magnetic interaction, different orientations
of the paramagnetic molecules with respect to the magnetic field correspond
to different resonance conditions. Thus, a characteristic powder pattern,
sometimes well resolved, is given by EPR spectroscopy. The EPR spectrum
should be analyzed to locate the appropriate EPR field values where
orientational selection of the molecules can be observed. The magnetic field
set to these so-called turning points induces resonance in molecules having a
unique orientation. The ENDOR spectra taken at these field settings will
result in hyperfine tensor components relative to the tensor axes of the
respective dominating interactions. In contrast to powder-type spectra, the
crystal-like lines are characterized by linewidths close to those found in single
crystal spectra. At other settings of the magnetic field, the EPR spectrum
arises from molecules in many orientations and the respective ENDOR
linewidths are much broader.
Figure 4.9 gives an example of how the frequency and width of the
observed ENDOR lines depend on the portion of the EPR spectrum that is
saturated [7]. In this system [Cu(pic)
2
in Zn(pic)
2
.
4H
2
O powder] the g tensor
and Cu hyperfine tensor are nearly coaxial. The symmetry axes of both
tensors are oriented perpendicular to the plane of the complex. Because of the
axial symmetry, there is only one turning point in the EPR spectrum. The
EPR resonances with the magnetic field parallel to the molecular plane
correspond to the high field end of the powder pattern, while the transitions
175
4.3 ENDOR in the Solid State