Sultanov B.K. Kazakhstan Today
Подождите немного. Документ загружается.


320 321
Kazakhstan today
Chapter 5. Human Development in Kazakhstan
To improve women’s employment opportunities, the Strategy
provides for the development of state and private children’s preschool
institutions. A special section of the Strategy concerns gender educa-
tion and advocacy among the population, in particular state offi cials,
parliamentarians, the Maslikhat deputies, managers at all levels, and
the mass media.
At present, Kazakhstan has a whole system of institutional mecha-
nisms to protect the rights of women and improve their status. These
mechanisms are being continuously developed and improved and are
becoming increasingly effective.
The main such institution is the National Family and Gender
Policy Commission, which is a consultative and advisory body to
the President. Similar structures operate at regional levels of state
management.
The Commission is working to eliminate the stereotypes of gender
superiority and clarify the necessity of social equality of women and
men. Its priorities for the near future are to lobby the draft laws On
Equal Rights and Equal Opportunities for Women and Men and On
Domestic Violence.
The involvement of women in economic activities is another issue
on the agenda. Since 2000, the government has been taking measures
to support women’s businesses. Tens of thousands of women have
obtained ‘soft’ loans and opened their own businesses. The Small
Business Development Fund has allocated more than 2 billion tenge
to this end over six years.
NGOs are playing a signifi cant part in improving women’s status in
Kazakhstan. Currently, about 150 NGOs are active in the country, the
most prominent of which are the Association of Business Women of
Kazakhstan, the Feminist League, the Almaty Women’s Informational
Centre, and the Almaty Centre for Gender Research. In addition to
these, the Institute of Social and Gender Research is operating under
the Kazakh State Female Teachers Institute, and there are also some
other scientifi c centres.
Women’s NGOs have set up centres for employment and occupation
guidance, and small business and legal support. They are also develop-
ing a network of crisis centres to combat violence against women.
In the area of gender issues, Kazakhstan is cooperating with inter-
national organisations including UNIFEM, OSCE, the International
Organisation for Migration (IOM), USAID, the British Council, and
UNDP.
The government is creating conditions to implement the gender
approach in the budgeting processes at all levels and in the develop-
ment of state socioeconomic programmes. UNIFEM and the National
Family and Gender Policy Commission are implementing the Social/
Gender Budgets in Kazakhstan project.
Parliamentarians are also mindful of the issues of family and
women. They have created the Otbasy group and are cooperating
with the National Commission.
Maternity and infancy protection is at the centre of the govern-
ment’s attention, taking into account the importance of the nation’s
health. In 2008, Kazakhstan began to implement a special Maternity
and Infancy Protection Programme. As part of the state People’s
Health Programme, it is one of the priorities for the nation’s gender
policy. The programme has a number of blocks, including social sup-
port to women and healthcare. In particular, the birth and childcare
allowances have been signifi cantly increased.
In 2008, compulsory social insurance for pregnancy and childbirth,
and for childcare until one year of age was introduced. The National
Scientifi c Centre for Maternity and Childhood and the Republican
Children’s Rehabilitation Centre were launched. Additional measures
are being taken to support large families.
The gender programmes have produced visible positive changes in
the demographic situation. The birth, natural increase and reproduc-
tion rates have improved and the maternal and infant mortality rates
are tending to decrease. The health of the population is improving.
Kazakhstan has created all the conditions for women to take part
in the state management on a par with men. Signifi cant efforts have
been made to strengthen women’s political leadership.
322 323
References
1. Послание Президента РК Н.А. Назарбаева «Новый Ка-
захстан – в новом мире» – Стратегия очередного этапа развития
страны. 28 февраля 2007 г. // www.akorda.kz
2. Назарбаев Н.А. Стратегия вхождения Казахстана в
50 самых конкурентоспособных государств мира. Март 2006 г.
3. Агентство по статистике Республики Казахстан // www.
stat.kz
4. Назарбаев Н. Казахстан – только вперед! // www.akorda.kz
5. Назарбаев Н.А. Рост благосостояния граждан – главная цель
государственной политики. Февраль 2008 г. // www.akorda.kz
6. Конституция Республики Казахстан. – Алматы, 1998.
7. Концепция гендерной политики в Республике Казахстан
// www.gender.cawater-info.net
8. Стратегия гендерного равенства в Республике Казахстан
на 2006–2016 годы // www.akorda.kz
Kazakhstan today
Appendices. Kazakhstan in Figures
APPENDICES. KAZAKHSTAN IN FIGURES
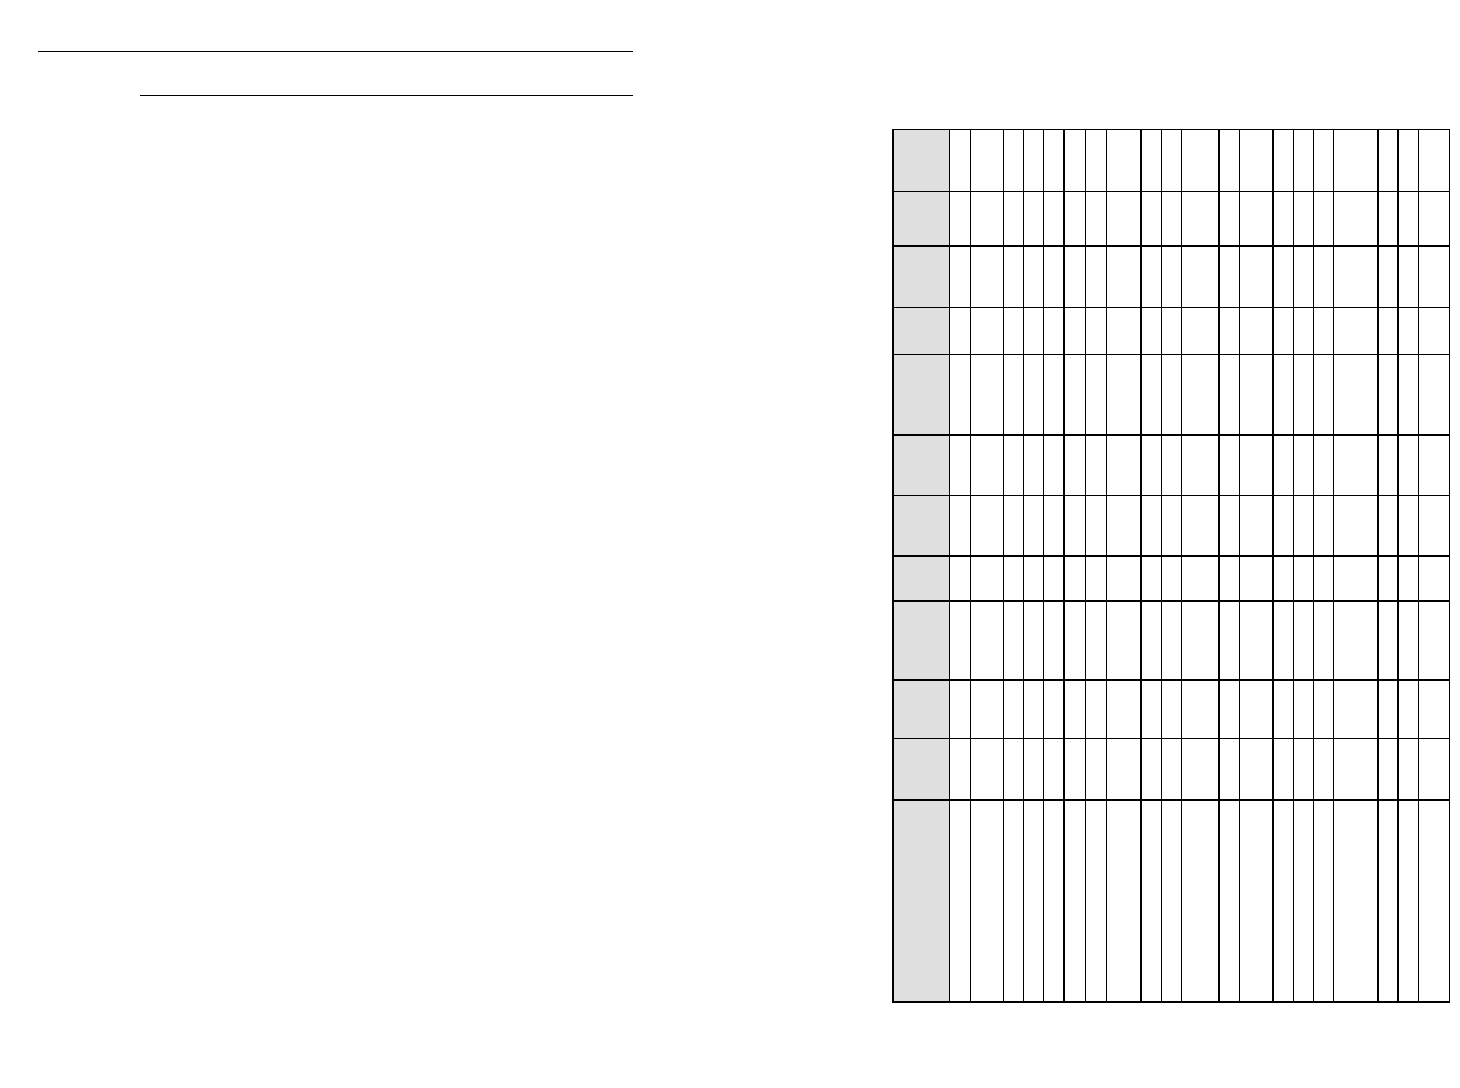
The structure of GDP by sector
%
Sector
1st
quarter
2007
1st half
of 2007
1st nine
months of
2007
2007
1st
quarter
2008
1st half
of 2008
1st nine
months of
2008
2008
1st
quarter
2009
1st
half of
2009
1st nine
months
of 2009
Production of goods 39.5 42.0 44.4 43.4 42.4 46.7 47.4 45.6 37.3 40.2 43.4
Agriculture, hunting, forestry,
fi shery
1.9 2.3 5.2 5.7 2.1 2.7 5.5 5.3 2.7 3.2 6.2
Agriculture, hunting, forestry 1.9 2.2 5.1 5.6 2.1 2.6 5.4 5.2 3.1 6.1
fi shery 0.02 0.1 0.1 0.1 0.03 0.1 0.1 0.1 0.1 0.1
Industry 33.0 30.8 28.9 28.3 34.7 37.3 34.0 32.2 28.7 30.3 29.5
The extractive sector 17.4 16.2 14.9 15.1 19.8 22.6 20.5 18.7 14.8 16.2 16.3
Manufacturing 13.0 12.7 12.4 11.5 12.3 12.9 12.0 11.8 11.0 12.0 11.4
Production and distribution of
electricity, gas and water
2.6 1.9 1.6 1.7 2.6 1.8 1.5 1.7 2.9 2.1 1.8
Construction 4.6 8.9 10.3 9.4 5.6 6.7 7.9 8.1 5.9 6.7 7.7
Production of services 58.8 55.9 53.7 54.3 57.4 52.4 50.7 52.1 64.8 60.0 55.5
Trade, repairs of cars and
household items
14.1 12.8 12.2 12.4 13.5 12.1 11.9 12.3 14.6 13.6 13.1
Hotels and restaurants 0.8 0.8 0.9 0.9 1.0 0.9 0.9 0.9 1.2 0.9 0.9
Transport and
telecommunications
10.1 11.1 11.3 11.5 9.6 10.3 9.9 11.0 10.6 10.5 10.3
Transport 7.9 8.7 9.0 9.0 7.0 8.3 8.0 8.5 7.8 8.0 8.0
Telecommunications 2.2 2.4 2.3 2.5 2.6 2.0 1.9 2.5 2.8 2.5 2.3
Financial activities 5.4 5.8 6.0 5.9 5.9 5.5 5.4 5.3 6.2 5.8 5.2
Operations with property,
letting and services to
consumers
18.2 15.8 14.4 14.9 18.2 15.3 14.7 14.9 21.3 18.3 15.7
Government expenses 2.2 2.3 2.2 1.9 2.0 1.9 1.8 1.7 2.3 2.6 2.4
Education 4.0 3.4 3.1 3.3 3.6 2.9 2.7 2.8 4.3 4.0 3.5
Healthcare and social
services
2.1 1.9 1.8 1.7 1.9 1.7 1.6 1.5 2.3 2.2 2.2
324 325
Kazakhstan today
Appendices. Kazakhstan in Figures
Table continuation
Sector
1st
quarter
2007
1st half
of 2007
1st nine
months of
2007
2007
1st
quarter
2008
1st half
of 2008
1st nine
months of
2008
2008
1st
quarter
2009
1st
half of
2009
1st nine
months
of 2009
Other services 1.9 2.0 1.8 1.8 1.7 1.8 1.8 1.7 2.0 2.1 2.2
Total by sectors 98.3 97.9 98.1 97.7 99.8 99.1 98.1 97.7 102.1 100.2 98.9
Indirectly-measured
services of fi nancial
intermediation
-4.4 -4.7 -4.9 -4.8 -5.6 -5.1 -4.8 -4.7 -6.6 -5.2 -3.9
Total added value 93.9 93.2 93.2 92.9 94.2 94.0 93.3 93.0 95.5 95.0 95.0
Taxes and customs duties 6.1 6.8 6.8 7.1 5.8 6.0 6.7 7.0 4.5 5.0 5.0
Gross domestic product 100.0 100.0 100.0 100.0 100.0 100.0 100.0 100.0 100.0 100.0 100.0
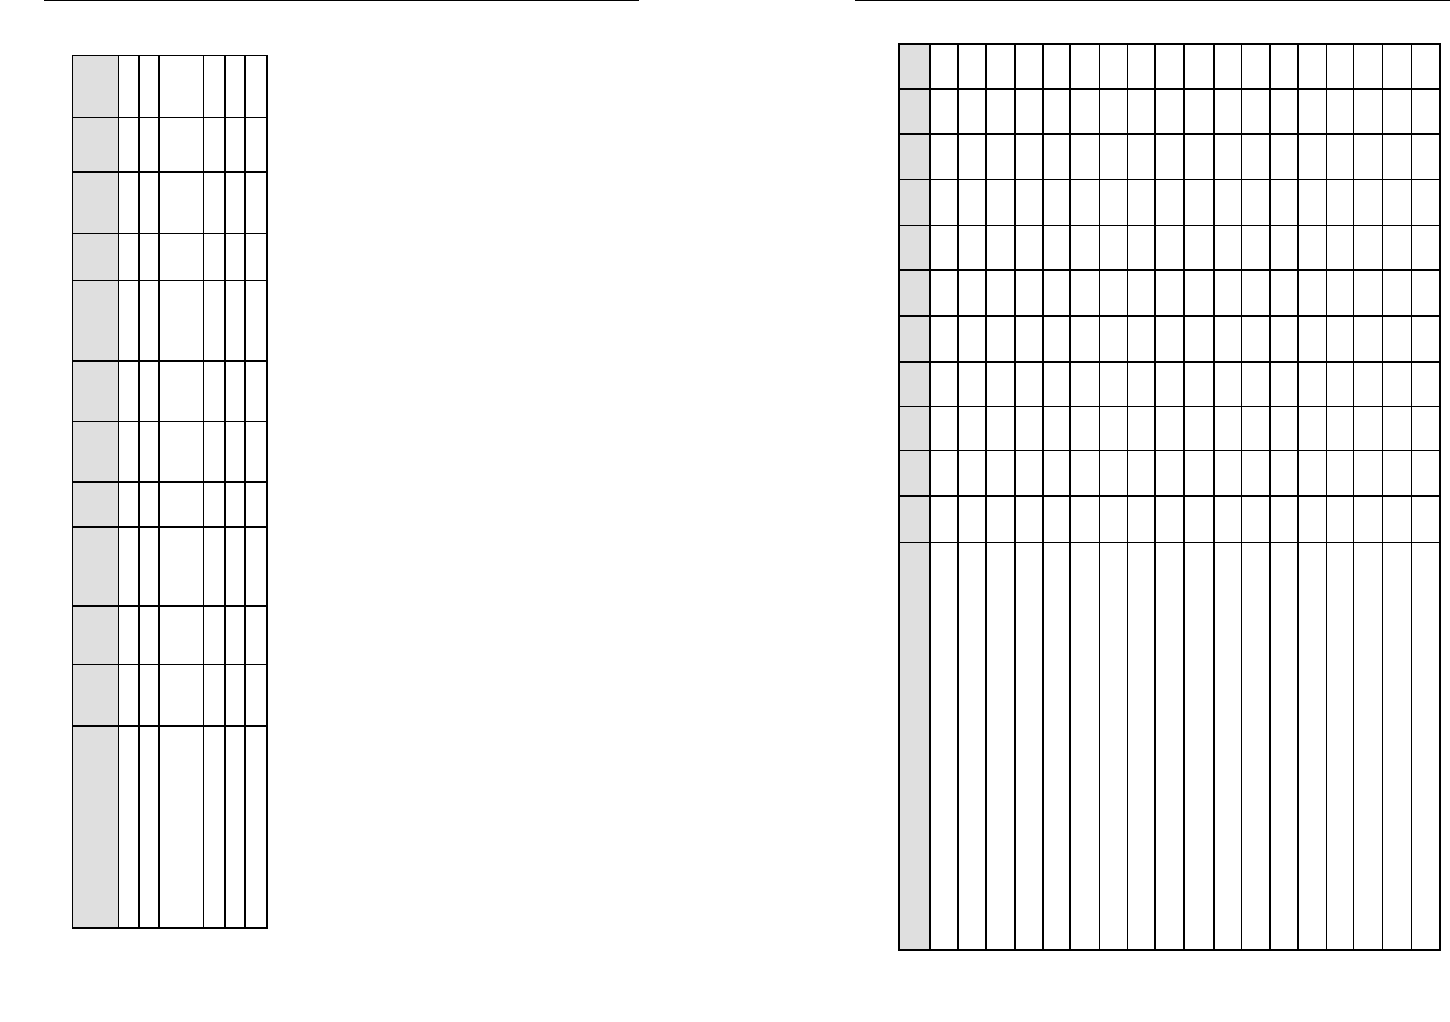
Indices of physical volume of industrial output of the Republic of Kazakhstan by sector
%
1999 2000 2001 2002 2003 2004 2005 2006 2007 2008 2009*
Industry 102.7 115.5 113.8 110.5 109.1 110.4 104.8 107.2 105.0 102.1 101.7
Extractive sector 109.6 121.0 114.0 115.9 110.2 113.4 102.7 107.0 102.6 105.5 106.1
Fuel extraction 109.0 118.3 115.3 116.9 110.3 114.9 104.2 106.4 103.0 106.3 107.3
Extraction of coal, lignite and peat 83.7 128.4 105.7 93.1 115.0 102.4 99.7 111.3 101.2 102.8 92.1
Extraction of crude oil and accompanied gas 114.4 115.8 115.1 117.4 108.3 113.6 102.9 106.1 102.6 105.3 107.7
Extraction of natural (combustion) gas 135.0 125.0 101.5 121.2 122.5 124.6 106.1 104.6 104.5 115.1 108.4
Extractive sector, excluding fuel extraction 110.9 130.6 106.8 110.5 108.9 102.5 91.5 111.7 99.6 99.3 99.7
Extraction of iron ore 101.4 191.7 94.3 115.3 116.0 106.3 82.9 113.8 102.8 89.3 101.1
Extraction of non-ferrous metals 117.1 117.5 106.2 108.3 104.5 98.2 93.1 104.6 95.5 105.7 98.5
Manufacturing 102.0 117.4 115.0 108.1 107.9 109.2 107.6 108.1 107.8 97.1 95.5
Production of foodstuffs, including beverages 91.4 116.1 108.2 108.7 110.7 109.4 117.0 107.7 107.4 98.8 98.8
Production of tobacco products 86.3 102.8 110.9 109.6 109.6 109.0 107.0 102.8 102.2 90.4 93.1
Textile and garment industry 103.1 121.7 125.6 115.7 95.4 103.4 114.0 102.7 81.6 110.4 87.6
Production of leather, leather products and shoes 103.1 173.9 286.3 134.9 127.8 122.2 92.3 110.5 167.0 128.1 91.6
Timber industry and production of wooden items 102.9 133.8 120.0 124.7 119.6 91.8 114.4 91.3 109.1 98.9 86.3
Pulp and paper industry; publishing 86.7 109.6 140.4 124.4 105.1 117.6 131.4 115.8 106.7 88.6 102.1
Production of coke, petroleum products and nuclear materials 88.6 117.1 119.4 108.6 113.3 104.3 116.2 104.7 109.2 103.6 105.3
Production of petroleum products 71.2 103.8 123.7 109.8 113.4 104.9 118.6 104.0 108.3 103.1 103.7
326 327
Kazakhstan today
Appendices. Kazakhstan in Figures
1999 2000 2001 2002 2003 2004 2005 2006 2007 2008 2009*
Chemical industry 105.9 118.6 161.3 113.4 117.6 111.7 95.3 103.6 128.6 109.3 76.3
Production of rubber and plastic products 184.9 142.3 130.8 160.4 140.5 155.9 125.2 132.2 132.2 108.7 92.3
Production of other nonmetal mineral products 96.1 138.6 146.1 117.5 128.8 129.3 135.5 119.6 124.4 78.4 92.7
Metallurgy 116.7 116.3 108.4 106.4 100.3 104.7 93.7 105.4 103.0 96.2 94.3
Ferrous metallurgy 134.9 118.9 101.8 107.9 107.6 105.0 89.2 101.4 111.5 86.3 96.5
Production of non-ferrous metals 103.7 113.9 113.6 105.0 93.1 103.1 96.1 106.3 98.3 103.6 91.2
Production of fi nished metal products 78.2 137.9 69.0 96.4 122.7 104.1 102.0 130.3 115.7 80.6 95.5
Machine-building 113.6 179.9 141.2 109.6 121.6 131.7 124.7 119.4 114.6 92.6 85.7
Other sectors of industry 70.0 164.3 150.2 115.0 153.8 140.2 123.2 100.1 117.4 87.7 107.6
Production and distribution of electricity, gas and water 95.7 105.8 108.6 101.9 110.3 102.0 104.4 102.8 109.2 105.4 98.1
Production and distribution of electricity 98.5 108.1 105.9 103.4 112.0 102.2 103.8 108.5 107.6 106.5 97.8
Production and distribution of gaseous fuel 91.9 96.7 91.1 72.7 158.9 103.8 130.9 103.8 111.9 95.8 104.1
Supplies of steam and hot water 94.0 105.5 113.4 103.1 110.0 102.6 103.4 94.8 115.1 103.3 98.4
Collection, purifi cation and distribution of water 88.8 104.5 107.6 100.6 96.4 101.1 106.2 101.7 104.7 93.3 98.2
* - preliminary data
Table continuation
Production in the Republic of Kazakhstan
1999 2000 2001 2002 2003 2004 2005 2006 2007 2008
Coal, ‘000 tonnes 58,378 74,872 79,135 73,731 84,907 86,875 86,617 96,231 98,384 111,072
Crude oil, including gas condensate, ‘000 tonnes 30,130 35,317 40,091 47,271 51,451 59,485 61,486 65,003 67,125 70,671
Natural gas (total output), ‘000’000 cu m 9,946 11,542 11,610 14,109 16,597 22,102 24,973 26,382 29,562 32,889
Iron ore, ‘000 tonnes 9,617 16,157 15,886 17,675 19,281 20,303 19,471 22,263 23,834 21,486
Iron pellets, ‘000 tonnes 2,814 6,640 6,107 7,308 8,849 9,447 7,494 8,473 8,572 6,952
Copper ore, ‘000 tonnes 28,773 32,751 34,872 36,703 34,887 30,383 34,067 34,082 31,266 32,566
Chromium ore, ‘000 tonnes 2,406 2,607 2,046 2,370 2,928 3,287 516 269 231 349
Asbestos, ‘000 tonnes 139 233 271 291 355 347 306 315 293 230
Cereals, coarse fl our and gradules and other
grain products, ‘000 tonnes
55,665 38,783 37,520 26,082 29,300 28,802 26,141 35,956 40,235 43,228
Flour of grain and plant crops; mixtures of fi ne
grinding, ‘000 tonnes
1,262 1,741 1,776 2,107 2,123 2,127 2,756 2,850 3,080 3,375
Fresh bread, ‘000 tonnes 450 569 556 538 518 536 565 589 615 655
Sugar, tonnes 228,486 279,715 346,513 390,543 480,255 542,586 528,781 490,247 392,261 508,496
Petroleum products, ‘000 tonnes 5,488 6,241 7,039 7,460 8,648 8,873 10,844 11,202 11,384 11,791
Motor fuel (petrol, including jet fuel), ‘000 tonnes 1,298 1,255 1,582 1,693 1,841 1,928 2,359 2,345 2,633 2,505
Kerosene, including jet fuel of kerosene type,
‘000 tonnes
71 63 109 245 309 294 249 314 385 402
Gasoils (diesel fuel), ‘000 tonnes 1,830 1,954 2,245 2,304 2,754 2,888 3,705 3,888 4,295 4,375
Fuel oil, ‘000 tonnes 2,133 2,391 2,737 2,797 3,069 2,708 3,550 3,333 2,584 3,204
Cement, ‘000 tonnes 838 1,175 2,029 2,129 2,581 3,662 4,181 4,880 5,699 5,837
Marketable concrete, ‘000 tonnes 741 934 1,496 3,508 4,261 6,254 8,946 10,658 15,471 10,108
Cast iron, ‘000 tonnes 3,438 4,011 3,907 4,009 4,138 4,283 3,582 3,369 3,795 3,105
Raw steel, ‘000 tonnes 4,105 4,799 4,691 4,866 5,069 5,372 4,477 4,245 4,784 4,243

328 329
Kazakhstan today
Appendices. Kazakhstan in Figures
1999 2000 2001 2002 2003 2004 2005 2006 2007 2008
Ferroalloys, ‘000 tonnes 1,000 1,092 1,130 1,235 1,401 1,447 1,530 1,614 1,703 1,590
Flat-rolled products, ‘000 tonnes 3,186 3,894 3,888 4,018 3,838 4,040 3,105 3,000 3,441 2,826
Zinc-plated rolled products, ‘000 tonnes 279 364 396 499 709 762 606 580 604 527
Raw aluminium: alumina, ‘000 tonnes 1,158 1,217 1,231 1,387 1,420 1,468 1,505 1,515 1,556 1,713
Raw lead, tonnes 158,890 185,812 158,722 162,175 133,178 157,016 135,446 115,974 117,641 98,184
Raw zinc, tonnes 248,754 262,570 277,073 286,454 294,566 316,731 357,090 364,821 358,226 365,572
Refi ned copper, tonnes 361,890 394,723 425,670 452,989 432,511 445,268 418,356 427,723 406,091 398,411
Electricity, ‘000’000 kWh 47,498 51,635 55,384 58,331 63,866 66,942 67,920 71,669 76,621 80,348
Heating energy, ‘000 Gcal 63,321 65,503 76,398 78,651 85,699 87,325 90,829 83,183 93,218 94,057
Natural water, ‘000’000 cu m 2,125 2,069 2,234 2,201 2,221 2,388 2,350 2,464 2,673 2,788
Table continuation
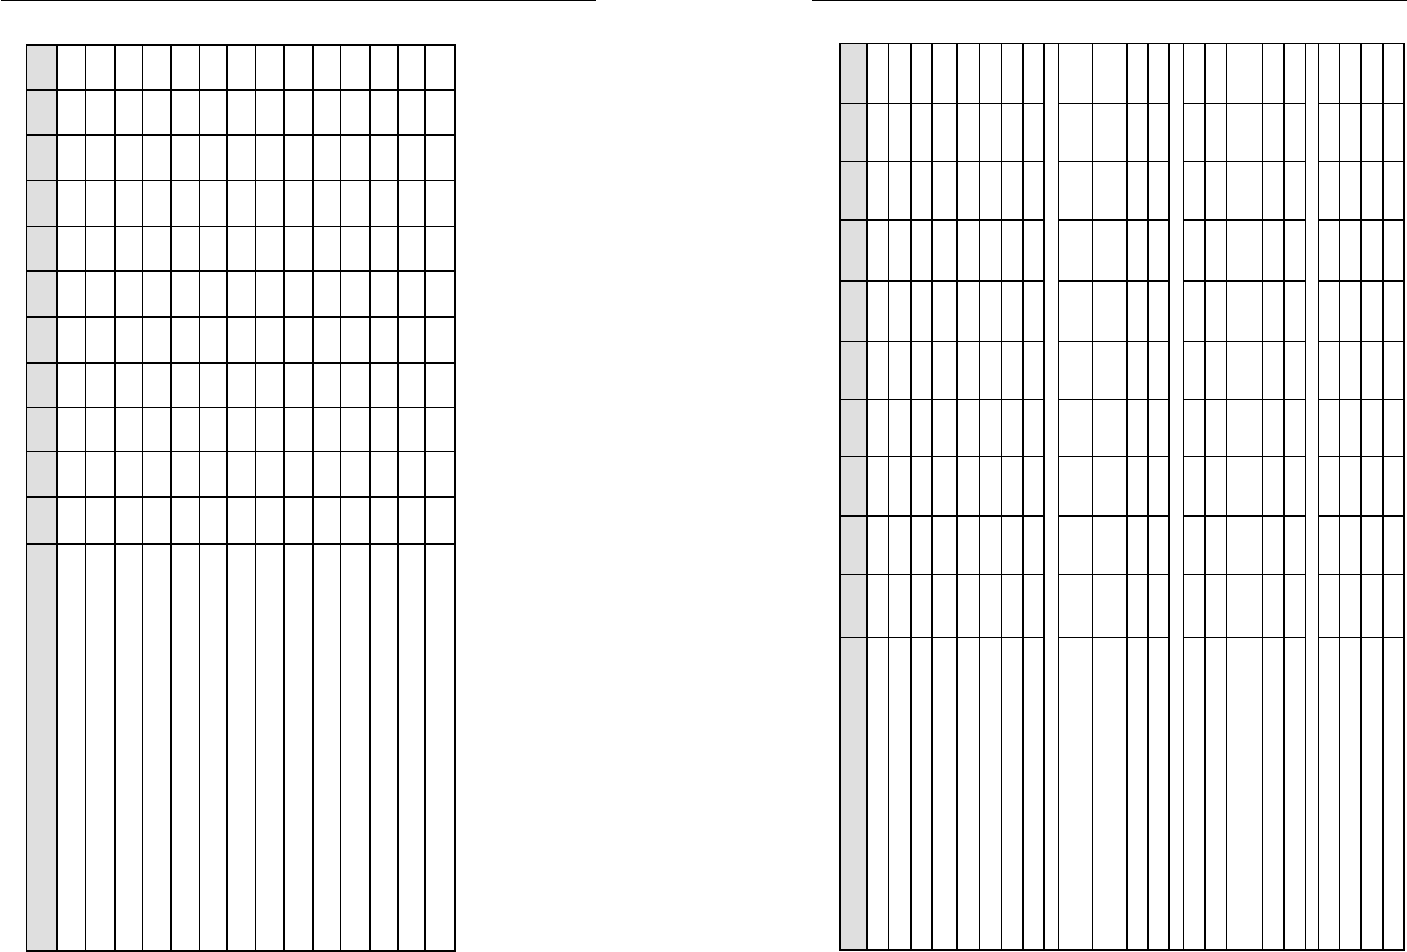
Indices of physical volume of industrial output of the Republic of Kazakhstan by sector in 2009*
% year-on-year
January- January- January- January- January- January- January- January- January- January- January-
January February March April May June July August September October November December
Industry 98.2 96.8 95.4 95.2 95.4 97.3 97.9 98.5 99.0 99.8 100.7 101.7
Extractive sector 104.3 101.5 99.8 99.9 99.9 101.8 103.2 104.0 104.7 105.2 105.7 106.1
Fuel extraction 107 103.3 101.3 101.4 101.4 102.9 104.9 105.9 106.6 106.9 107.2 107.3
Extraction of coal, lignite 77.7 77.2 79.8 79.2 81.1 79.0 81.0 83.0 85.0 87.4 89.7 92.1
Extraction of crude oil and
accompanied gas
108.6 104.6 102.3 102.6 102.4 103.3 105.5 106.5 107.3 107.5 107.7 107.7
Extraction of natural
(combustion) gas
112.4 106.7 105.8 107.2 106.4 106.4 106.9 107.8 108.3 108.4 108.6 108.4
Extractive sector, excluding fuel
extraction
82.7 86.6 87.8 87.8 88.4 92.3 92.0 92.0 92.7 94.1 97.2 99.7
Extraction of iron ore 51.5 62.4 64.5 68.2 68.7 72.7 76.6 81.6 85.1 88.7 95.6 101.1
Extraction of non-ferrous metals 96.4 96.1 97.0 96.3 96.8 101.4 96.6 95.0 94.7 95.3 97.4 98.5
Manufacturing 87.6 88.6 88.2 87.8 88.5 90.5 90.3 90.6 90.8 92.2 93.7 95.5
Production of foodstuffs,
including beverages
97.7 97.9 97.7 96.2 95.6 96.6 96.9 97.3 97.3 97.4 97.8 98.8
Production of tobacco products 88.1 84.4 87.2 88.3 86.7 88.6 90.8 92.6 93.2 92.6 92.4 93.1
Textile and garment industry 104.3 99.0 92.7 88.4 85.2 85.2 86.0 89.0 89.1 86.5 88.6 87.6
Production of leather, leather
products and shoes
92.9 81.5 82.1 88.8 103.9 100.2 94.7 102.7 96.6 93.6 91.9 91.6
Timber industry and production
of wooden items
93.6 91.2 79.2 76.9 80.7 78.8 79.2 82.2 81.1 82.2 85.0 86.3
Pulp and paper industry;
publishing
86.1 86.6 83.4 84.2 81.6 80.9 85.0 93.4 95.0 97.0 99.6 102.1
Production of coke, petroleum
products and nuclear materials
95.6 93.3 93.4 94.0 93.3 95.2 97.0 98.3 100.2 104.2 104.4 105.3
Production of petroleum
products
96.7 93.0 93.5 94.3 93.3 94.8 96.9 97.5 99.2 103.0 102.7 103.7
Chemical industry 71.7 72.5 74.7 75.5 78.4 75.5 72.7 69.9 70.0 69.0 70.0 76.3
Production of rubber and plastic
products
101.0 105.1 108.2 95.5 88.8 89.8 86.1 87.7 88.2 87.8 91.4 92.3
Production of other nonmetal
mineral products
80.3 86.4 84.0 79.0 77.7 79.8 79.6 83.2 85.2 88.4 91.4 92.7
Metallurgy 84.4 85.9 84.7 82.2 85.9 89.9 87.5 86.7 87.6 89.5 92.1 94.3
Ferrous metallurgy 68.5 73.7 77.6 77.5 80.2 85.0 84.0 84.5 87.5 90.6 94.0 96.5
330 331
Kazakhstan today
Appendices. Kazakhstan in Figures
% year-on-year
January- January- January- January- January- January- January- January- January- January- January-
January February March April May June July August September October November December
Production of non-ferrous
metals
98.3 96.6 91.0 90.5 92.2 96.0 92.9 90.4 88.5 89.1 90.0 91.2
Production of fi nished metal
products
93.3 106.6 101.8 98.8 109.6 108.6 99.5 91.2 88.4 89.2 92.6 95.5
Machine-building 69.5 76.1 77.4 75.7 75.5 78.2 77.7 79.5 80.2 81.9 93.8 85.7
Other sectors of industry 88.9 106.8 96.6 95.8 85.7 78.0 75.2 102.9 102.6 110.5 108.4 107.6
Production and distribution
of electricity, gas and water
92.2 92.2 93.3 91.7 92.4 93.5 94.0 94.5 95.0 95.5 97.0 98.1
Production and distribution of
electricity
90.7 90.5 91.7 92.3 92.7 94.0 94.5 94.7 94.8 95.1 96.7 97.8
Production and distribution of
gaseous fuel
95.3 85.9 87.0 90.1 92.0 96.8 103.3 105.9 106.0 104.1 104.7 104.1
Supplies of steam and hot
water
93.9 96.2 97.5 92.4 92.7 93.6 93.6 94.3 95.5 96.0 97.4 98.4
Collection, purifi cation and
distribution of water
92.7 81.8 82.0 81.8 85.3 88.2 89.8 91.7 92.2 92.7 95.0 98.2
* preliminary data
Table continuation
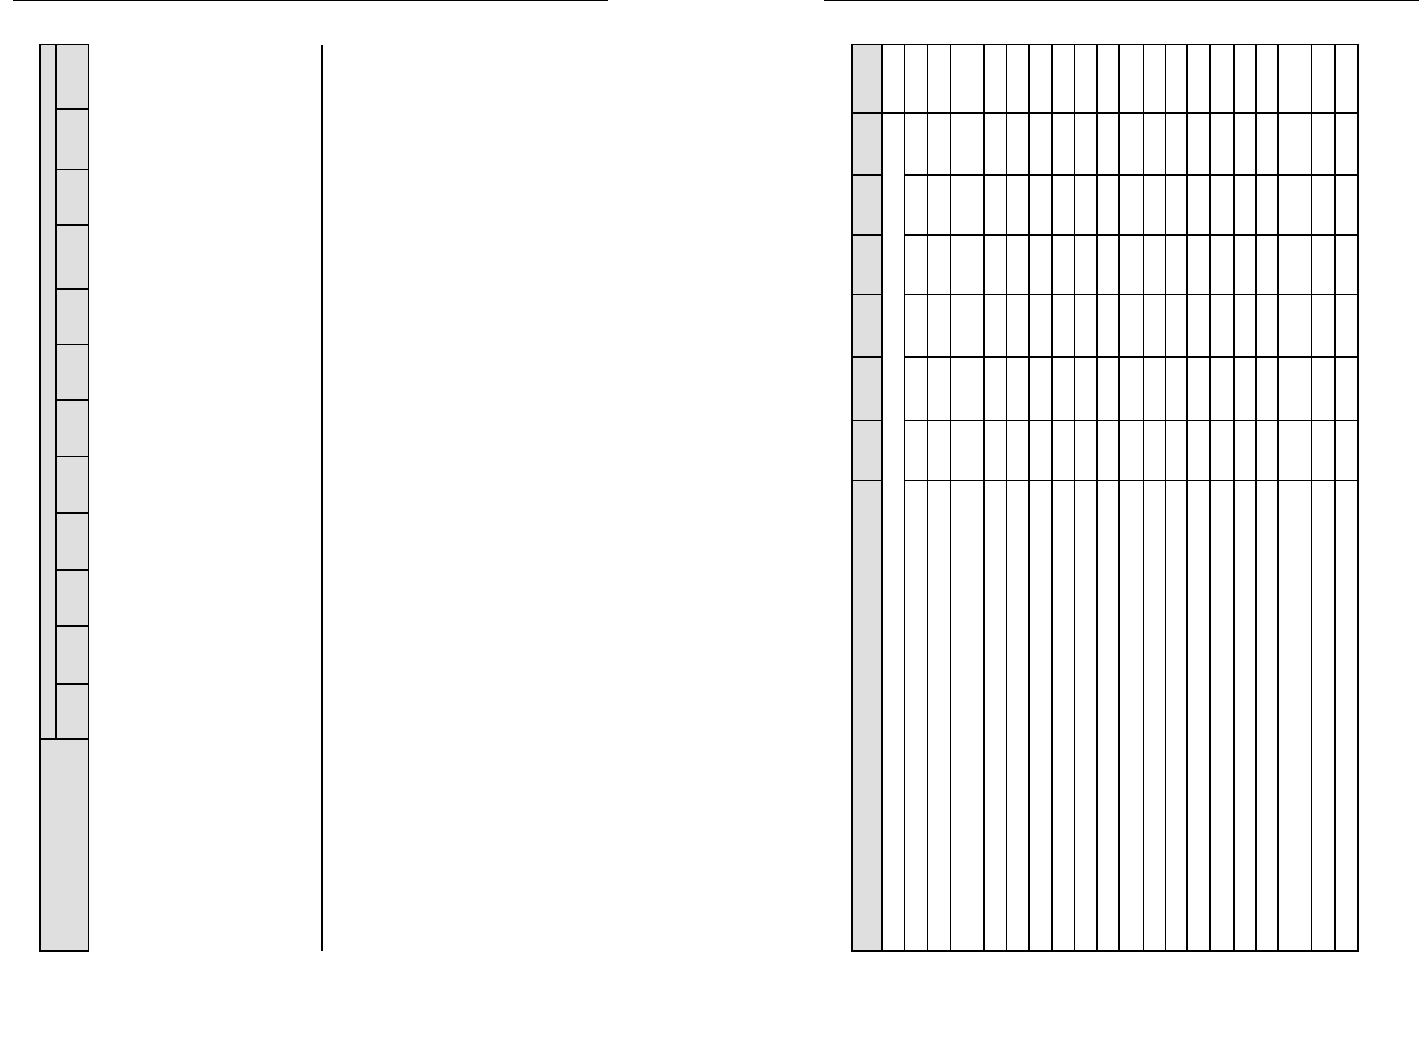
Production of key industrial products in the Republic of Kazakhstan
2003 2004 2005 2006 2007 2008 2009*
Extractive sector
Coal - total, ‘000 tonnes
84,906.5 86,875.1 86,617.3 96,230.5 98,383.9 111,072.3 101,524.2
Crude oil, including gas condensate, ‘000 tonnes
51,451.1 59,484.8 61,486 65,003.1 67,125.3 70,671.0 76,383.5
Crude oil (natural mixture of hydrocarbans), including oil extracted from
bituminous minerals, ‘000 tonnes
45,376.3 50,671.5 50,869.8 54,338.8 55,265.0 58,646.0 64,250.0
Gas condensate, ‘000 tonnes
6,074.8 8,813.3 10,616.2 10,664.3 11,860.3 12,025.0 12,133.5
Natural gas in gaseous state, including accompanied oil gas, ‘000’000 cu m
16,596.9 22,102.1 24,972.9 26,381.6 29,561.5 32,889.3 3,5610.7
Natural gas in gaseous state (marketable output), ‘000’000 cu m
7,195.8 8,969.5 9,516.8 9,664.5 9,791.3 11,708.6 10,972.9
Iron ore, ‘000 tonnes
19,280.9 20,302.5 19,471.1 22,262.6 23,834.1 21,486.3 22,289.6
Iron pellets, ‘000 tonnes
8,849.0 9,447.0 7,494.0 8,473.0 8,572.0 6,951.8 6,182.4
Copper ore, ‘000 tonnes
34,886.8 30,382.8 34,067.1 34,081.8 31,266.0 32,566.3 31,224.8
Copper-zinc ore, ‘000 tonnes
6,189.2 5,970.2 5,786.8 4,644.6 3,897.0 5,248.6 5,034.1
Aluminium ore (bauxites), ‘000 tonnes
4,737.3 4,705.4 4,815.4 4,883.8 4,942.6 5,160.1 5,130.0
Lead in lead concentrate, ‘000 tonnes
37.5 33.0 31.0 48.1 40.2 38.8 39.4
Zinc in zinc concentrate, ‘000 tonnes
393.5 361.4 364.3 404.6 386.0 387.4 418.6
Manganese ore, ‘000 tonnes
2,369.0 2,318.1 2,233.2 2,531.1 2,482 2,485 2,467.7
Chromium ore, ‘000 tonnes
2,927.8 3,287.1 515.9 269.2 231.2 348.5 4,678.0
Natural sand, ‘000 cu m
2,599.6 3,937.4 5,615.3 6,965.9 7,479.9 5,765.0 4,215.9
Granules, chips and stone powders; pebbles, gravels, road metal or
crushed stones, ‘000 tonnes
13,749.2 17,377.2 18,884.0 28,539.2 41,068.2 26,053.2 24,884.8
Salt and pure sodium chloride, tonnes
287,238 347,850 17,8167 416,680 227,643 504,100 213,320
Asbestos, ‘000 tonnes
354.5 346.5 305.5 314.7 292.6 230.1 230.0
* preliminary data for January-December 2009
332 333
Kazakhstan today
Appendices. Kazakhstan in Figures
Production of key industrial products in the Republic of Kazakhstan
2003 2004 2005 2006 2007 2008 2009*
Manufacturing industry
Meat and meat products, tonnes
67,522 68,815 85,625 91,412 110,187 113,466 122,187
Tinned meat, tonnes
1,446 1,869 2,659 3,179 4,702 4,613 4,618
Sausages, tonnes
22,658 23,057 25,065 30,759 38,180 39,983 38,965
Fish processed and tinned, tonnes
22,724 2,3869 28,329 26,984 34,107 38,783 41,020
Fruit and vegetable juices, ‘000 litres
56,980.2 77,297.2 99,458.6 129,997.2 168,035.1 122,509.5 132,162.4
Cotton oil and fractions, tonnes
27,113 28,504 38,395 38,269 27,914 27,338 34,218
Raw sunfl ower oil, tonnes
63,908 70,556 57,559 66,800 71,772 55,056 90,320
Refi ned sunfl ower oil and fractions, tonnes
43,545 52,882 56,295 74,291 83,791 62,162 69,539
Margarine and similar products, tonnes
22,658 25,189 26,893 25,756 29,016 34,133 45,342
Unprocessed milk and cream, tonnes
148,019 154,412 179,673 225,816 258,733 265,508 235,156
Milk and cream in solid state, tonnes
2,138 2,604 4,277 4,444 3,847 3,403 2,861
Butter, tonnes
10,566 13,040 19,736 18,596 19,707 16,598 14,732
Cheese and cottage cheese, tonnes
11,189 13,033 14,952 17,042 17,154 15,473 13,900
Flour of grain and plant crops; mixtures of fi ne grinding, tonnes
2,122,740 2,126,574 2,755,964 2,849,866 3,079,725 3,375,460 3,467,621
Fresh bread, tonnes
517,623 536,235 564,816 588,561 614,569 655,161 640,358
Sugar, tonnes
480,255 542,586 528,781 490,247 392,261 508,496 385,166
Chocolate, confectionary products made of chocolate and sugar, tonnes
48,340 51,932 69,772 74,676 77,569 77,052 90,737
Noodles and other pasta products, tonnes
72,009 79,228 85,092 104,148 124,842 122,395 127,228
Brandies, ‘000 litres
2,213.3 2,797.2 5,430.8 6,278.1 6,115.3 4,292.9 4,427.7
Vodka, spirits with alcohol content by volume no less than 45.5%, ‘000 litres
29,379.1 33,345.1 56,984 54,767.3 49,871.1 45,026.9 39,817.3
Ethyl alcohol, ‘000 litres
18,428.5 18,161.9 28,405.3 27,491.2 26,359.6 23,517.2 19,705.4
Wines, ‘000 litres
39,300.1 40,352.1 52,869.3 36,794.9 19,414.6 13,284.8 11,753.7
Beer, ‘000 litres
234,846.4 278,041.4 323,470.9 363,838.8 410,960.2 360,676.2 360,806.9
Cigars, cheroots, cigarillas, cigarettes, ‘000’000 pieces
25,714.9 28,037.5 30,008.1 30,833.8 31,507.0 28,482.5 26,748.2
Fleece (sheep), washed degreased uncarbonised, uncombed, tonnes
6,027 3,195 1,227 2,668 2,880 803 735
Cotton fi bre, tonnes
132,638 140,070 156,270 145,018 110,471 133,348 97,194
Fabric, ‘000 sq m
25,592.9 20,301.9 35,530.2 56,459.6 43,325.3 43,479.6 34,658.2
Carpets and carpet products, ‘000 sq m
98.9 99.1 105.6 101.5 36.1 2.0 2,9
Leather of cattle or horse skin without hair, ‘000 sq dm
99,821.8 133,468.9 88,110.3 115,401.2 202,728.3 286,731.1 238,757.7
Leather of sheep, goat or pig skin without hair, ‘000 sq dm
32,081.8 44,971.0 1,637.2 1,079.4 295.6 754.3 14.7
2003 2004 2005 2006 2007 2008 2009*
Shoes, excluding sport and protective shoes, ‘000 pairs
809.3 724.3 784.7 780.7 1,107.5 1,213.1 1,218.0
Wooden windows and frames, glass doors and frames and thresholds,
‘000 sq m
373.6 480.1 595 571.6 680.1 672.2 654.2
Wooden built-up construction structures, tonnes
60 203 702 343 653 643 266
Paper and cardboard corrugated perforated or unperforated, in roles or sheets,
tonnes
17,171 23,012 29,102 31,865 38,005 35,853 79,854
Paper or corrugated cardboard boxes and bags, kg
32,867,771 3,6870,302 48,454,551 61,729,843 6,8135,024 60,061,105 57,974,680
Coke and semicoke made of coal, lignite or peat; retort coal, ‘000 tonnes
2,631.0 2,659.3 2,491.9 2,627.5 2,925.0 2,687.7 2,716.8
Motor fuel (petrol, including jet fuel), ‘000 tonnes
1,841.4 1,927.5 2,359.2 2,345.3 2,633.3 2,505.2 2,613.2
Kerosene, including jet fuel of kerosene type (tempurature of destillation
of 150-300 degrees Centigrade), ‘000 tonnes
309.2 294.3 248.7 313.6 385.0 401.6 376.2
Gasoils (diesel fuel), ‘000 tonnes
2,754.1 2,887.6 3,704.7 3,887.5 4,294.5 4,375.1 4,268.4
Fuel oil, ‘000 tonnes
3,069.3 2,708.4 3,549.9 3,333.1 2,583.8 3,203.8 3,255.6
Phosphorus, tonnes
61,410 81,042 83,444 66,267 70,187 80,344 35,445
Mineral or chemical nitric fertilisers, excluding fertilisers in pellets,
forms or similar packaging weighting no more than 10 kg, ‘000 tonnes
27.8 95.1 22.8 54.1 221.8 204.8 205,399.0
Mineral or chemical phospohrous fertilisers, excluding fertilisers in pellets,
forms or similar packaging weighting no more than 10 kg, ‘000 tonnes
112.5 85.0 81.2 51.9 38.6 46.9 45,092.0
Pharmaceutical preparations, thousand tenge
4,025,072 4,731,527 6,364,272 8,148,061 10,177,456 8,401,400 10,820,461
Bottles, jars, fl asks and other glass containers, excluding ampouls; corcks,
leads and other glass closing items, ‘000 pieces
201,817.3 197,349.9 228,931.9 246,195.6 238,157.8 186,825.9 1,374,955.0
Ceramic burnt construction bricks, excluding bricks made of silicic stone fl our
or diatomite dirts, ‘000 cu m
378.7 465.2 681.3 717.5 991.6 695.2 598.5
Cement, ‘000 tonnes
2,581.1 3,662 4,181.2 4,880.2 5,698.6 5,837.3 5,998.2
Lime, tonnes
786,073 858,990 993,544 988,094 1,023,178 905,917 803,580
Silicate and slag bricks, tonnes
545,660 854,443 1,052,873 1,214,039 1,183,476 1,052,085 918,642
Concrete construction ready-built frames, tonnes
1,548,732 1,994,671 2,365,984 2,906,969 1,331,613 1,096,549 911,919
Raw steel, tonnes
5,069,401 5,371,698 4,476,642 4,244,521 4,784,105 4,243,582 4,146,810
Ferroalloys, tonnes
1,401,136 1,447,307 1,530,064 1,614,317 1,702,784 1,590,519 1,468,912
Flat rolled products, tonnes
3,837,781 4,039,709 3,104,724 2,999,610 3,440,708 2,826,202 2,980,293
Tin plate and rolled sheets coated with tin, tonnes
267,035 292,276 222,744 169,564 209,683 174,098 201,167
Raw and semirefi ned silver or in powder, kg
827,377 7,732,961 8,832,103 806,083 722,927 645,627 678,226
Refi ned silver, kg
804,874 707,443 812,095 796,234 707,954 628,763 673,598
Raw and semirefi ned gold or in powder, kg
19,266 19,261 17,875 21,824 22,564 20,825 22,525
Table continuation
334 335
Kazakhstan today
Appendices. Kazakhstan in Figures
2003 2004 2005 2006 2007 2008 2009*
Refi ned gold kg
9,906 9,576 9,774 9,011 8,157 8,205 10,336
Raw alluminium: alumina, tonnes
1,419,761 1,467,966 1,505,415 1,514,749 1,555,859 1,713,818 1,734,965
Raw lead, tonnes
133,178 157,016 135,446 115,974 117,641 105,766 87,829
Raw zinc, tonnes
294,566 316,731 357,090 364,821 358,226 365,572 328,834
Refi ned copper in blocks, excluding sintered, rolled, extruded or blacksmithed,
tonnes
432,511 445,268 418,356 427,723 406,091 398,411 368,133
Centrifugal pumps for fl uids; other pumps; fl uid lifters, pieces
3,271 4,011 7,115 5,758 7,773 10,253 12,900
Oil and gas processing equipment, thousand tenge
215,053 460,154 535,246 365,910 132,750 148,445 397,581
Automated washing machines with capacity of no more than 10 kg of dry
washing, pieces
20,148 49,755 72,827 101,811 126,720 68,175 71,877
Television sets, pieces
503,339 553,619 345,975 410,155 322,518 326,374 286807
Tape recorders and other voice-recording equipment, pieces
77,322 60,616 55,568 46,118 11,237 - 101
Cars, pieces
2,628 3,206 2,268 2,945 6,311 3,271 1,245
Lorries, pieces
103 32 144 1,523 2,043 1,013 353
* preliminary data in January-December 2009
Table continuation
Gross output of agricultural products by all entities
in current prices, million tenge
2003 2004 2005 2006 2007 2008 2009
Total
Kazakhstan 615,368.5 698,832.9 763,843.4 853,312.9 1,121,773.6 1,384,188.4 1,620,280.0
Akmola Oblast 69,900.2 79,347.2 82,007.8 90,032.0 131,005.2 137,973.8 212,051.1
Aktobe Oblast 24,493.1 27,001.8 27,362.5 29,388.8 40,700.6 66,085.9 61,252.7
Almaty Oblast 80,608.9 95,632.8 105,434.8 118,954.7 145,982.1 183,097.8 219,804.6
Atyrau Oblast 6,963.7 7,967.5 9,445.3 10,888.8 13,312.9 17,185.7 17,576.1
East Kazakhstan Oblast 58,173.2 70,020.1 75,118.5 80,290.4 98,504.3 110,205.4 146,952.6
Zhambyl Oblast 36,455.0 42,465.7 45,737.4 45,832.3 60,331.9 63,202.0 84,376.3
West Kazakhstan Oblast 24,168.2 25,335.5 22,917.2 27,049.8 34,729.4 57,965.0 42,140.6
Karaganda Oblast 29,715.1 36,722.7 35,533.3 43,095.3 54,822.2 75,387.4 80,214.3
Kostanai Oblast 84,643.7 92,181.0 108,742.9 130,255.4 188,866.3 237,915.0 241,618.0
Kyzylorda Oblast 13,296.5 16,107.5 16,848.7 18,376.1 24,146.1 29,718.4 33,115.4
Mangistau Oblast 1,348.6 1,627.9 2,385.0 2,633.5 2,870.3 4,282.3 3,239.9
Pavlodar Oblast 25,649.4 33,497.0 36,268.7 39,037.5 50,187.6 53,753.9 78,891.8
North Kazakhstan Oblast 68,377.7 85,135.6 93,979.0 108,947.4 147,471.5 202,234.9 238,340.1
South Kazakhstan Oblast 87,696.9 80,421.9 95,218.9 100,858.1 118,669.4 134,116.2 158,169.4
Astana 2,356.3 3,413.9 4,762.5 5,441.9 7,077.0 7,602.7 1,278.4
Almaty 1,522.0 1,954.8 2,080.9 2,230.9 3,096.8 3,462.0 1,258.7
Crop farming
Kazakhstan 355,717.4 391,249.1 400,217.9 432,491.6 630,795.7 761,117.2 920,152.7
Akmola Oblast 48,223.0 54,139.4 52,848.4 57,588.8 94,050.5 92,724.7 161,219.5
Aktobe Oblast 9,701.3 9,755.0 6,524.9 5,225.9 12,752.8 29,826.4 18,453.0
Almaty Oblast 41,559.4 50,128.0 52,072.3 55,591.4 73,879.2 88,055.9 109,418.6
Atyrau Oblast 1,300.9 1,386.4 1,732.0 1,974.6 3,112.8 4,543.3 2,823.3
East Kazakhstan Oblast 27,263.5 32,477.3 30,607.4 2,713.8 37,740.4 37,817.3 59,579.7
Zhambyl Oblast 22,756.5 25,857.8 26,188.3 23,193.4 34,154.2 30,013.4 47,494.4
West Kazakhstan Oblast 11,632.9 10,799.9 5,660.5 7,345.1 12,260.6 26,216.2 9,847.0
Karaganda Oblast 12,958.5 16,302.8 10,785.2 13,167.0 19,432.3 30,111.6 30,098.5
Kostanai Oblast 47,285.5 48,018.5 56,292.9 70,647.4 115,755.3 147,433.0 144,640.0
Kyzylorda Oblast 8,383.9 10,494.9 10,308.5 10,855.4 15,486.3 18,697.2 21,248.4
Mangistau Oblast 67.9 143.2 604.5 694.3 278.0 1,196.4 382.8
336 337
Kazakhstan today
Appendices. Kazakhstan in Figures
2003 2004 2005 2006 2007 2008 2009
Pavlodar Oblast 11,301.0 15,834.8 15,392.3 15,524.2 24,190.1 21,189.1 42,049.8
North Kazakhstan Oblast 46,779.6 60,363.2 65,422.8 76,836.9 109,381.4 153,622.0 184,246.8
South Kazakhstan Oblast 63,115.7 50,740.7 59,589.1 58,781.0 68,738.1 69,153.1 86,641.6
Astana 2,110.0 3,175.5 4,469.4 5,286.0 6,919.5 7,446.9 1,094.4
Almaty 1,277.8 1,631.7 1,719.4 1,866.4 2,664.2 3,070.7 915.0
Animal husbandry
Kazakhstan 259,651.1 307,583.8 363,625.5 420,821.3 490,977.9 623,071.2 700,127.2
Akmola Oblast 21,677.2 25,207.8 29,159.4 32,443.2 36,954.7 45,249.1 50,831.6
Aktobe Oblast 14,791.8 17,246.8 20,837.6 24,162.9 27,947.8 36,259.5 42,799.7
Almaty Oblast 39,049.5 45,504.8 53,362.5 63,363.3 72,102.9 95,041.9 110,386.0
Atyrau Oblast 5,662.8 6,581.1 7,713.3 8,914.2 10,200.1 12,642.4 14,752.7
East Kazakhstan Oblast 30,909.7 37,542.8 44,511.1 52,376.6 60,763.9 72,388.1 87,372.9
Zhambyl Oblast 13,698.5 16,607.9 19,549.1 22,638.9 26,177.7 33,188.6 36,881.9
West Kazakhstan Oblast 12,535.3 14,535.6 17,256.7 19,704.7 22,468.8 31,748.8 32,293.6
Karaganda Oblast 16,756.6 20,419.9 24,748.1 29,928.3 35,389.9 45,275.8 50,115.7
Kostanai Oblast 37,358.2 44,162.5 52,450.0 59,608.0 73,111.0 90,482.0 96,978.0
Kyzylorda Oblast 4,912.6 5,612.6 6,540.2 7,520.7 8,659.8 11,021.2 11,867.0
Mangistau Oblast 1,280.7 1,484.7 1,780.5 1,939.2 2,592.3 3,085.9 2,857.2
Pavlodar Oblast 14,348.4 17,662.2 20,876.4 23,513.3 25,997.5 32,564.8 36,842.0
North Kazakhstan Oblast 21,598.1 24,772.4 28,556.2 32,110.5 38,090.1 48,612.9 54,093.4
South Kazakhstan Oblast 24,581.2 29,681.2 35,629.8 42,077.1 49,931.3 64,963.1 71,527.8
Astana 246.3 238.4 293.1 155.9 157.5 155.8 184.0
Almaty 244.2 323.1 361.5 364.5 432.6 391.3 343.7
Table continuation
Indicators of Kazakhstan’s foreign trade
million dollars
Continents, countries and group
of countries
2002 2003 2004 2005 2006 2007 2008 2009
Total, of which:
16,254.3 21,335.4 32,877.5 45,201.3 61,927.2 80,511.7 109,072.6 71,604.4
CIS
5,237.6 6,912.9 10,215.1 12,200.6 16,637.5 22,564.6 28,575.2 18,849.0
Other countries
11,016.7 14,422.5 22,662.4 33,000 45,289.7 57,947.2 80,497.3 52,755.4
Europe
4,851.1 6,635.0 14,671.2 21,723.6 30,539.0 35,636.0 51,397.6 32,066.1
EU countries
3,109.6 4,041.8 10,492.4 15,287.1 22,790.1 27,529.5 39,135.2 28,817.3
Non-EU countries
1,741.5 2,593.2 4,178.8 6,436.5 7,748.9 8,106.5 12,262.3 3,248.8
Asia
3,095.0 4,112.8 5,684.6 7,771.3 12,033.7 18,775.6 24,313.1 16,137.9
America
2,991.9 3,598.0 2,219.4 3,389.0 2,508.9 3,065.6 3,894.1 4,323.2
Africa
66.8 55.0 61.8 71.4 158.8 396.0 815.0 171.0
Australia and Oceania
11.9 21.6 25.3 45.2 49.3 73.9 77.7 57.3
Source: Foreign trade statistics of the Kazakh Ministry of Finance’s Customs Control Committee
338 339
Kazakhstan today
Appendices. Kazakhstan in Figures
Main indicators of small entrepreneurship
Year
Number of entities
Number of employees, thousand
people
Production, million tenge
legal
entities
individual
entrepreneurs
farms
legal
entities
individual
entrepreneurs
farms
legal
entities
individual
entrepreneurs
farms
1999 30,172 … … 340.7 … … … … …
2000 33,778 … 76,373 385.0 … 265.5 … … 87,567
2001 39,590 119,038 95,460 428.8 345.6 311 294,844 … 133,475
2002 42,516 169,781 111,434 467.4 351.4 357.3 324,033 78,387 146,288
2003 46,194 215,116 121,722 482.5 438.1 378.7 457,949 107,218 165,056
2004 51,339 247,688 148,011 524.6 474.5 405.8 809,626 155,031 178,007
2005 50,612 297,234 156,978 533.8 571.6 504.7 844,632 222,993 166,956
2006 47,756 358,583 163,721 557.9 622.7 504.3 1,033,438 302,715 185,395
2007 55,865 415,709 169,326 585.9 733.5 542.8 1,327,126 473,648 265,500
2008 58,480 475,841 169,481 464.6 828.9 461.8 1,152,071 437,313 316,083
Main indicators of the development of the transport sphere
Freight traffi c by all means of transport
billion tonne-km
2003 2004 2005 2006 2007 2008
January-
November
2009
Total 258.4 283.1 296.3 328.5 350.5 369.7 305.1
of which:
railways 147.7 163.5 171.9 191.2 200.8 214.9 177.5
other ground 40.2 43.9 47.1 53.8 61.5 63.5 57.4
river 0.07 0.08 0.09 0.04 0.05 0.06 56.9
air, million tonne-km 92.9 66.9 96.7 69.9 88.1 69.4 59
pipelines 70.4 75.6 77.1 83.3 87.8 90.3 68.7
naval 0.3 0.8 1.3
Passenger traffi c by all means of transport
million passenger-km
2003 2004 2005 2006 2007 2008
January-
November
2009
Total 94,806 100,305 107,600 118,824 124,366 127,455 117,234.1
of which:
railways 10,686 11,849 12,136 13,670 14,587 14,719 13,311
coaches and buses 55,676 59,291 63,831 70,429 72,224 73,900 72,116.3
taxi 25,148 25,950 27,820 30,436 31,655 32,978 26,601.5
trolleybuses 288 248 221 192 146 108 92.4
trams 353 329 327 310 296 255 229.3
river 0.9 0.5 0.5 0.4 0.6 0.8 1.5
air 2,654 2,638 3,265 3,787 5,457 5,495 4,882