Seminario J.M. Molecular and Nano Electronics. Analysis, Design and Simulation
Подождите немного. Документ загружается.

124 Yuefei Ma and Jorge M. Seminario
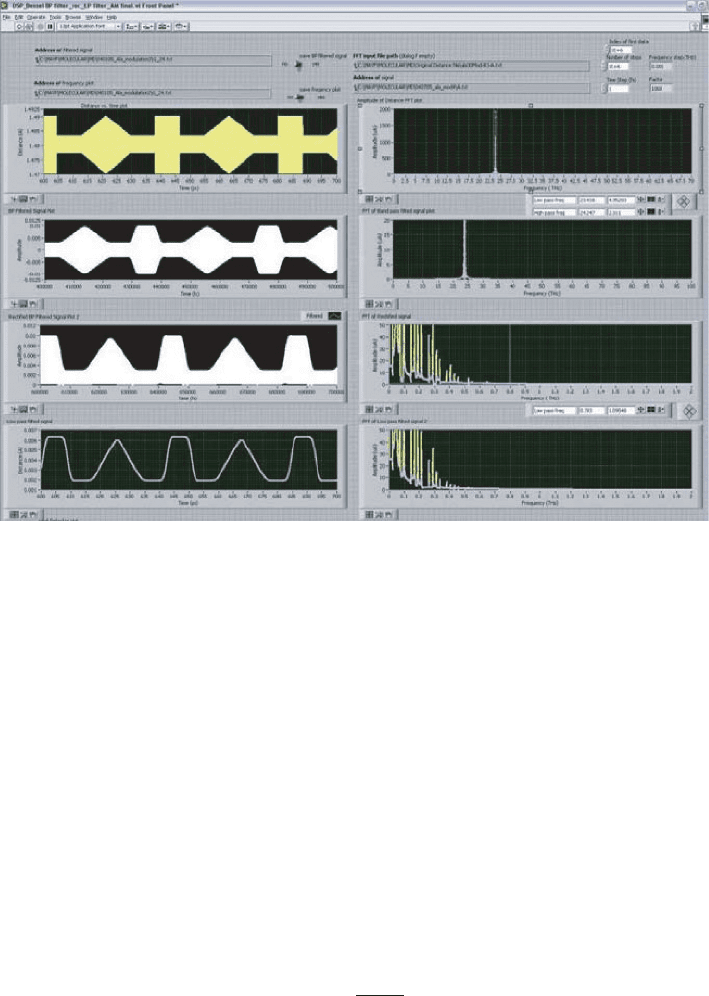
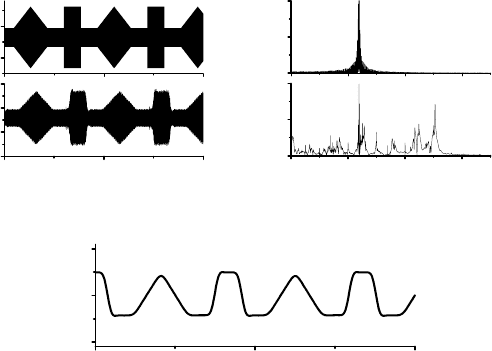
Figure 21 Front panel of Labview program to recover AM signal. The input fields are located
on the top of the panel; the output time-domain signals (lower left) and their corresponding
frequency-domain signals (lower right) are shown
the sampling interval, i.e., the time steps that has been used to record the trajectory
data; the cut-off frequencies for the bandpass filter and lowpass filter. Because the fast
Fourier transform of the trajectory data is needed for the selection of cutoff frequencies,
the last two inputs are specified when the program is running, instead of before the
program starts. The output signals are visualized in the front panel as well.
The program is constructed using a sequence structure in which each diagram, or
frame, executes sequentially. This structure is chosen because of its ease of data mani-
pulation. In the first diagram which primarily prepares the signal data for analysis, the
program reads the data from the selected file and transforms it into a one-dimensional
array. It is preferable to skip the initial part of the signal since it may contain excessive
noise due to large vibration. The DC series of the data, i.e., the mean value, is extracted
from the data so that only the AC signal is remained. Frequency spacing f is also
calculated in this diagram:
f =
1
N ·t
(5)
where f is the frequency resolution, N is the number of data and t is the sampling
interval. The input data is plot in a waveform graph shown as the first one in the
left column of Figure 21. To perform the bandpass filtering of the input AC data,
the user needs to manually select the cutoff frequencies of the bandpass filter by
Analysis of programmable molecular electronic systems 125
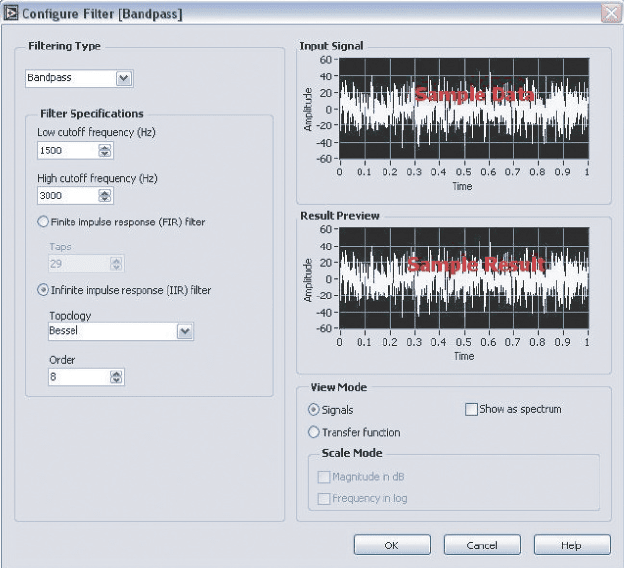
Figure 22 Front panel of the bandpass sub-program
dragging the vertical cursors in the interactive graph of the frequency-domain signal
(shown as the first one in the right column of Figure 21). The values of the cutoff
frequencies are inputted into the Bandpass sub-program, whose front panel is shown in
Figure 22.
The infinite impulse response (IIR) Bessel filter is the right choice for bandpass filter
since it has maximally flat response in both magnitude and phase and nearly linear-phase
response in the passband [94]. The rectification is realized by simply using a Labview
sub-program which returns the absolute value of each data point. The lowpass filtering
of the rectified signal is similar to the bandpass filter in the previous step. The topology
of the lowpass filter is also the Bessel IIR filter. The difference is that the user only
needs to select the high frequency limit for the filter.
The lowpass filtering can be replaced by a peak detector which finds the location
and amplitude of the input signal. The resulting signal is similar to the lowpass filtered
signal.
5.4.4. Recovering frequency-modulated signal
The demodulation of the FM signal is carried out by means of slope detector. First, the
time-domain AC series, which is obtained as described in the AM signal recovery, is
126 Yuefei Ma and Jorge M. Seminario
filtered using a Bessel bandpass filter centered at carrier frequency. Then the bandpass
filtered signal is clipped to constraint the amplitude variation and thus eliminating the
thermal noise due to the finite temperature. The clipped signal is demodulated by a slope
demodulator, a special Bessel bandpass filter, which has a center frequency slightly
larger than the carrier frequency, and the entire frequency variation of the FM signal
falls on the linear part of the left slope of the frequency response curve of the filter
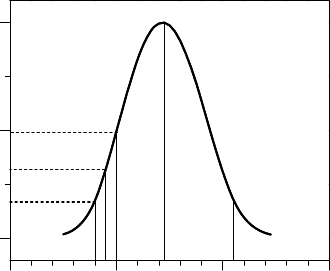
[92]. Figure 23 shows the frequency response of the slope detector used to demodulate
signal transmitted through molecule GLY58. Since the carrier frequency is 23.81 THz
and the frequency variation of the bandpass filtered signal is ±02THz, the center and
bandwidth of the slope demodulator are set to 24.9 and 2.6 THz, respectively. Finally,
the signal is recovered by passing the slope-detected wave through a full wave rectifier
and a lowpass filter.
The Labview program to recover the FM signal is essentially similar to the amplitude
modulated one with two additional steps. The first one is a clipper after the bandpass
filter to eliminate excessive noise. The clipper is realized by a sub-program, which clips
the elements to within the boundary defined by upper and lower limits. The limits are
set by the user in interactive waveform graph. If x
i
represents the original data, a and b
represents the upper and lower limits, respectively, the clipped data y
i
is
y
i
=
⎧
⎨
⎩
ax
i
>a
x
i
b<x
i
<a
bx
i
<b
(6)
After the clipper, there is a demodulator to demodulate the frequency-modulated signal.
The demodulator is basically a Bessel bandpass filter. The difference between this filter
and the filters in the previous section is that it has different center and bandwidth.
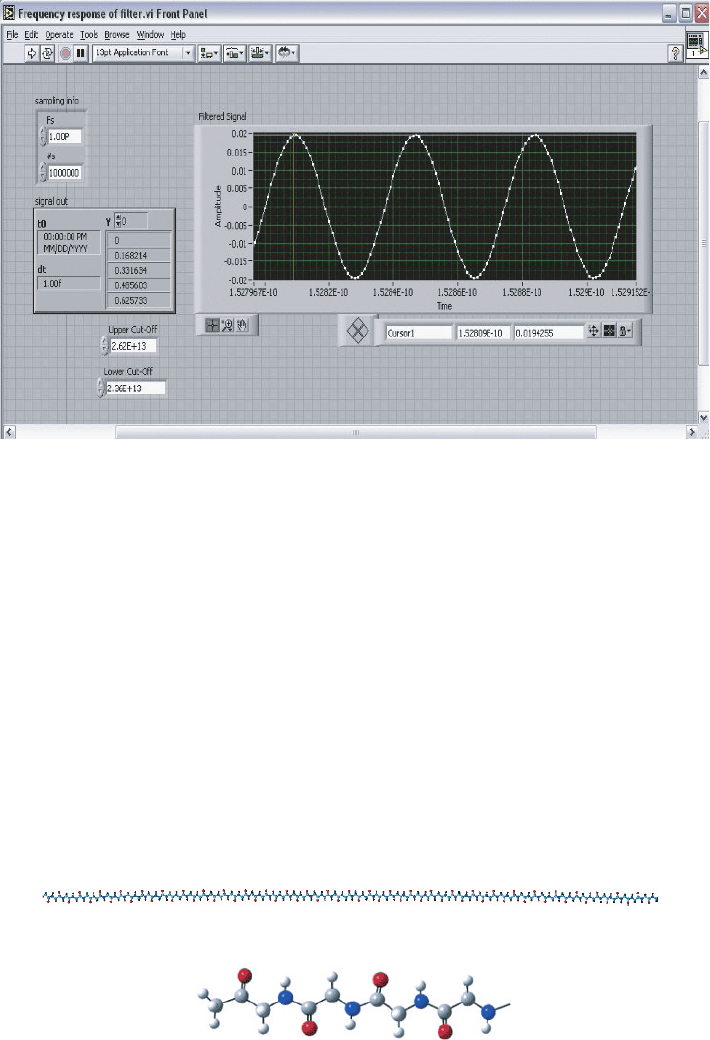
Frequency response of the filter is necessary to find the correct bandwidth and center.
Figure 24 shows the Labview program for obtaining frequency response. By varying the
0.0
0.5
22
24
26
28
1.0
A
f
c
f
c
+
Δ
f
f
c
–
Δ
f
f
L
f
0
f
H
Figure 23 Frequency response of the slope demodulator, a special Bessel bandpass filter, used
for FM signal demodulation; the center frequency f
0
is 24.9 THz and the bandwidth is 2.6 THz.
The lower and upper cutoff frequencies of the slope demodulator, f
L
and f
H
, are 23.6 and
26.2 THz, respectively. The carrier signal has a center frequency f
c
of 23.81 THz and frequency
variation f of 0.2 THz
Analysis of programmable molecular electronic systems 127
Figure 24 Front panel of Labview program for obtaining frequency response of a bandpass filter
frequency of the input sinusoidal signal, the amplitude of the filtered signal is recorded
and plotted versus the input frequency.
5.5. Simulation results of molecular vibrational signal transmission
Molecular dynamics simulation of molecular vibrational signal transmission is carried
out for molecule GLY58 (Figure 25) at room temperature (298.1 K) for 1 ns. The
sampling time, i.e., the time step is 1 fs and total number of steps is 1,000,000. The total
length of the molecule is around 218Å. The intrinsic vibrational mode of the backbone of
this molecule is 23.81 THz.
CDEFGHBAX
F
1
F
2
(a)
(b)
Figure 25 (a) Molecular structure of GLY58; (b) detailed structure of GLY58 at one end of the
molecule. The grey atoms are Carbon (C); the blue Nitrogen (N); the red Oxygen (O); the white
Hydrogen (H) [95]
128 Yuefei Ma and Jorge M. Seminario
During MD simulation, two carbon atoms, F
1
and F
2
, from each cap are held fixed.
Input signals are coupled to the carbon atom X that is bonded to F1 at left. The signals
are detected at different sites A, B, C, D, E, F, G and H in the backbone of GLY58 as
shown in Figure 25. Sites A, B, C, D, E, F, G and H are located at 1.4, 8.3, 34, 67, 90,
116, 142, 168 Å from the input site, respectively.
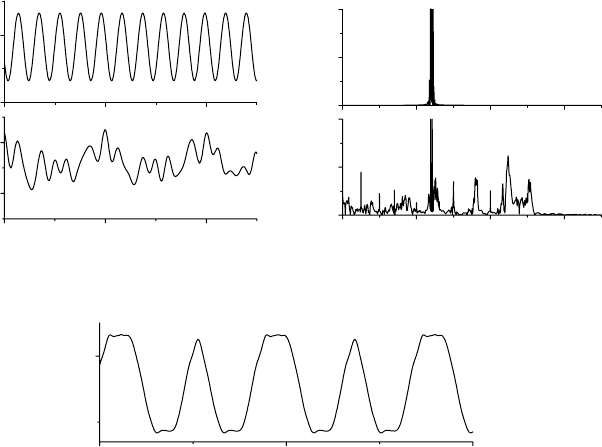
5.5.1. Amplitude-modulated signal transmission
Amplitude-modulated signal is injected into the molecule GLY58 by coupling the input
signal into the movement of carbon atom X. Figures 26a and b show the time-domain and
frequency-domain signals detected from site A (1.4 Å from the input site X in Figure 25a)
and site E (90 Å from the input site X), respectively. In the frequency-domain signal, the
carrier frequency is clearly shown as a peak in 23.81 THz. Apparently, the frequency-
domain signal carries not only the carriers signal, shown as a peak at 23.81 THz in
Figure 26d, but also other molecular vibrational signal due to thermal noise, solvent
effect, etc. The modulating signal is recovered as described in the previous section. The
Bessel bandpass filter is centered at 23.81 THz with a bandwidth of 0.7 THz. The Bessel
lowpass filter has the cutoff frequency of 0.5 THz. The recovered signal is shown in
Figure 26c. The similarity between the original modulating signal and the recovered
signal clearly tells us that the recovered signal is the original modulating signal that
propagates from the site X.
600 650 700
600 650 700
1.352
1.354
1.356
1.358
d (
Å
)
t (ps)
1.49
1.50
(a) (b)
A (µÅ)
0
10
20
0
50
100
1.355
1.356
1.357
d (Å)
(c)
0204060
f (THz)
t (ps)
Figure 26 Signal transmission along GLY58 using amplitude modulation by a carrier at 23.81
THz. (a) Time-domain vibrational signal detected at a remote site A (upper plot) and E (lower
plot); (b) frequency-domain vibrational signal at site A (upper) and E (lower); (c) signal recovered
using DSP techniques [95]
Analysis of programmable molecular electronic systems 129
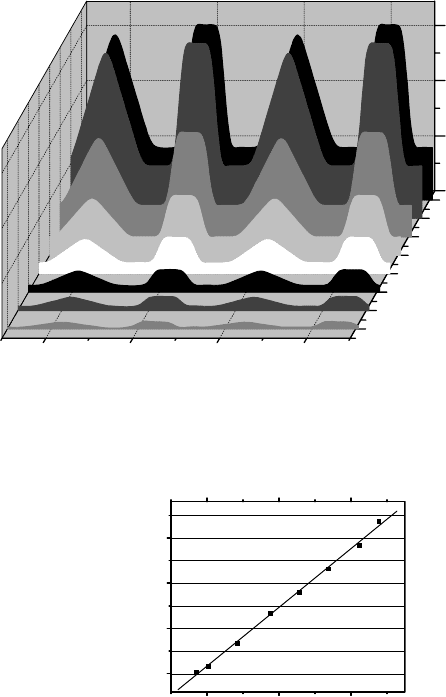
5.5.2. Time delay of molecular vibrational signal transmission using AM
Figure 27 shows the recovered AM AC signals at different sites in molecule GLY58 as
indicated in Figure 25a. The average velocity of the vibronic signal can be determined
following the time delays as signal propagates along the molecule. From Figure 27, the
peak of the first triangle-shaped signal is located at 617.705 ps at site A and 622.775 ps
at site H. The distance between site A and H is 166.6 Å. This yields a speed of 3286 m/s.
When this type of information is collected at all sites, an average speed of 3279 m/s will
be obtained (Figure 28). Although this speed is at least one order of magnitude smaller
than the speed of electrons in a bulk semiconductor, the advantage of our vibronic
approach is that the energy needed to transfer one bit of information is a fraction of eV
as compared to the few ten-thousands of eV needed under the present electron current
approaches.
0.000
0.002
0.004
0.006
A
B
C
D
E
F
G
H
620 640 660 680
t (ps)
d (mÅ)
Figure 27 Detected AM AC signals in molecule GLY58 at different sites as indicated in
Figure 25a [95]
0
618 620 622
50
100
150
d (Å)
t (ps)
Figure 28 Distance vs time-delays of the first triangle apex from AM signals in Figure 27 [95]
130 Yuefei Ma and Jorge M. Seminario
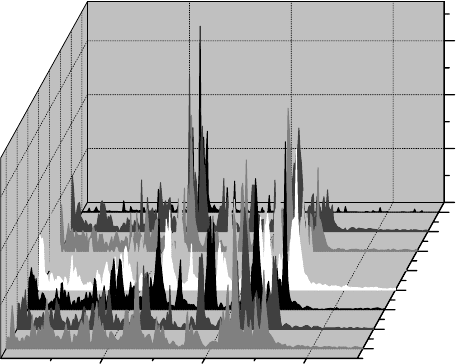
5.5.3. Noise and attenuation of molecular vibrational signal transmission
using AM
Signal-to-noise ratio is a determining factor in any data processing systems. As signal
travels, its amplitude decreases to the point that is washed out by the noise (usually
thermal noise). Amplitude modulation is prone to this as noise simply adds to the signal.
The vibronic approach is suited to interconnect molecular and nano devices that cannot
be interconnected by standard lithographic techniques, thus in the range of nanometers.
Figure 27 shows that the signal keeps its original shape after it travels to site G at
14.2 nm, which is a reasonable distance for a nanosized circuit. However, the amplitude
of the signal at the carrier frequency, which is 23.81 THz, attenuates (Figure 29). The
distance dependence of the amplitude shows that the amplitude attenuates exponentially
with a factor of 00195 Å
−1
(Figure 30). Thus, for a distance of 1.0 nm, the signal
amplitude is still 82.3% of its original amplitude.
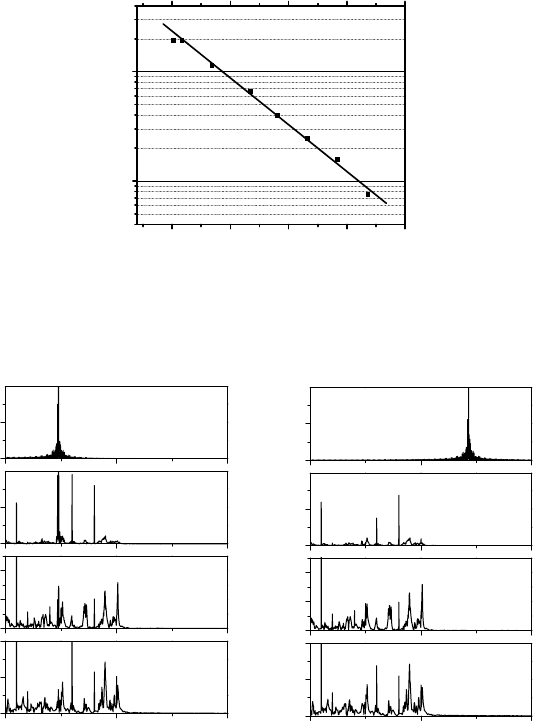
5.5.4. Effects of different carrier frequencies on AM signal transmission
When signals are coupled to atom X (forced movement of X), the atom that is directly
bonded to X will also be driven to vibrate at the applied frequency; and this atom
will again drive another bonded atom. As this process progresses, the vibrational signal
propagates. As is discussed before, the carrier frequency of the signal should be one of
the intrinsic vibrational frequencies of the backbone in the molecule.
We compare the response to two signals with different carrier frequencies: one at
23.81 THz corresponding to one of the intrinsic vibrational mode; and the other at
71.43 THz corresponding to a frequency range with no intrinsic vibrational modes.
Figure 31 compares the evolution of these two signals. Notice that the later signal at
0
5
10
15
A
B
C
D
E
F
G
H
20 40 60
A (µÅ)
f (THz)
Figure 29 Detected frequency-domain AM signals in molecule GLY58 at different sites as
indicated in Figure 25a [95]
Analysis of programmable molecular electronic systems 131
100
0 50 100 150 200
1000
A (µÅ)
d (Å)
Figure 30 Attenuation of the AM signal along molecule GLY58 [95]
10
0
0
0 50 100
0 50 100
20
H
f (THz)
f (THz)
0
10
20
F
0
50
B
0
50
10
20
0
10
20
0
50
0
50
A
H
F
B
A
A (µÅ)
A (
µÅ)
(a) (b)
Figure 31 Frequency response of GLY58 of different AM carrier frequencies. (a) Frequency
spectrums at sites A, B, F and H under excitation frequency of 23.81 THz; (b) frequency spectrums
at sites A, B, F and H under excitation frequency of 71.43 THZ [95]
71.43 THz is much faster than the former that corresponds to an intrinsic mode of the
polypeptide; actually, it almost dissolved immediately after it propagates through site A.
5.5.5. Molecular vibrational signal transmission using frequency modulation
Frequency-modulated signal is injected into the molecule GLY58 by coupling the input
signal into the movement of carbon atom X as indicated in Figure 25. The time-domain
signal at site A, 1.4 Å from the input site X, is shown in the upper plot of Figure 32a.
Since the signal is only varied by frequency, it is difficult to distinguish the change in
the time domain. In the frequency-domain signal (upper plot of Figure 32b), the carrier
132 Yuefei Ma and Jorge M. Seminario
0
10
20
f (THz)
0
50
100
(a)
(b)
A (μÅ)
1.354
1.356
t (ps)
1.48
1.50
d (Å)
11.0 11.2 11.4 0 20 40 60
1.355
(c)
d (Å)
600 650 700
t (ps)
Figure 32 Signal transmission along GLY58 using frequency modulation by a carrier at
23.81 THz. (a) Time-domain vibrational signal detected at a remote site A (upper plot) and G
(lower plot); (b) frequency-domain vibrational signal at site A (upper) and G (lower); (c) signal
recovered using DSP techniques [95]
frequency is clearly shown as a peak in 23.81 THz. Figure 32a and 32b also show the
time- and frequency-domain signals detected at site G, which is 142 Å from the input
site.
The modulating signal is recovered as described in Section 5.4.2. The first Bessel
bandpass filter is centered at 23.81 THz with a bandwidth of 1.0 THz. The bandpassed
AC signal is clipped to constrain the amplitude variation to ±200 Å. The slope demod-
ulator is centered at 24.9 THz with a bandwidth of 2.6 THz and the Bessel lowpass filter
has a cutoff frequency of 0.5 THz. The recovered signal is shown in Figure 32c.
5.6. Using molecular potential to process information
For any molecular system, there is an electrostatic potential . The electrostatic poten-
tial at a point P is defined as the reversible work per unit charge needed to move an
infinitesimal test charge Q
t
from infinity to P [96]. The molecule can be viewed as a col-
lection of point-charge nuclei and electronic charge smeared out into a continuous distri-
bution. The probability of finding a molecular electron in a volume dV =dxdydz is [96]
x y z =n
allm
x
···
x y z x
2
z
n
m
s1
m
sn
2
dx
2
dz
n
(7)

Analysis of programmable molecular electronic systems 133
where is the electronic wave function of the system comprising n electrons, and
x
1
z
n
m
s1
m
sn
2
dx
1
dy
1
dz
1
dx
n
dy
n
dz
z
is the probability of simulta-
neously finding electron 1 with spin m
s1
in the volume dx
1
dy
1
dz
1
at
x
1
y
1
z
1
,
electron 2 with spin m
s2
in the volume dx
2
dy
2
dz
2
at
x
2
y
2
z
2
, and so on [96]. The
wave function can be obtained by solving Schrödinger equation numerically using
Gaussian 03 program.
Knowing the probability, we know the amount of electronic charge in dV is −edV .
The molecular electrostatic potential is the addition of the molecular electric charge
and of the nuclei . Thus, the molecular electrostatic potential at point
x
1
y
1
z
1
can
be expressed as [96]
x
1
y
1
z
1
=
Z
r
1
−
x
2
y
2
z
2
r
12
dx
2
dy
2
dz
2
(8)
where Z
is the nuclei charge, r
12
is the distance between points 1 and 2 and the
integration is over the entire space. Likewise, the molecular electrostatic potential is
calculated using the Gaussian 03 program.
As an example, the molecular electrostatic potentials of water are plotted as in
Figure 33. Positive and negative potentials can be easily distinguished by the color:
positive is blue and cyan, and negative is red and yellow. Although the regions around
the nuclei show positive potential, the sites outside the molecule show potential either
positive (blue) or negative (red) depending on electron distributions around the molecule.
For the singlet ground state (Figure 33a). the negative potential is located at the lower
sites of the molecule; while for the triplet excited state, which is less angular, the
negative effect of the electrons can be seen on both sites of the molecule.
The molecular electrostatic potential can be modified by external fields or excitations.
For instance, the molecule triflourobenzene is excited by two water molecules conve-
niently located to produce four possible inputs (Figure 34), Assuming positive voltage is
“1” and negative is “0”, then if we record the potential at the right site of the hydrogen
atom, the truth table can be generated (Figure 35). Thus, the molecular system performs
as an AND gate.
–0.1 V
0
V
0.1
V
Figure 33 Molecular electrostatic potential [15]