Satas D., Tracton A.A. (ed.). Coatings Technology Handbook
Подождите немного. Документ загружается.

22
CHAN AND VENKATRAMAN
apex of the drop (see Fig.
3).
Tables showing the values of
1/H
as
a function of
S
are
available.'""'
Recently there have been a number of significant improvements
in
both data acquisi-
tion and analysis of the pendant-drop profiles.''"' The photographic recording and mea-
surement of the pendant drop are replaced by direct digitization of a video image. The
ability
to
measure the entire drop profile has led to the development of new algorithms
for the drop-profile analysis.'".''
2.2
Viscosity
The shear viscosity is defined as the ratio
of
the shear stress
to
the shear strain rate,
at
the strain rate of interest. Although the viscosity is usually quoted
as
a number without
reference
to
the strain rate, it is really a function of strain rate. The strain rate dependence
and,
in
certain situations, the time dependence,
of
the viscosity need to be determined
if
a meaningful correlation is
to
be made with coating phenomena. In the case
of
coatings,
the shear strain rate range
of
interest extends from about a few thousand reciprocal seconds
(during spraying, for instance) down to a hundredth
of
a reciprocal second (following
application).
A variety
of
techniques is available
to
measure viscosity of coating formulations.
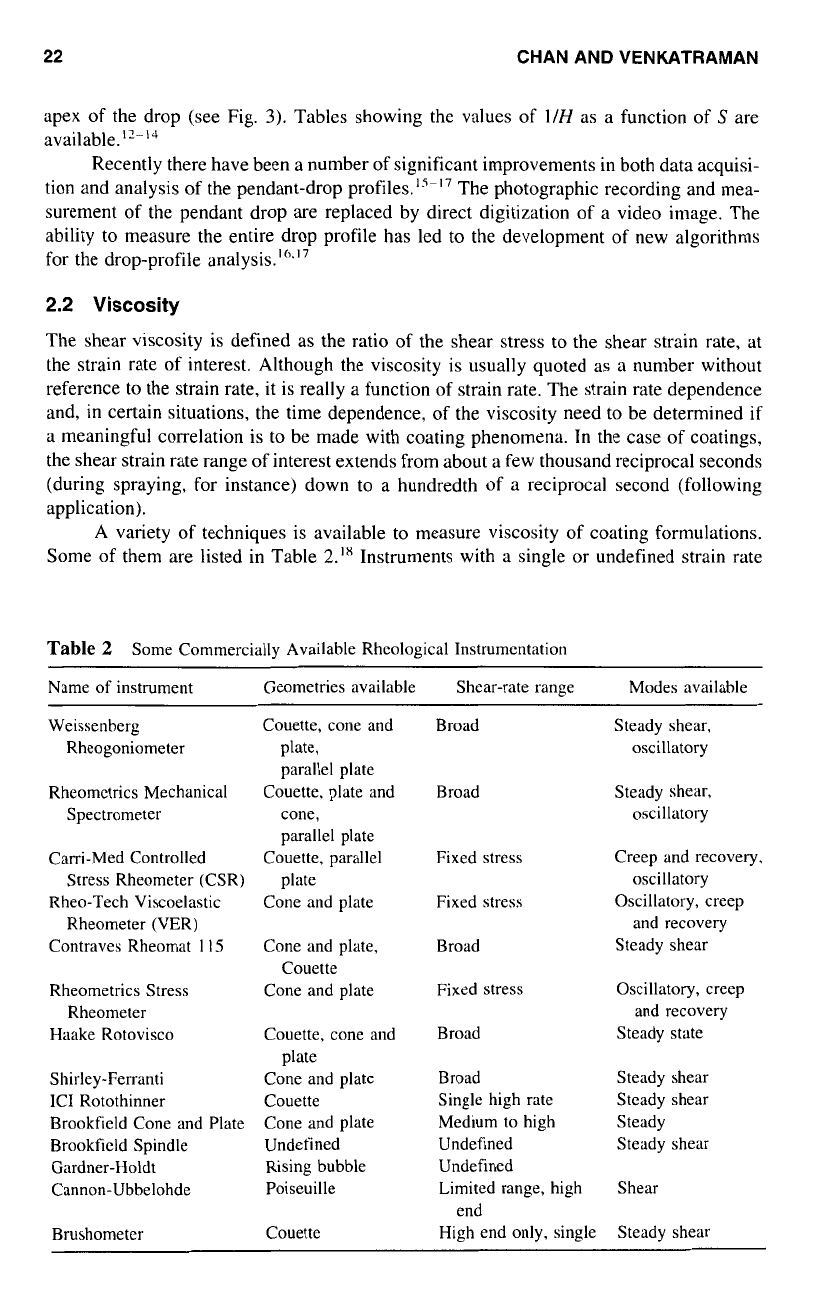
Some of them are listed in Table
2."
Instruments with a single or undefined strain rate
Table
2
Some Commercially Available Rheological Instrumentation
Name of instrument Geometries available Shcar-rate range Modes available
Weissenberg
Rheogoniometer
Rheomctrics Mechanical
Spectrometer
Carri-Med Controlled
Stress Rheometer (CSR)
Rheo-Tech Viscoelastic
Rheometer (VER)
Contraves Rheomat
1
15
Rheometrics Stress
Rheometer
Haake Rotovisco
Shirley-Ferranti
IC1 Rotothinner
Brookfield Cone and Plate
Brookfield Spindle
Gardner-Holdt
Cannon-Ubbelohde
Brushometer
Couette, cone and
plate,
parallel plate
Couette, plate and
cone,
parallel plate
Couette, parallel
plate
Cone and plate
Cone and plate,
Cone and plate
Couette
Couette, cone and
plate
Cone and plate
Couette
Cone and plate
Undefined
Rising bubble
Poiseuille
Couette
Broad
Broad
Fixed stress
Fixed stress
Broad
Fixed stress
Broad
Broad
Single high rate
Medium to high
Undefined
Undefined
Limited range, high
High end only, single
end
Steady shear,
oscillatory
Steady shear,
oscillatory
Creep and recovery.
oscillatory
Oscillatory, creep
and recovery
Steady shear
Oscillatory, creep
and recovery
Steady state
Steady shear
Steady shear
Steady
Steady shear
Shear
Steady shear
COATING
RHEOLOGY
23
should be avoided in the study of coating rheology, if meaningful correlations are to be
made with coating phenomena, the viscosity must be measured over a wide range
of
strain
rates.
The most acceptable technique for determining the strain-rate dependence of the
viscosity is the use of the constant rate-of-strain experiment in torsion. This can be done
in
either a cone-and-plate (for low rates) or a concentric cylinder geometry (for higher
rates). However, the oscillatory, or dynamic measurement is also commonly employed
for the same purpose. It is assumed that the shear strain rate and the frequency are equiva-
lent quantities and the complex viscosity is equal to the steady state constant rate viscosity
(i.e., the Cox-Merz rule is valid). The applicability of the Cox-Merz rule, however, is
by no means universal, and its validity must be demonstrated before the dynamic measure-
ments can be substituted for the steady-state ones. The capillary technique. as employed
in
several commercial instruments, is not suitable for coating studies in general, because
it is more suitable for measuring viscosity at higher strain rates.
2.3
Thixotropy
Thixotropy is a much abused term in the coatings industry. In this review, we shall define
the phenomenon of thixotropy as the particular case
of
the time dependence of the viscosity,
that is its decrease during a constant rate-of-strain experiment. This time dependence
manifests itself in hysteresis
in
experiments involving increasing and decreasing rates of
strain. The area under the hysteresis loop has been used as a quantitative estimate of
thixotropy, although its validity is still a matter
of
debate.'*.'" Another attempt at quantify-
ing thixotropy'" involves the measurement
of
a peak stress
(a,,)
and
a
stress at a long
time
(am)
in
a constant rate-of-strain experiment. In this instance, the thixotropy index
p
is defined as:
(4)
The utility of these different definitions is still unclear, and their correlation to coating
phenomena is even less certain.
In a purely phenomenological sense, thixotropy can be studied by monitoring the
time-dependence
of
the viscosity, at constant rates
of
strain. Quantification
of
the property
is, however, rather arbitrary. The coefficient of thixotropy,
p,
appears to be the most
reasonable, and is measurable in torsional rheometers such as those mentioned in Table
2.
It should be noted that this index,
as
defined above. increases with increase in the rate
of
strain. In addition, the thixotropic behavior is influenced considerably by the shear
history of the material. In comparative measurements, care should be taken
to
ensure a
similar or identical history for all samples. The phenomenon of thixotropy is also responsi-
ble for the increase in viscosity after the cessation of shear.
If
after a constant rate-of
strain experiment, the material viscosity is monitored using a sinusoidal technique, it will
be found to increase
to
a value characteristic of a low shear rate-of-strain measurement.
2.4
Dilatancy
The original definition ofdilatancy,2' an increase
in
viscosity with increasing rate of strain,
is still the most widely accepted one today."-'4 The term has been used, however,
to
mean the opposite
of
thixotropy.'5 The constant rate-of-strain experiment, outlined above
24
CHAN AND VENKATRAMAN
for viscosity measurements, can obviously be employed to determine shear thickening, or
dilatancy
2.5
Yield Stress
In the case of fluids, the yield stress is defined as the minimum shear stress required
to
initiate flow. It is also commonly referred to as the “Bingham” stress, and a material that
exhibits a yield stress is commonly known as a “Bingham plastic” or viscoplastic.’(‘
Though easily defined, this quantity is not as easily measured. Its importance in coating
phenomena is, however, quite widely accepted.
The most direct method of measuring this stress is by creep experiments in shear.
This can be accomplished in the so-called stress-controlled rheometers (see Table
2).
The
minimum stress that can be imposed on a sample varies with the type of instrument, but
by the judicious use
of
geometry, stress (in shear) in the range
of
1
to
S
dyneskm‘ can
be applied. This is the range
of
yield stresses exhibited by most paints with a low level
of solids. However, the detection of flow is not straightforward. In the conventional sense.
the measured strain in the sample must attain linearity in time when permanent flow
occurs. This may necessitate the measurement over a long period of time.
An estimate of the yield stress may be obtained from constant rate-of-strain measure-
ments of stress and viscosity. When the viscosity is plotted against stress, its magnitude
appears to approach infinity at low stresses. The asymptote on the stress axis gives an
estimate
of
the yield stress.
Another method used is the stress relaxation measurement after the imposition of a
step strain.
For
materials exhibiting viscoplasticity, the stress decays to a nonzero value
which is taken as the estimate of the yield stress.
2.6
Elasticity
Elasticity of coating materials is frequently mentioned in the literat~re’~,’’ as being very
important in determining the coating quality, particularly of leveling. However, most of
the reported measurements of elasticity are indirect, either through the first normal stress
difference or through the stress relaxation measurement. Correlations are shown to exist,
in paints, between high values of the first normal stress difference and the leveling ability.18
However, no satisfactory rationalization has been put forward for a cause-and-effect rela-
tionship. Also, direct measurement of the elasticity of a coating through the creep-and-
recovery experiment is virtually nonexistent. We shall not discuss the role of elasticity in
this chapter.
3.0
RHEOLOGICAL PHENOMENA IN COATING
Coalescence, wetting, leveling, cratering, sagging, and slumping are the processes that are
strongly influenced by surface tension and viscoelasticity. These, in turn, are the two
important parameters that control the quality and appearance of coatings, hence their
effects on the coating process are discussed in detail.
3.1
Wetting
Surface tension is an important factor that determines the ability
of
a coating to wet and
adhere to
a
substrate. The ability
of
a paint to wet a substrate has been shown to be
COATING
RHEOLOGY
25
Better
Good
Poor
VAPOR
71,
?
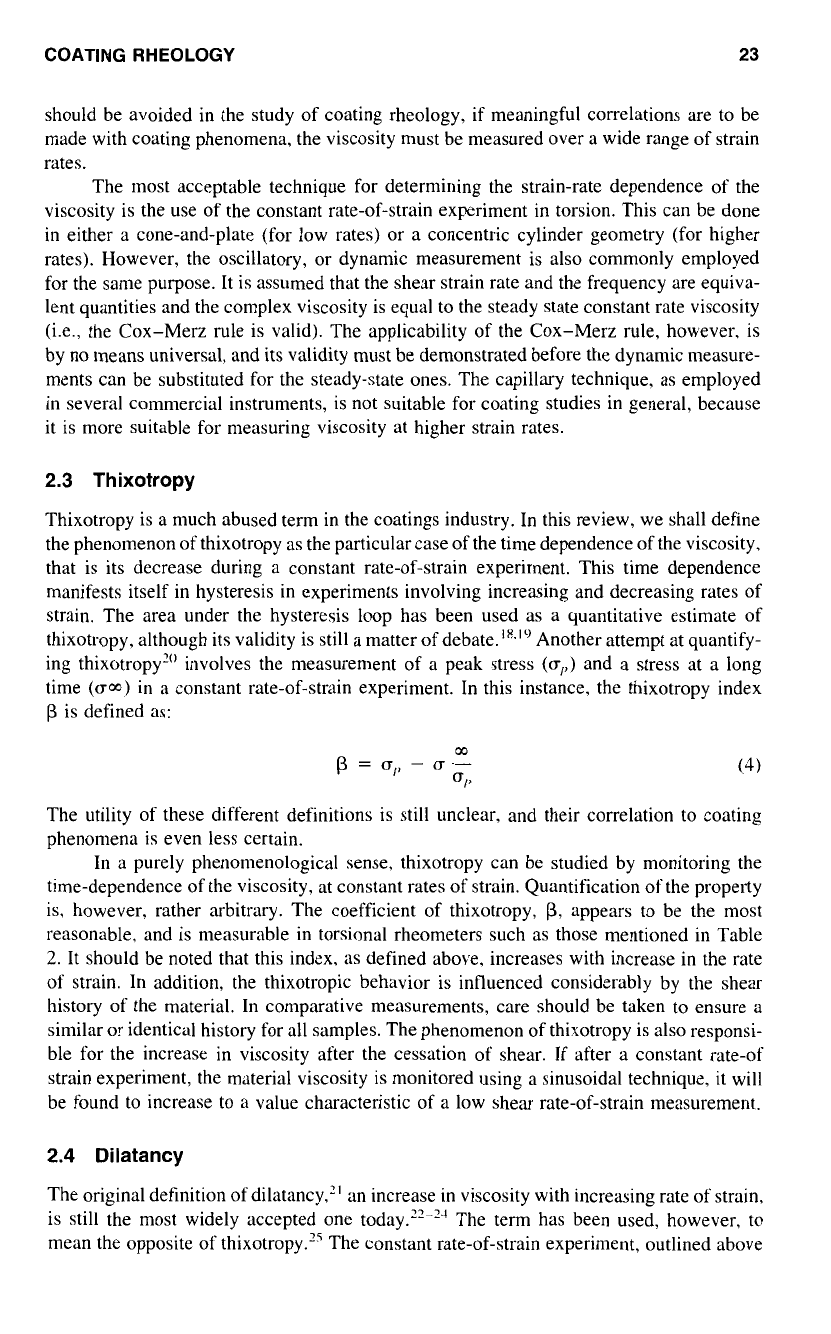
Figure
4
Schcmatic illustration
of
good and
poor
wetting
improved by using solvents with lower surface tensions.” Wetting may be quantitatively
defined by reference to a liquid drop resting in equilibrium on a solid surface (Fig.
4).
The smaller the contact angle, the better the wetting. When
8
is greater than zero, the
liquid wets the solid completely over the surface at a rate depending on the liquid viscosity
and the solid surface roughness. The equilibrium contact angle for a liquid drop sitting
an ideally smooth, homogeneous, flat, and nondeformable surface is related to various
interfacial tensions by Young’s equation
ylv
COS
8
=
-
ySI
(5)
where
yI\.
is the surface tension of the liquid in equilibrium with its won saturated vapor,
y,\.
is the surface tension of the solid in equilibrium with the saturated vapor
of
the liquid,
and
yhI
is the interfacial tension between the solid and liquid. When
8
is zero and assuming
yS\
to be approximately equal to
y\
(which is usually a reasonable approximation), then
from Equation
5
it can be concluded that for spontaneous wetting to occur, the surface
tension of the liquid must be greater than the surface tension
of
the solid. It is also possible
for the liquid
to
spread and wet
a
solid surface when
8
is greater than zero, but this required
the application of a force to the liquid.
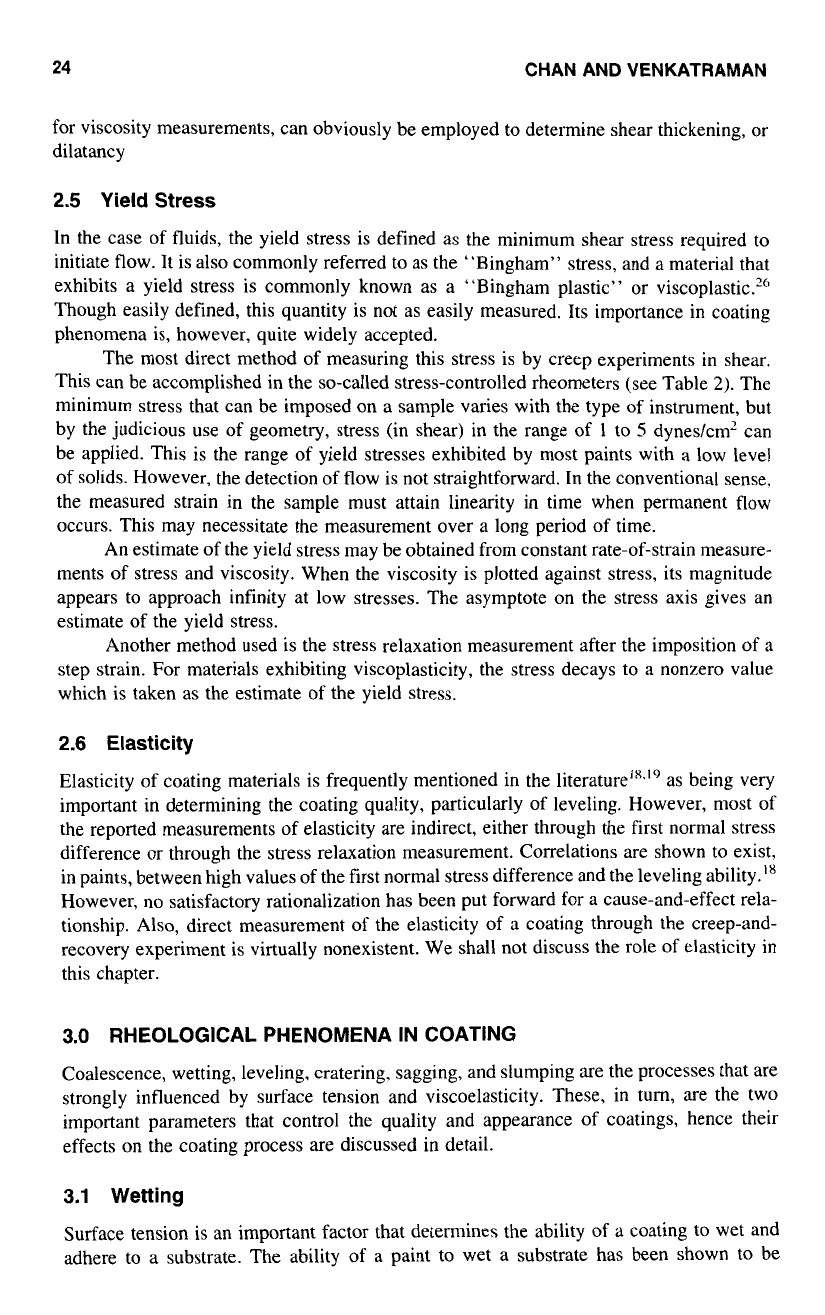
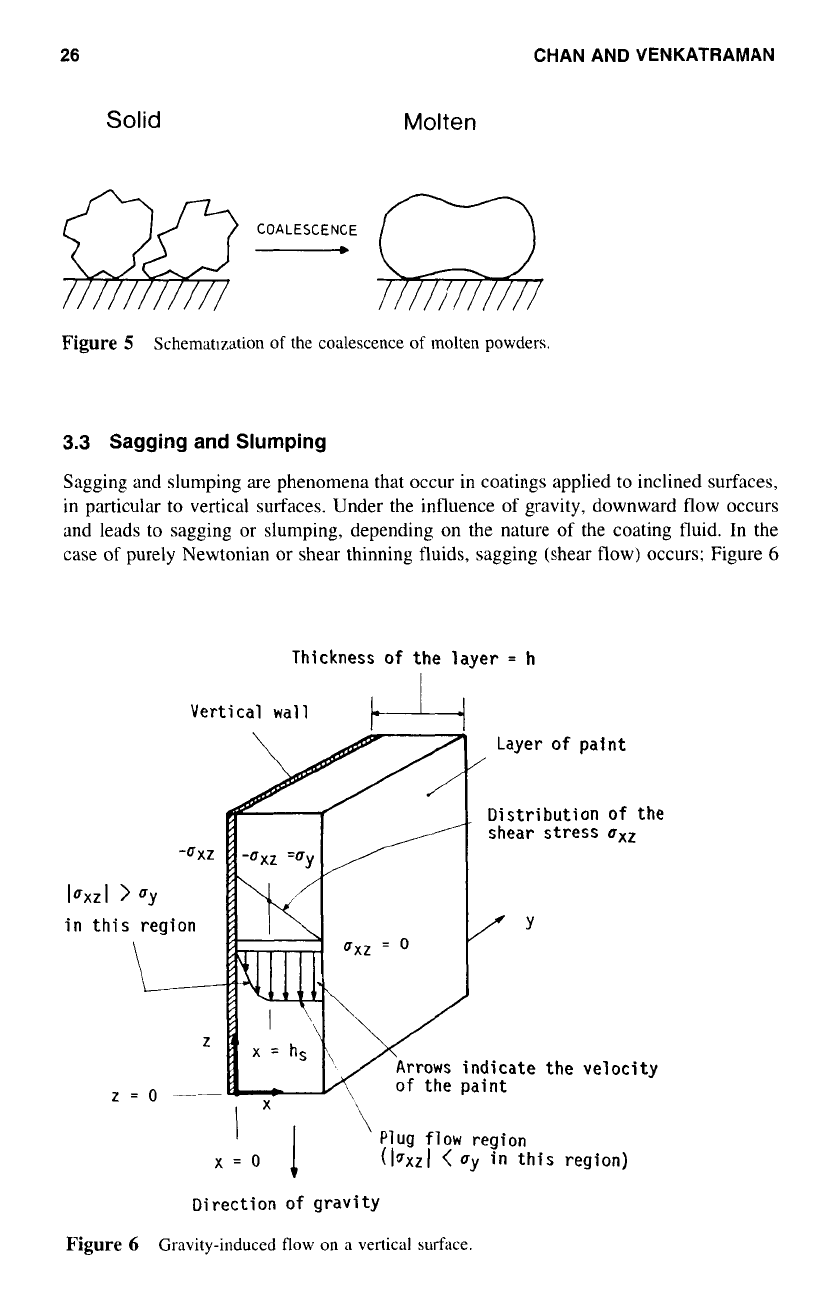
3.2
Coalescence
Coalescence is the fusing of molten particles
to
form a continuous film. It is the first step
in powder coating. The factors that control coalescence are surface tension, radius of
curvature, and viscosity of the molten powder. Figure
5
shows a schematic diagram of
the coalescence
of
molten powder. Nix and Dodge2x related the time
of
coalescence to
those factors by the equation,
t‘.
=
f
(q
%)
where
t,.
is the coalescence time and
R,.
is the radius of the curvature (the mean particle
radius).
To
minimize the coalescence time such that more time is available for the leveling-
out stage, low viscosity, small particles, and low surface tension are desirable.
26
CHAN AND VENKATRAMAN
Solid
Molten
a-
Q
COALESCENCE
Figure
5
Schematlzation
of
the coalescence
of
molten powders.
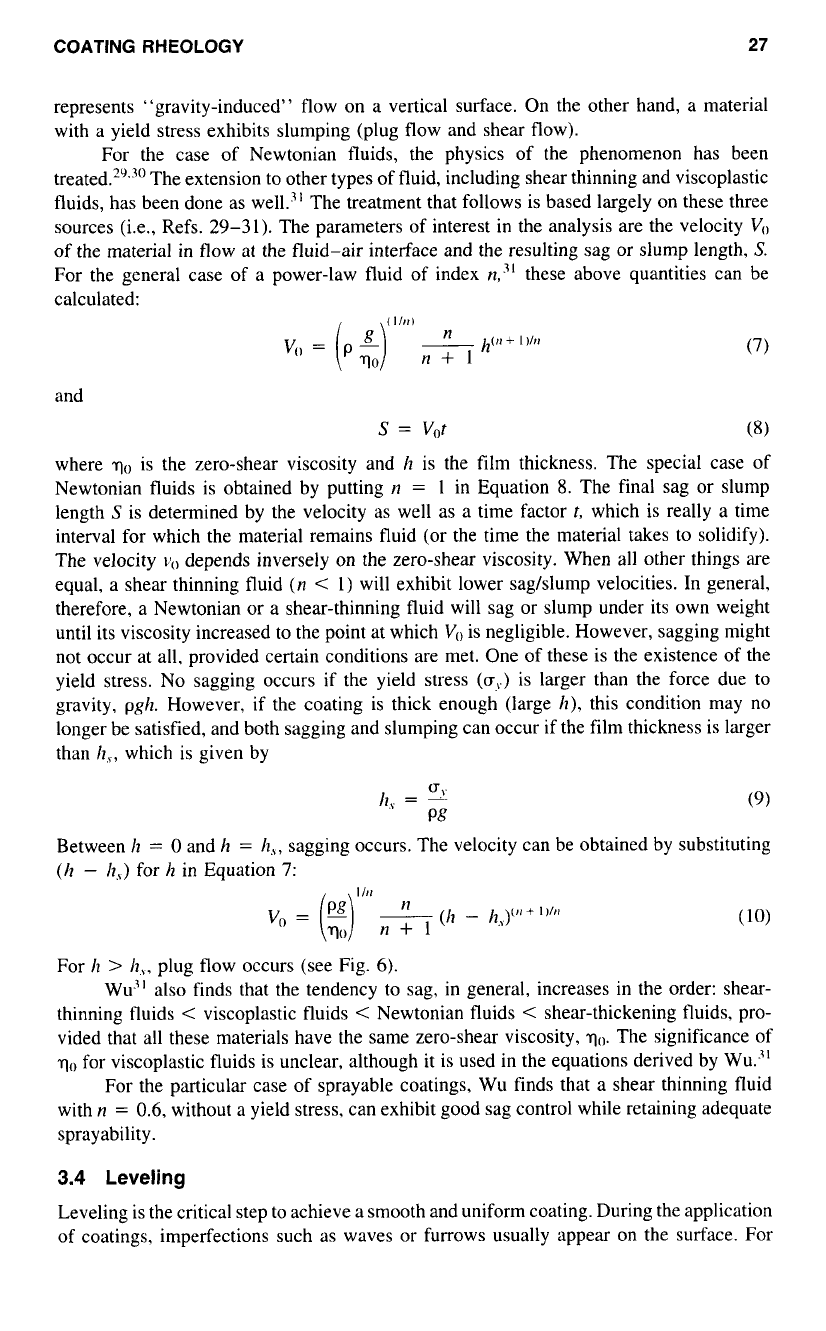
3.3
Sagging
and
Slumping
Sagging and slumping are phenomena that occur in coatings applied to inclined surfaces,
in particular
to
vertical surfaces, Under the influence
of
gravity, downward flow occurs
and leads
to
sagging or slumping, depending on the nature
of
the coating fluid. In the
case
of
purely Newtonian or shear thinning fluids, sagging (shear flow) occurs; Figure
6
Thickness
of
the
layer
=
h
Vertical wall
d”
x=o
‘
^l
uxz
=
0
Layer
of
paint
/
Distribution
of
the
shear stress
uXz
fY
the velocity
of the paint
Plug flow region
(10~~1
<
ay
in
this
region)
Direction of gravity
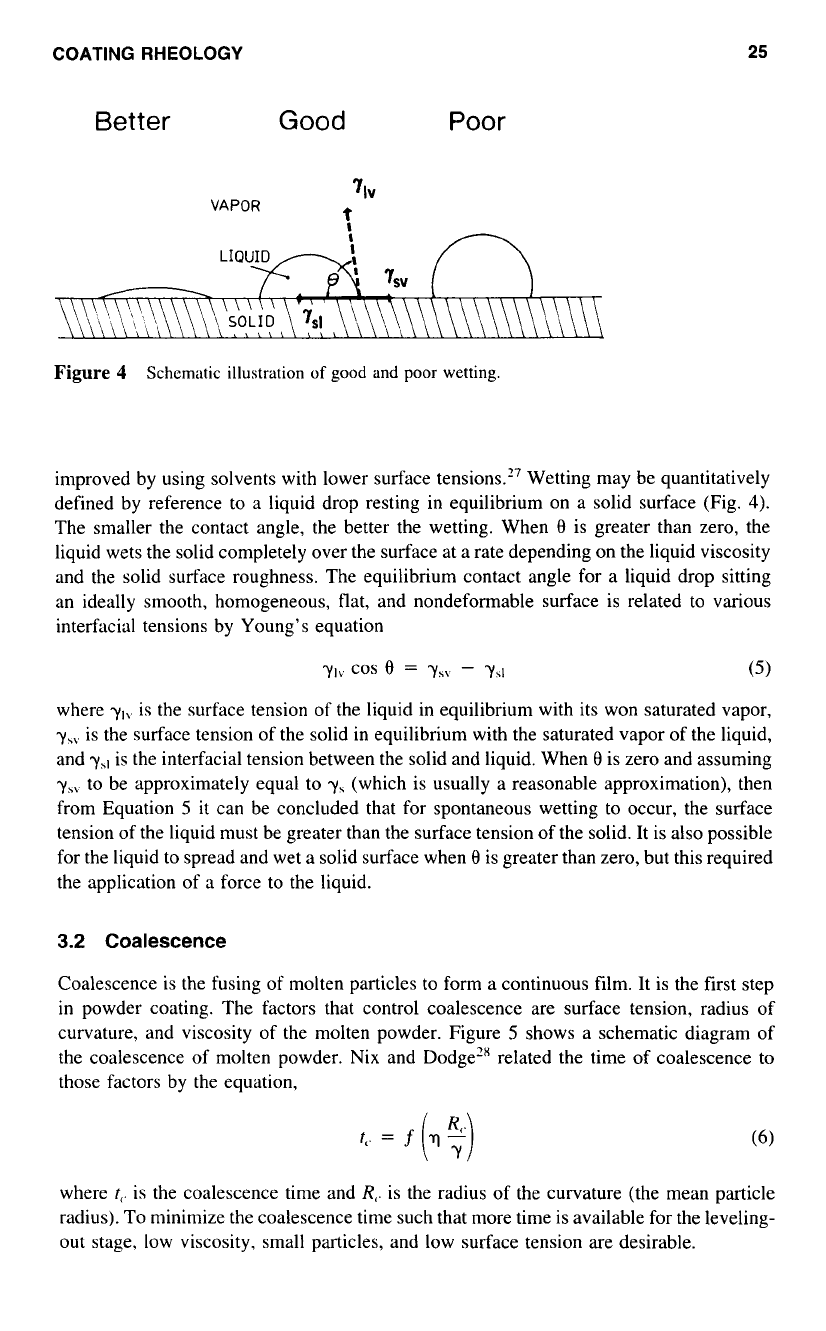
Figure
6
Gravity-induced
flow
on
a
vertical surface.
COATING
RHEOLOGY
27
represents "gravity-induced'' flow on a vertical surface. On the other hand,
a
material
with a yield stress exhibits slumping (plug flow and shear flow).
For the case
of
Newtonian fluids, the physics of the phenomenon has been
treated.'"'' The extension to other types of fluid, including shear thinning and viscoplastic
fluids, has been done as we1L3' The treatment that follows is based largely on these three
sources (i.e., Refs.
29-31).
The parameters of interest in the analysis are the velocity
V,,
of the material
in
flow at the fluid-air interface and the resulting sag
or
slump length,
S.
For the general case
of
a power-law fluid of index
n,jl
these above quantities can be
calculated:
and
S
=
Vot
(8)
where
qo
is the zero-shear viscosity and
h
is the film thickness. The special case of
Newtonian fluids is obtained by putting
17
=
1
in Equation
8.
The final sag
or
slump
length
S
is determined by the velocity
as
well
as
a
time factor
t,
which is really
a
time
interval for which the material remains fluid
(or
the time the material takes to solidify).
The velocity
v()
depends inversely on the zero-shear viscosity. When all other things are
equal, a shear thinning fluid
(n
<
1)
will exhibit lower sag/slump velocities. In general,
therefore, a Newtonian or
a
shear-thinning fluid will sag
or
slump under its own weight
until its viscosity increased to the point at which
V,)
is negligible. However, sagging might
not occur at all. provided certain conditions are met. One of these is the existence
of
the
yield stress.
No
sagging occurs if the yield stress
(U,.)
is larger than the force due to
gravity,
p&.
However, if the coating is thick enough (large
h),
this condition may no
longer be satisfied, and both sagging and slumping can occur if the film thickness is larger
than
h,,,
which is given by
Between
It
=
0
and
It
=
/I,,,
sagging occurs. The velocity can be obtained by substituting
(h
-
I?,,)
for
h
in Equation
7:
For
h
>
h,,
plug flow occurs (see Fig.
6).
Wu31 also finds that the tendency to sag, in general, increases in the order: shear-
thinning fluids
<
viscoplastic fluids
<
Newtonian fluids
<
shear-thickening fluids, pro-
vided that
all
these materials have the same zero-shear viscosity,
yo.
The significance of
yo
for viscoplastic fluids is unclear, although it is used in the equations derived by Wu?'
For the particular case
of
sprayable coatings, Wu finds that
a
shear thinning fluid
with
n
=
0.6,
without
a
yield stress, can exhibit good sag control while retaining adequate
sprayability.
3.4
Leveling
Leveling is the critical step to achieve a smooth and uniform coating. During the application
of
coatings. imperfections such
as
waves
or
furrows usually appear on the surface. For
28
CHAN AND VENKATRAMAN
“
/
I//////
SUBSTRATE
’
///////
.:
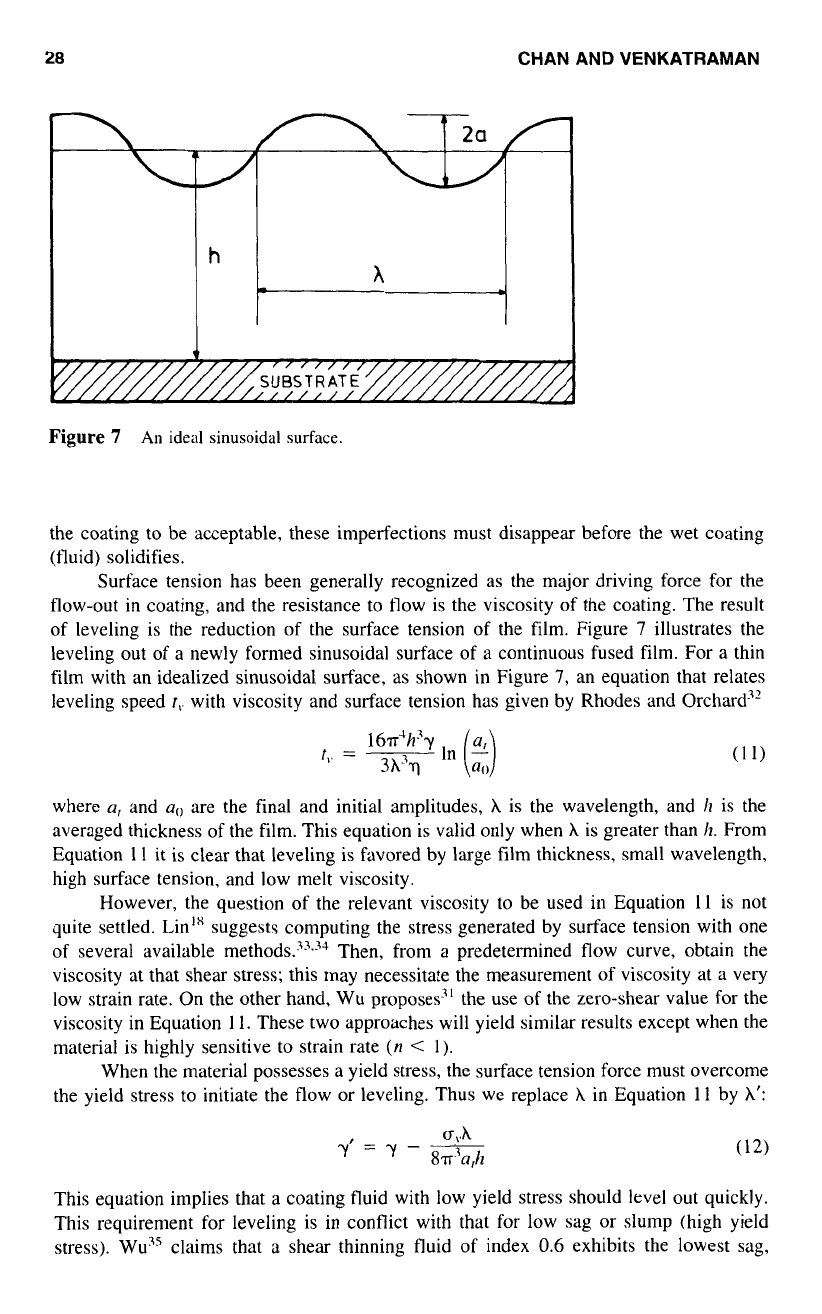
Figure
7
An
ideal sinusoidal
surface.
the coating to be acceptable, these imperfections must disappear before the wet coating
(fluid) solidifies.
Surface tension has been generally recognized as the major driving force for the
flow-out in coating, and the resistance to flow is the viscosity
of
the coating. The result
of leveling is the reduction of the surface tension
of
the film. Figure
7
illustrates the
leveling out of a newly formed sinusoidal surface of
a
continuous fused film. For a thin
film with an idealized sinusoidal surface, as shown in Figure
7,
an equation that relates
leveling speed
I,.
with viscosity and surface tension has given by Rhodes and Orchard3’
16dh3y
t,.
=
~
3A37
In
(2)
where
a,
and
a.
are the final and initial amplitudes,
A
is the wavelength, and
h
is the
averaged thickness of the film. This equation is valid only when
A
is greater than
h.
From
Equation 11 it is clear that leveling is favored by large film thickness, small wavelength,
high surface tension, and low melt viscosity.
However, the question
of
the relevant viscosity to be used in Equation
11
is not
quite settled. LinIx suggests computing the stress generated by surface tension with one
of several available methods.33,34 Then, from a predetermined flow curve, obtain the
viscosity at that shear stress; this may necessitate the measurement
of
viscosity at a very
low strain rate. On the other hand, Wu proposes” the use
of
the zero-shear value for the
viscosity in Equation
1 1.
These two approaches will yield similar results except when the
material is highly sensitive
to
strain rate
(n
I).
When the material possesses a yield stress, the surface tension force must overcome
the yield stress to initiate the flow or leveling. Thus we replace
A
in Equation
11
by
A’:
This equation implies that a coating fluid with low yield stress should level
out
quickly.
This requirement
for
leveling is in conflict with that for low sag or slump (high yield
stress). Wu3’ claims that a shear thinning fluid of index
0.6
exhibits the lowest sag,
COATING
RHEOLOGY
29
provided the viscosity is
50
poise at
1
reciprocal second. Since such a fluid does not have
a
yield stress, it should level out well. This kind of rheological behavior may be attainable
in an oligomeric powder coating at temperatures close to its melting point, or in a solution
coating with a high solid content. It is difficult to see how this behavior could be realized
in all situations, in particular for latex dispersions that possess yield stresses.
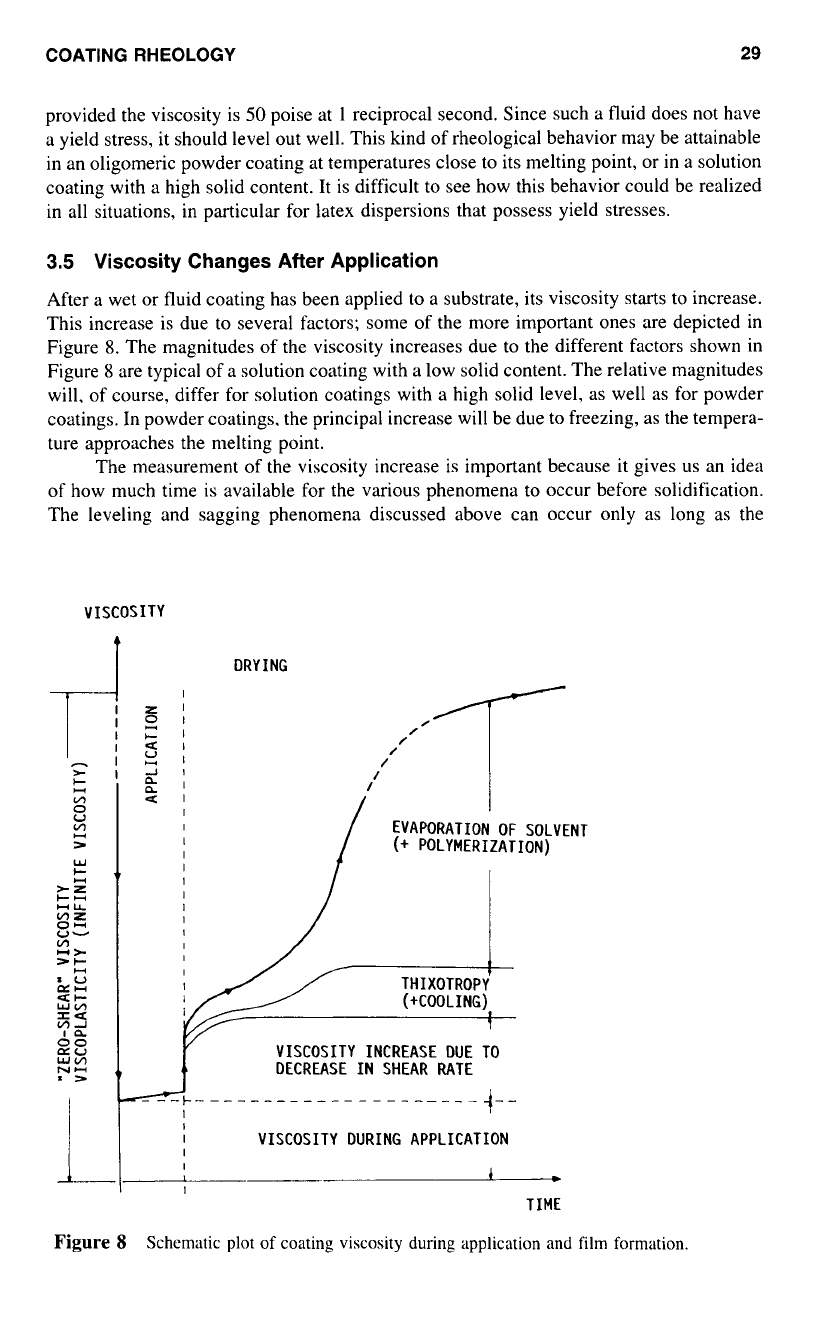
3.5
Viscosity Changes After Application
After a wet or fluid coating has been applied
to
a substrate, its viscosity starts to increase.
This increase is due to several factors; some of the more important ones are depicted
in
Figure
8.
The magnitudes
of
the viscosity increases due
to
the different factors shown in
Figure
8
are typical of a solution coating with a low solid content. The relative magnitudes
will,
of
course, differ for solution coatings with a high solid level, as well as for powder
coatings. In powder coatings. the principal increase will be due to freezing, as the tempera-
ture approaches the melting point.
The measurement
of
the viscosity increase is important because it gives us an idea
of
how much time is available for the various phenomena to occur before solidification.
The leveling and sagging phenomena discussed above can occur only as long as the
l
DRYING
"---I
I
Ti
+I
5
:
UI
nIE1
/
Zl;i"
/
2
tr
"
CI
v)
0
V
n1
1
4.1
I
I
EVAPORATION
OF
SOLVENT
I
(+
POLYMERIZATION)
>
W
I
I
I
*z
+ILL
I
v)z
0-
I
V-
I
v)
+l>
>+
U
CU
I
I
I
I
t
=v
Ut-
I
c*U
I
THIXOTROPY
Wv)
(+COOLING)
SS
I
1
~n
00
=V
Wv)
NU
,h
DECREASE IN SHEAR RATE
W
VISCOSITY INCREASE DUE TO
"
e+-
-_
""_
-
-
-
-
- -
-
-
""
-
1"
I
VISCOSITY DURING APPLICATION
1
c
TIME
Z
I;i"
/
2
tr
"
CI
v)
0
V
n1
1
4.1
l
I
I
EVAPORATION
OF
SOLVENT
I
(+
POLYMERIZATION)
>
W
I
I
I
*z
+ILL
I
v)z
0-
I
V-
I
v)
+l>
>+
CU
I
I
I
U
I
t
=v
Ut-
I
c*U
I
THIXOTROPY
Wv)
(+COOLING)
SS
1
00
Wv)
NU
~n
=V
VISCOSITY INCREASE DUE TO
W
Y
,h
DECREASE IN SHEAR RATE
-""""""-"""-
1"
VISCOSITY DURING APPLICATION
1
c
TIME
Figure
8
Schematic plot of coating viscosity during application and film formation.
30
CHAN AND VENKATRAMAN
material remains fluid; as the viscosity increases, these processes become less and less
significant because of the decrease in the sagging velocity and leveling speed in accordance
with Equations
7
and
11.
In fact, using the measured time dependence of the viscosity,
one can estimate the time
t
(time taken to solidify) to be used in Equation
8,
as well
HS
the time of leveling, in Equation
1
1.
In general, if the viscosity is higher than approximately
100.000
P,
then leveling and sagging phenomena occur
to
a negligible extent.
Experimentally, one can monitor the viscosity increase using an oscillatory technique
(see Section
2.2).
This method is the preferred one, since measurements can be made
under the condition
of
low shear amplitude, which approximates the condition after a
coating application. Also, the solidification point can be estimated from the measurement
of the elastic modulus.
To
mimic the condition immediately after coating, the oscillatory
measurement should be preceded by shearing
at
a fairly high rate, corresponding to the
method
of
application.3" In such an experiment, the average amplitude of the torquelstress
wave increases with time after the cessation of a ramp shear. Although it is not easy to
compute the viscosity change from the amplitude change, an estimation is po~sible.~'
Alternatively. one can use just the amplitude of the stress for correlation purposes. Dodge3"
finds a correlation between the viscosity level after application and the extent of leveling
as
quantified by a special technique he developed. Another method that has been used38
involves rolling a sphere down a coating applied to an inclined surface. The speed
of
the
sphere can be taken as an indicator of the viscosity, after suitable calibration with Newton-
ian fluids. This method can be very misleading because the tlow is not viscometric, and
it
is
not applicable
to
non-Newtonian fluids. A more acceptable technique is
to
use a
simple shear. with a plate being drawn at constant velocity over a horizontal coating.'"
3.6
Edge and Corner Effects
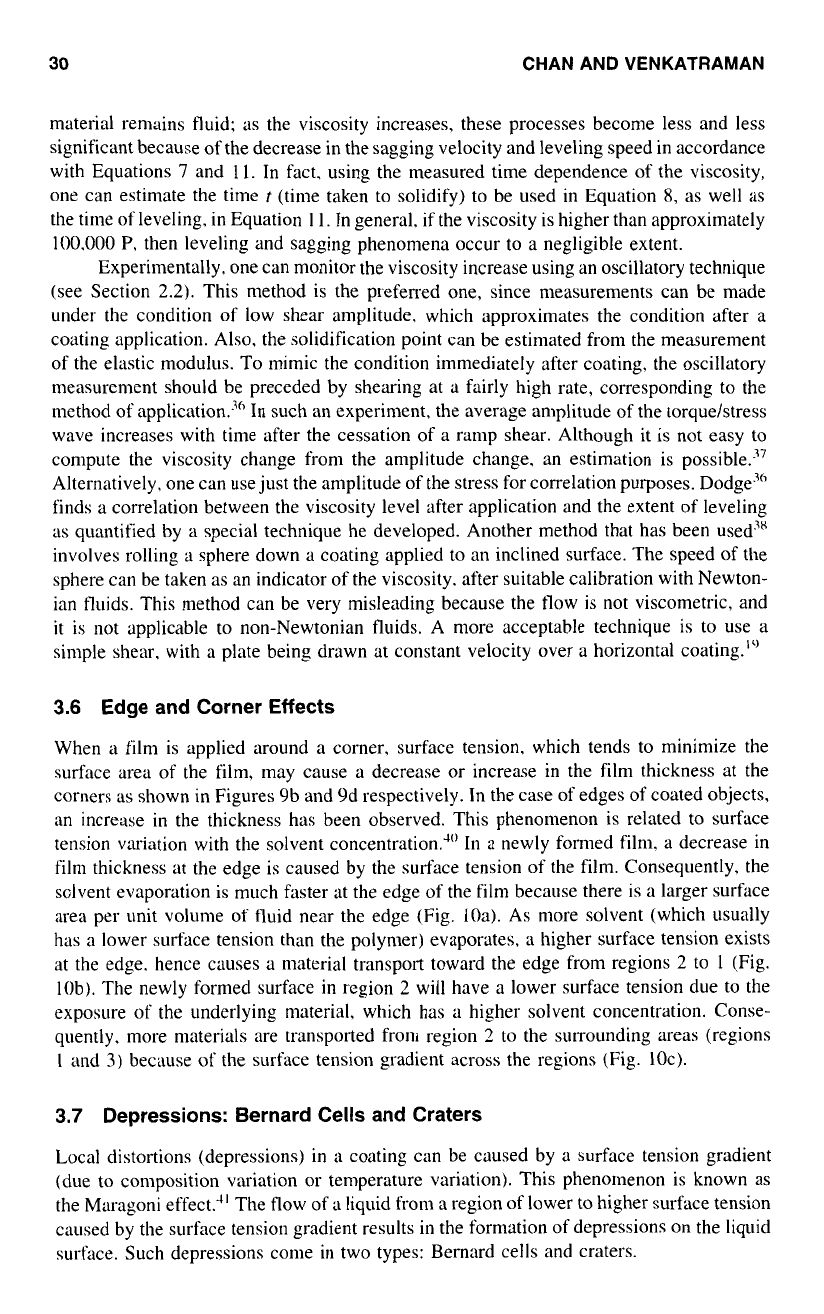
When
a
film is applied around a corner, surface tension, which tends
to
minimize the
surface area of the film, may cause a decrease or increase in the film thickness at the
corners as shown in Figures 9b and 9d respectively. In the case of edges of coated objects,
an increase
in
the thickness has been observed. This phenomenon is related to surface
tension variation with the solvent concentration.'"
In
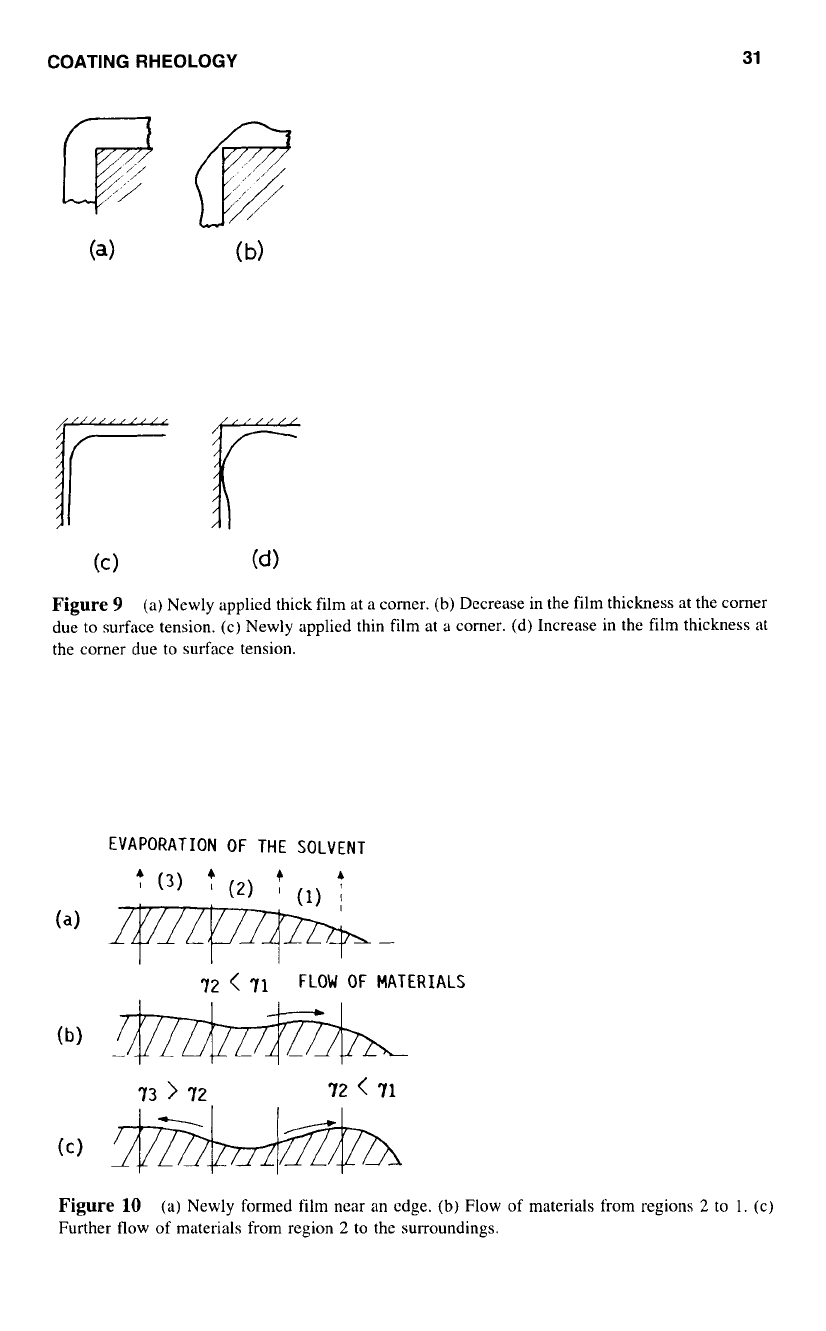
a newly formed film,
a
decrease in
film thickness at the edge is caused by the surface tension of the film. Consequently, the
solvent evaporation is much faster at the edge of the film because there is a larger surface
area per unit volume of fluid near the edge (Fig.
loa).
As more solvent (which llsually
has a lower surface tension than the polymer) evaporates, a higher surface tension exists
at the edge. hence causes a material transport toward the edge from regions
2
to
1
(Fig.
10b). The newly formed surface in region
2
will have a lower surface tension due
to
the
exposure of the underlying material, which has a higher solvent concentration. Conse-
quently, more materials are transported from region
2
to
the surrounding areas (regions
I
and
3)
because
of
the surface tension gradient across the regions (Fig.
10~).
3.7
Depressions: Bernard Cells and Craters
Local distortions (depressions) in
a
coating can be caused by a surface tension gradient
(due to composition variation or temperature variation). This phenomenon is known as
the Maragoni effect.4' The flow of
a
liquid from a region of lower to higher surface tension
caused by the surface tension gradient results in the formation of depressions on the liquid
surface. Such depressions come
in
two types: Bernard cells and craters.
COATING RHEOLOGY
31
Figure
9
(a) Newly applied thick film at a comer.
(b)
Decrease in the film thickness at the corner
due
to
surface tension. (c) Newly applied thin film at a comer. (d) Increase in the film thickness at
the corner due
to
surface tension.
EVAPORATION
OF
THE SOLVENT
72
<
71
FLOW
OF
MATERIALS
73
>
72
72
<
71
Figure
10
(a) Newly formed film near an edge.
(b)
Flow of materials from regions
2
to 1. (c)
Further flow
of
materials from region
2
to the surroundings.