Russell I. (ed.) Whisky. Technology, Production and Marketing
Подождите немного. Документ загружается.


[16:01 13/3/03 n:/3991 RUSSELL.751/3991-008.3d] Ref: 3991 Whisky Chapter 8 Page: 246 242-273
Starch þ Water ! ‘Sugars’!
Fermentation
Alcohol þ Carbon dioxide þ Heat
ðC
6
H
10
O
5
Þ
n
þ nH
2
O ! C
6
H
12
O
6
! 2C
2
H
5
OH þ 2CO
2
M:W ð162Þ
n
þð18Þn ! 180:16 ! 92:14 þ 88:02
**33
It therefore follows that from the alcohol produced per tonne of malt or cereal
mashed, the approximate weight of co-products remaining can be calculated
(assuming that the yeast pitching rate is also known).
Annual whisky spirit production is published (Gray, 2000). However, to
obtain useful estimates of the volumes of individual products available,
knowledge of both co-pro duct production processes and industry structure
is required.
Whisky spirit production uses either malted barley as the sole cereal sub-
strate (for malt whisky production; see Chapter 2) or a mixture of unmalted
cereal grain together with sufficient malted barley to provide the enzymes
necessary to convert the cereal starch (for grain whisky; see Chapter 3).
Although for grain whisky production any cereal may be used, current eco-
nomics dictate that the choice is between wheat and maize.
Apart from the cereal used, there are other important differences between
the two processes that can affect the nutritional properties of their respective
co-products.
Malt spirit is batch distilled in copper stills from a fermented clear wort or
wash. Grain spirit is contin uously distilled from a fermented wash that may
include the cereal, malt and yeast residues, and the stills may allow ‘sacrificial’
copper to come into contact with the wash. Details of the respective processes
are given below.
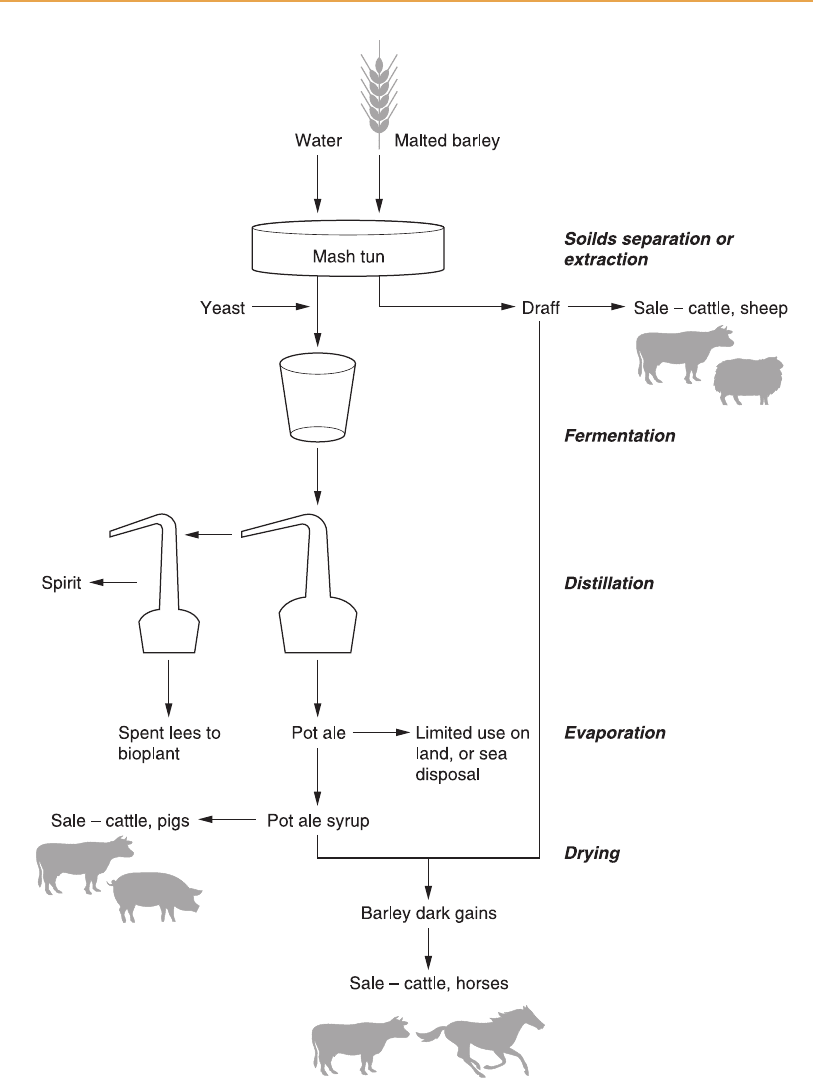
Malt whisky co-products
The malt distiller mills dressed malte d barley to produce a suitable grist. The
soluble sugars and starch are dissolved using repeated hot water extraction,
always ensuring that malt enzyme activity is maintained by recycling later,
hotter waters. The solubilized starch and sugar liquid (wort) is drained off and
fermented by added yeast. The residue remaining in the mash tun (known as
(malt) draff) can then be used directly as animal feed or used as a comp onent
of barley dark grains (see Figure 8.1).
After a fermentation of typically 48 hours the wash is distilled in the copper
wash still. The relatively low pH of the fermented wash (about 4.0) means that
some still erosion is inevitable. It is also beneficial, as reactive copper helps
remove some of the less desirable sulphur containing compounds (Whitby,
1992). The amount of still erosion will vary with the fermentatio n time of the
wash, design of still, purity of copper used and type of still heating.
The still residue, known as pot ale or, historically, burnt ale, contains yeast ,
yeast residue, soluble protein and carbohydrates, and a significant but variable
quantity of copper (40–140 mg/kg dry matter). With a total solids content of
4.0–4.5 per cent and a high biological oxygen demand (BOD), only a small
246 Whisky: Technology, Production and Marketing
[16:01 13/3/03 n:/3991 RUSSELL.751/3991-008.3d] Ref: 3991 Whisky Chapter 8 Page: 247 242-273
Chapter 8 Co-products 247
Figure 8.1
Co-products from malt distilleries.

[16:01 13/3/03 n:/3991 RUSSELL.751/3991-008.3d] Ref: 3991 Whisky Chapter 8 Page: 248 242-273
proportion is now used as a fertilizer or as pig feed owing to the large volume
produced. Some reaches the sea via long pipelines, but most is further
processed to pot ale syrup (PAS) or barley dark grains (BDG).
The pot ale is first evaporated to pot ale syrup. Pot ale syrups have dry
matter of between 40–50 per cent, viscosity similar to that of molasses, and
vary in colour from mid- to dark brown (depending on the design of the
evaporator, evaporation under partial vacuum giving a paler syrup).
The higher dry matter concentration of pot ale syrup allows it to be sold,
without further processing, as a cattle or pig feed. As is demonstrated below,
the total market for this liquid feed is somewhat limited and therefore most
pot ale syrup is blended with draff and then dried to produce ba rley dark
grains.
The low wines from the wash still are then passed on to the spirit still for the
second distillation to whisky spirit, and the spirit is filled into oak casks for
maturation into malt whisky.
Spent lees remain as the spirit still residue with a BOD of 1500 mg/l and a
low pH; this dilute solution of organic acids and alcohols is normally treated
by conventional biological effluent treatment.
In the production of barley dark grains, draff is first dewatered in rotary
screw presses, and is then mixed with pot ale syrup before being dried, pel-
leted and cooled.
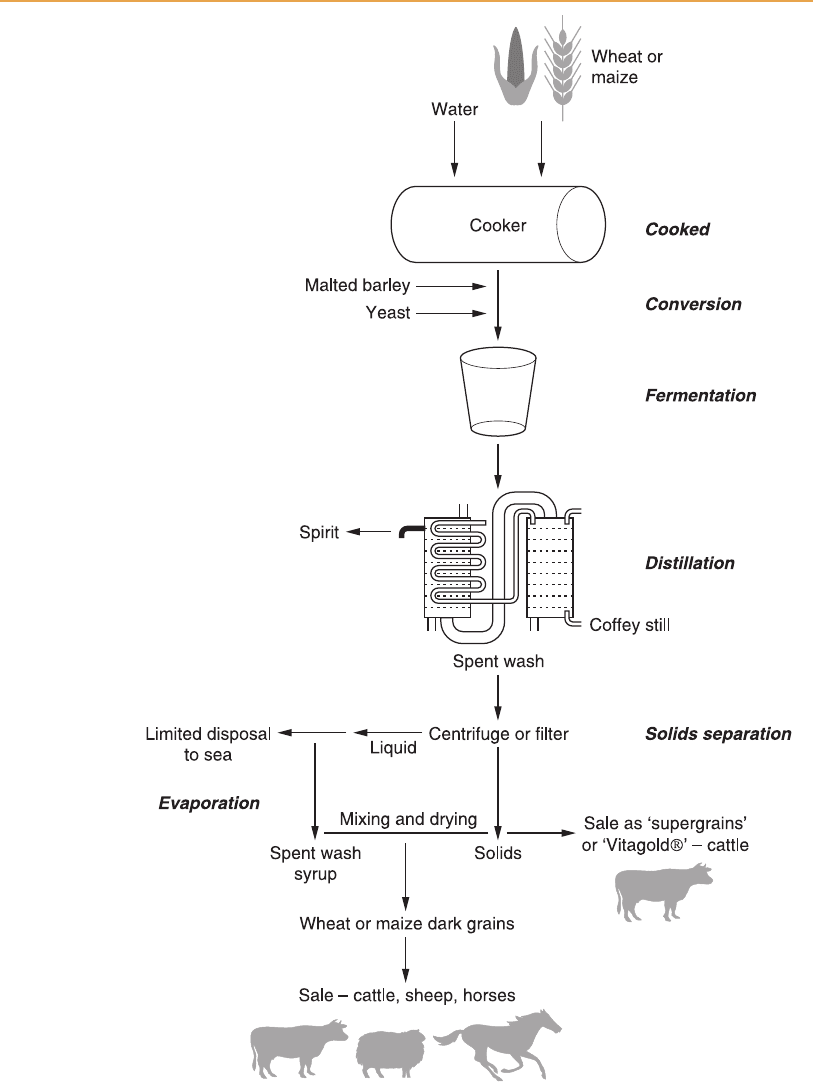
Grain whisky co-products
Figure 8.2 illustrates the processes involved in the production of grain spirit
and associated co-products.
Grain distilleries have a wider range of production techniques than malt
distilleries, and the more varied nature of the co-products reflects these differ-
ences.
The starch in the cereal must first be solubilized to render it susceptible to
the malt enzymes. This is achieved through a combination of grinding and
high-pressure and -temperature cooking. The severity and extent of cooking
will vary between distilleries and the choice of cereal. The partially liquified
cereal must then be cooled before sufficient malted barley is added to convert
the starch to fermentable sugars.
Some distilleries then remove the solids before adding yeast to ferment a
clarified wort, whereas others ferment all the wash, including cereal and malt
residues.
After fermentation the alcohol is distilled in continuously opera ted distilla-
tion colum ns of varying designs. Most incorporate a facility for allowing che-
mically reactive copper to come into contact with either the boiling liquid or
vapour phases (or both). As in malt distilleries, this contact removes less
desirable sulphur-containing compounds and congeners.
Following distillation, the spen t wash solids are removed by centrifuges or
filter presses. Where possible, the dilute centrate or filtrate is dischar ged into
the sea, with the moist solids being sold following the addition (where neces-
248 Whisky: Technology, Production and Marketing
[16:01 13/3/03 n:/3991 RUSSELL.751/3991-008.3d] Ref: 3991 Whisky Chapter 8 Page: 249 242-273
Chapter 8 Co-products 249
Figure 8.2
Grain distilling co-products – typical process.
[16:01 13/3/03 n:/3991 RUSSELL.751/3991-008.3d] Ref: 3991 Whisky Chapter 8 Page: 250 242-273
sary) of a suitable preservative to extend shelf life. Where local factors prevent
coastal discharge, the liquid is evaporated to spent wash syrup before being
mixed with the solid fractio n and dried and cooled to pro duce dark grains for
sale.
The differences in both processes and still design significantly affect co-
product properties. Cereal and yeast protein are denatured to a variable extent
depending on the degree of both initial cooking and any subsequent drying.
Copper levels in the co-products also depend on the extent to which wash
has been distilled in a copper-rich environment. It can vary from the back-
ground low level found in the cereal to over 150 mg/kg dry matter.
Volumes produced
Broadly speaking whisky production has always been cyclical, with recurring
peaks and troughs as optimistic demand growth assumptions have led to
overstocking followed by reductions in production.
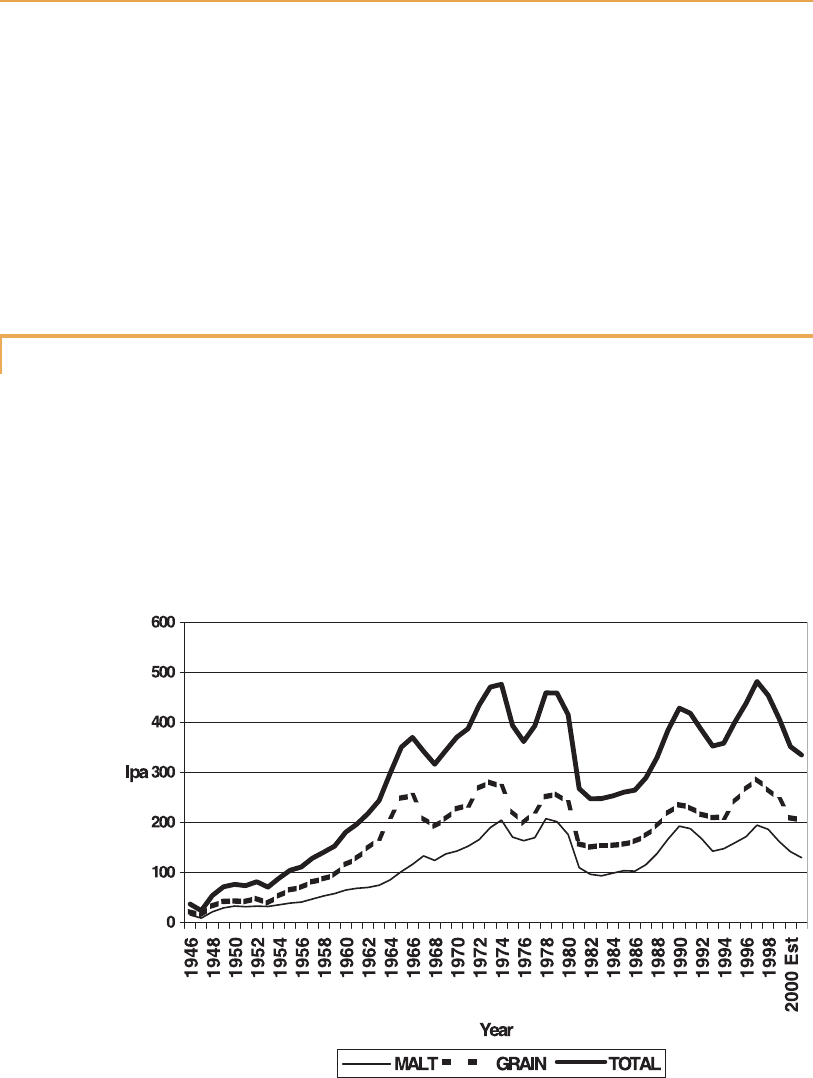
Figure 8.3, compiled from data given by Gray (2000) and Craig (1994),
shows estimates of production for both malt and grain whiskies. The dramatic
increase from 1955 until 1966 can clearly be seen. Production throughout the
Second World War had been very low, and post-war market growth was
250 Whisky: Technology, Production and Marketing
Figure 8.3
Malt and grain whisky distillation 1947–2001 (Sources: Craig, 1994; Gray, 2000).

[16:01 13/3/03 n:/3991 RUSSELL.751/3991-008.3d] Ref: 3991 Whisky Chapter 8 Page: 251 242-273
dramatic as increases in cereal availability coincided with the western world’s
increasing affluence.
As already noted, co-product utilization is not a new phenomenon, but the
substantial growth in production in the 1960s led to significant changes in
production methods.
Figure 8.4 (see p. 258) shows a materials flow for malt distilleries. For every
100 t of malt, some 330–345 t of pot ale with a BOD
5
of 25 000 mg/l (Duncan et
al., 1994) is produced. Grain distilleries produce a somewhat greater volume of
spent wash for every tonne of cereal with a very similar BOD
5
.
Thus in 1966, with a malt and grain spirit production of 349 mi llion litres of
pure alcohol (116 million litres of malt and 233 million litres of grain) (Gray,
2000), around 4 million tonnes of pot ale and spent wash would have been
produced (at an assumed spirit yield of 376 and 385 litres p.a./t of malt and
grain mashed respectively). For comparison, current total UK beer prod uction
is around 5.7 million tonnes (BLRA, 2001). By the mid-1960s the volumes of
dilute co-products available in Scotland had become very substantial, and this
was the driver behind the building of large drying plants. Where drying of the
dilute co-products is not required (for example, where sea discharge is possi-
ble), then current econo mics make the sale of wet cereal residues (draff or the
grain distilling equivalent) more desirable.
The industry’s growth in the 1960s saw a parallel necessary increase in the
industry’s drying capacity, ensuring that the dilute co-products did not cause
environmental difficulties.
By contrast, the UK brewing industry has not required this investment as
the dilute products of fermentation are consumed directly and the moist cereal
residues (brewers’ grains) are produced over a sufficiently large geographic
area to find markets (see Crawshaw, 2001).
Current co-product volumes can be calculated in a similar manner from
spirit volumes, spirit yields per tonne of malt or cereal (given in Gray,
2000). The same source also gives an indicatio n of both individual distillery
capacity and the industry’s overall capacity utilization.
From these figures, and using the simplified stoichiometry given in the
process descriptions above, the tonnage of co-products produced can be cal-
culated. It is summarized for relevant years in Tables 8.1 and 8.2.
The effective tripling of the tonnage of residues from the process in the ten
years from 1955 led to significant changes in recovery and marketing strate-
gies, with a rise in the number of plants producing dried or evaporated co-
products.
Over the last ten years there have been further changes, with smaller malt
distilling drying plants closing (e.g. Aul tmore, Glenallachie, Teaninich and the
Livet Feeds dark-grain plants, and Ardmore and Glendronach dried distillers’
solubles plants). The cost of renewing ageing plants to meet mode rn environ-
mental standards has increased the economies of scale, so that current drying
plants serving the malt distilling industry are large and take both draff and pot
ale from a number of distilleries. All grain distilleries are relatively large (with
capacities of between 10 and 63 mla/annum**34), and can justify integrated
co-product recovery facilities.
Chapter 8 Co-products 251

[16:01 13/3/03 n:/3991 RUSSELL.751/3991-008.3d] Ref: 3991 Whisky Chapter 8 Page: 252 242-273
Calculating tonnages of co-product by type
From the above information on distillery capacitie s and capacity utilization, if
it is assumed that all malt or grain distilleries operate at the same capacity
utilization for the sector it is possible to calculate the actual tonnages of co-
product by type. The calculation is then corrected for those distilleries that
discharge pot ale to sea (for example on Islay) or use products as fertilizers.
Calculations for malt and grain distilleries are given below.
252 Whisky: Technology, Production and Marketing
Table 8.1
Grain distillery co-product volumes
Year Grain whisky
production ( 10
6
l p.a.)
Yield alcohol
(l/t)
Residues
(1000 t dry matter)
1955 65.5 385 48
1966 233.0 385 171
1997 287.2 377 225
1998 267.6 376 211
1999 245.2 377 192
2000 (estimated) 210.0 377 165
2001 (estimated) 205.0 377 161
Table 8.2
Malt distillery co-product volumes
Year Malt whisky
production ( 10
6
l p.a.)
Yield alcohol
(l/t)
Residues
(1000 t dry matter)
1955 39.3 376 39
1966 116.0 376 116
1997 194.8 410 154
1998 186.7 407 151
1999 161.9 409 129
2000 (estimated) 142.0 409 113
2001 (estimated) 130.0 409 104

[16:01 13/3/03 n:/3991 RUSSELL.751/3991-008.3d] Ref: 3991 Whisky Chapter 8 Page: 253 242-273
Malt distilleries
Malt draff production (Table 8.3):
Spirit (10
6
l p.a.)
Island distillery capacity – draff sale 20.57
Other known sea/land/sewer disposal of pot ale 26.97
Pot ale syrup production, with draff sale
43.53
TOTAL 91.07
Pot ale syrup production (Table 8.4):
Spirit ( 10
6
l p.a.)
Capacity of malt distilleries selling pot ale syrup 44
Barley dark grains (Table 8.5):
Chapter 8 Co-products 253
Table 8.3
Draff production
Year Yield assumed Capacity utilization Calculated malt Calculated draff
1997 410 88 195 500 185 700
2000 (estimated) 409 66 147 000 139 600
2001 (estimated) 409 60 133 600 126 900
Table 8.4
Pot ale syrup production
Year Calculated malt Pot ale dry matter
1
Pot ale syrup tonnage
2
1997 94 400 12 461 27 691
2000 (estimated) 71 000 9372 20 827
2001 (estimated) 64 00 8514 18 920
1
Assuming 3.3 m
3
/t malt at 4 per cent dry matter.
2
Assuming an average of 45 per cent dry matter.
Table 8.5
Barley dark-grain production
Year Total malt spirit production (kla)
1
Barley dark grains (tonnage)
2
1997 114 658 102 300
2000 (estimated) 81 894 73 700
2001 (estimated) 79 358 67 800
1
Reduced to take account of volume sold as draff.
2
From stoichiometry and assuming a dry matter of 90 per cent.

[16:01 13/3/03 n:/3991 RUSSELL.751/3991-008.3d] Ref: 3991 Whisky Chapter 8 Page: 254 242-273
Although the above figures can only be approximate, they do illustrate both
the variable volumes of co-product available and the changes in production
that have occurred.
As a further example, in 1973 in the Highland and Islands Development
Board area alone draff sales were estimated at almost 300 000 t p.a., a figure
that fell to 128 000 t p.a. in 1975 (primarily due to a fall in spirit production
(Mackel, 1977). For comparison, draff use in Scotland in 1979/1980 was about
400 000 t and it was estimated that potential use was double that figure (Lilwall
and Smith, 1983).
As the above calculations show, draff sales are now running at between
125 000 and 200 000 tonnes per annum and a re unlikely to increase signifi-
cantly unless alternative methods of pot ale processing can be developed.
The alternative strategy to producing barley dark grains is to sell the draff
and produce pot ale syrup. The list of PAS evaporators and their potential
maximum production is given in Table 8.6.
Current production is little more than half that given in Table 8.6, with some
of the PAS being produced and then taken to dark-grain plants. In the last ten
years some older evaporation plants have closed, and total production in the
early 1990s will have reached or exceeded the current capacity of some 36 000 t
p.a. At the high level of production seen in 1991 the market showed signs of
distress in the summer, with stocks being very high and prices collapsing to a
low of about £4/t to the distiller.
254 Whisky: Technology, Production and Marketing
Table 8.6
Pot ale syrup production capacity
Distillery Capacity (kla) Maximum pot ale
syrup production
Aberfeldy 1800 1300
Aberlour 3200 2300
Blair Athol 1700 1200
Dufftown 4000 2900
Glenallachie 2500 1800
Glenfarclas 3000 2100
Glenfiddich, Valvenie and Kininvie 20 000 14 300
Inchgower 2300 1600
MacDuff 2500 1800
Tomatin 7000 5000
Tomintoul 2800
2000
TOTAL 36 300

[16:01 13/3/03 n:/3991 RUSSELL.751/3991-008.3d] Ref: 3991 Whisky Chapter 8 Page: 255 242-273
The present combination of draff, pot ale syrup and barley dark-grain sales
volumes, primarily drive n by the need to process pot ale, has fortuitously
largely kept the market in balance, with the more perishable draff being
consumed mainly in Scotland and Northern England and the more concen-
trated, higher value PAS and BDG being transported and used throughout
Britain.
Grain distilleries
Both dried and moist feeds are produced by grain distilleries, the latter where
it is possible to dispose of the dilute centr ate or filtrate by extended sea pipe-
line (Supergrains and Vitagold) or evaporation to spent wash syrup (Loch
Lomond Gold).
Calculations of the volumes of grain distillers feeds are complicated by the
fact that most grain distilleries produce both grain spirit (for maturation in oak
to grain whisky) and the more highly rectified neutral spirit for use in gin,
vodka and other spirit-based drinks. Published statistics for grain spirit pro-
duction exclude neutral spirit volumes, which are commercially confidential.
Thus the figures given in Tables 8.7 and 8.8 for potential grain co-product
production will be approximately correct, but figures for actual production
will certainly be an underestimate (by probably about 20 per cent) as they do
not include the co-products derived from neutral spirit pro duction.
Figure 8.5 (see p. 265) shows the distribution of potential co-product pro-
duction with the relevant livestock population for the Scottish Regions.**35
The major consumers – dairy and beef cattle – are concentrated in the
Southwest of Scotland (where milder winters, higher rainfall and better land
Chapter 8 Co-products 255
Table 8.7
Grain moist feeds – calculated production at 61 per cent utilization (Year 2000)
Distillery
(product name)
Capacity
(kla/annum)
Cereal and
yeast residue
1
(t dry matter)
%
Recovery
2
% Dry
matter
Actual
tonnes of
product
Cameronbridge
(Supergrains)
56 000 27 518 50 25 55 000
Girvan (Vitagold) 60 000 29 484 60 30 59 000
Loch Lomond (L. Lom.
Super)
10 000 4914 50 25 10 000
(Loch Lomond Gold) 10 000 4914 50 38
6500
TOTAL 130 500
1
At assumed yield of 377 l alcohol/t cereal mashed.
2
Centrifuge processes assumed to be less efficient than filtration. Dried feeds (drying losses only)
assumedtobe3percent.