Pump Handbook by Igor J. Karassik, Joseph P. Messina, Paul Cooper, Charles C. Heald - 3rd edition
Подождите немного. Документ загружается.

2.2.7.2 CANNED MOTOR PUMPS 2.325
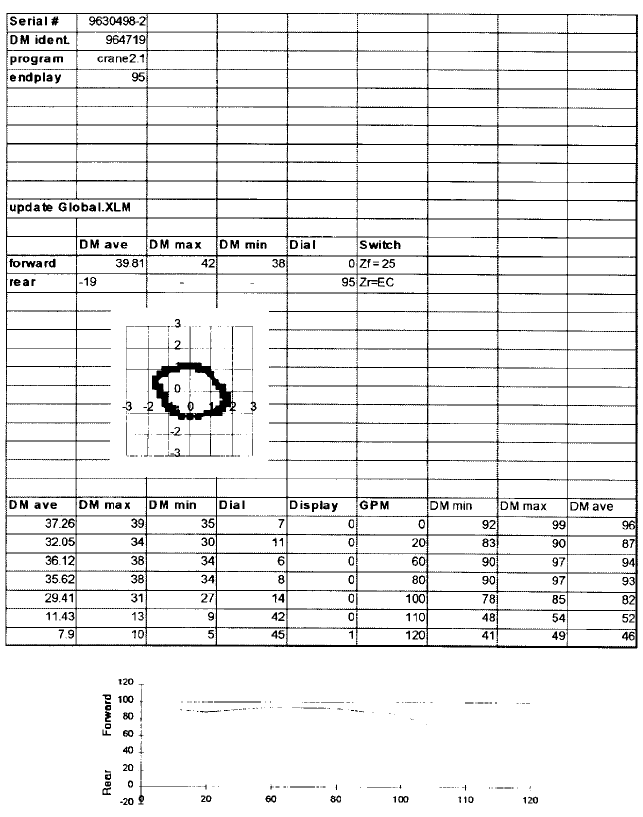
FIGURE 11 Rotor position output data
REFERENCES AND FURTHER READING_________________________________
1. American National Standard for Sealless Centrifugal Pumps, ANSI/HI 5.1-5.6-2000,
Hydraulic Institute, Parsippany, NJ www.pumps.org.
2. Hydraulic Institute ANSI/HI 2000 Edition Pump Standards, Hydraulic Institute, Par-
sippany, NJ www.pumps.org.
3. Sealless Pumps for Petroleum, Heavy Duty Chemical, and Gas Industry Services,API
Standard 685, 2000, American Petroleum Institute, 1220 L Street, Northwest, Wash-
ington, D.C. www.api.org.
4. Eierman, R. “A User’s View of Sealless Pumps
—
Their Economics, Reliability, and the
Environment.” Proceedings of the Seventh International Pump Users Symposium.
Texas A&M University, College Station Texas, March 1990, pp. 127
—
133.
5. Hernandez, T. “A User’s Engineering Review of Sealless Pump Design Limitations and
Features.” Proceedings of the Eighth International Pump Users Symposium. Texas
A&M University, College Station, TX, March 1991, pp. 129
—
145.
6. Littlefield, D. “Sealless Centrifugal Pumps.” Proceedings of the Eleventh International
Pump Users Symposium. Texas A&M University, College Station, TX, March 1994,
pp. 115
—
119.
2.326
CHAPTER TWO

2.3.1
CENTRIFUGAL PUMPS:
GENERAL PERFORMANCE
CHARACTERISTICS
C. P. KITTREDGE
PAUL COOPER
2.327
SECTION 2.3
CENTRIFUGAL PUMP
PERFORMANCE
DEFINITIONS ________________________________________________________
Nomenclature Many of the quantities involved in this subsection are also dealt with in
Section 2.1. Therefore, a single nomenclature that applies to both sections appears at the
beginning of Section 2.1. Differences in notation exist for some of these quantities as a
result of the coexistence of different traditions and pump cultures, so the nomenclature
shows the equivalence in each case. An example is the use in this subsection of “c” and
“w” to denote absolute and relative velocity respectively, whereas the NASA system of cap-
ital letters V and W is employed in Section 2.1.
Units The units used in this subsection are as defined in the nomenclature unless specif-
ically noted in the text. In particular, the primary units for this subsection are those of
the U.S. Customary System (USCS). A distinction in USCS usage in this subsection is that
the pound force (lbf) is represented simply as “lb”. In keeping with the commentary on SI
units in the front matter of this handbook, conversions to SI units are given throughout
this subsection, or the actual equivalent SI values are given in parentheses.
However, the number appearing in parentheses after the USGS value of specific speed
n
s
is the equivalent value of the universal specific speed
s
. Note that the value of specific
speed corresponding to the best efficiency point (BEP) operating conditions of the pump is
the value of interest and is often used to identify the impeller geometry involved.
Volume Flow Rate Abbreviated to “flow rate” and known traditionally as “pump capac-
ity” Q, this is the volume of liquid per unit time delivered by the pump. In USCS units, Q
is expressed in U.S. gallons per minute or USgpm, for which the abbreviation “gpm” is
2.328 CHAPTER TWO
used. (1 US gallon 231 in
3
.) For very large pumps, the units ft
3
/sec are used. The con-
sistent SI units m
3
/s are implied when an SI value of Q is
—
unless the numerically con-
venient liters per second (l/s) are specifically called out.
Datum for Pump Head As defined in Eq. 3 and Figure 1 of Section 2.1, the total head
has components of pressure, velocity, and elevation Z (or Z
e
). Because pump head H (more
precisely H) is the difference of the total heads evaluated at the discharge flange d and
the suction flange s respectively, the elevation of the datum from which Z is measured
cancels out. However, for purposes of identification, computing NPSH, and so on, the stan-
dard datum as shown in Figure 1 is used.
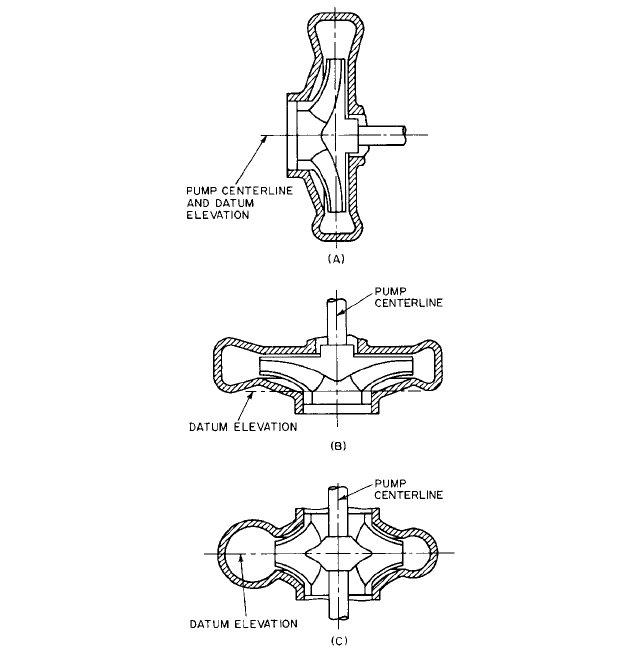
The standard datum for horizontal-shaft pumps is a horizontal plane through the
centerline of the shaft (Figure la). For vertical-shaft pumps, the datum is a horizontal
plane through the entrance eye of the first-stage impeller (Figure lb) if single suction or
through the centerline of the first stage impeller (Figure 1c) if double suction. Because
pump head is the difference between the discharge and suction heads, it is not necessary
that the standard datum be used, and any convenient datum may be selected for com-
puting the pump head.
FIGURE 1A through C Elevation datum for defining pump head (Hydraulic Institute ANSI/HI 2000 Edition
Pump Standards, Reference 27)

2.3.1 CENTRIFUGAL PUMPS: GENERAL PERFORMANCE CHARACTERISTICS 2.329
Power In USCS, the pump output is customarily given as liquid horsepower (lhp) or as
water horsepower if water is the liquid pumped. It is given by
(1)
where Q is in gallons per minute, H is in feet, and sp. gr. is specific gravity. If Q is in cubic
feet per second, the equation becomes
(2)
In SI, the power P in watts (W) is given by
(3)
where Q is in cubic meters per second and H is in meters.
When Q is in liters per second and H is in meters
(4)
Efficiency The pump efficiency h is the liquid horsepower divided by the power input
to the pump shaft. The latter usually is called the brake horsepower (bhp). The efficiency
may be expressed as a decimal or multiplied by 100 and expressed as percent. In this sub-
section, the efficiency will always be the decimal value unless otherwise noted. Some pump
driver-units are so constructed that the actual power input to the pump is difficult or
impossible to obtain. Typical of these is the “canned” pump for volatile or dangerous liq-
uids. In such case, only an overall efficiency can be obtained. If the driver is an electric
motor, this is called the wire-to-liquid efficiency or, when water is the liquid pumped, the
wire-to-water efficiency.
CHARACTERISTIC CURVES____________________________________________
Pump with Non-Viscous Flow and Zero Slip
The basic shapes of centrifugal pump
performance characteristics arising from various geometries can be ascertained and com-
pared without the necessity of evaluating the slip. (Illustrated in Figure 15 of Section 2.1,
the slip phenomenon is explained in the related discussion
1
.) For this purpose, one
employs the artifice of non-viscous flow through an impeller with an infinite number of
blades having infinitesimal thickness and that therefore produce neither structural (geo-
metric) nor flow (boundary layer) blockage. The result is the ideal head for no slip or block-
age H
e
as given by Eq. 5 (cf. Eq. 15b of Section 2.1):
(5)
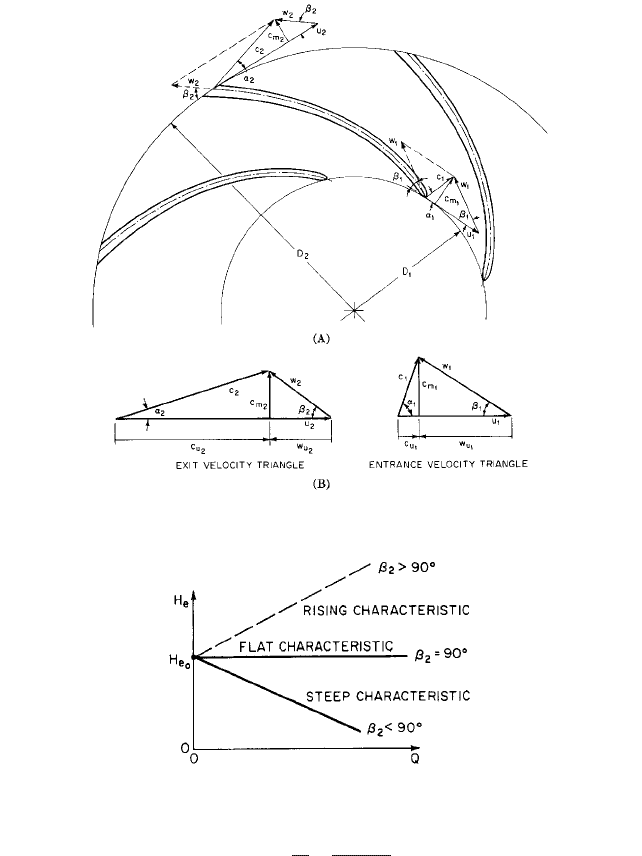
The velocity components in Eq. 5 can be seen in the velocity diagrams of Figure 2, slip
being neglected. Generally the inlet swirl term is small, and Eq. 5 can be approximated by
(6)
As shown in Figure 2b, the absolute velocity vector c may be resolved into the merid-
ional, or radial, velocity c
m
and the peripheral velocity c
u
. From the geometry of the figure
(7)
which, substituted into Eq. 6, gives
c
u2
u
2
c
m2
tan b
2
H
e
u
2
c
u2
g
H
e
u
2
c
u2
g
u
1
c
u1
g
P 9.797QH 1sp. gr.2
P 9797QH 1sp. gr.2
lhp
QH1sp. gr.2
8.82
lhp
QH1sp. gr.2
3960
2.330 CHAPTER TWO
FIGURE 2A and B Velocity diagrams for radial-flow impellers, neglecting slip and blockage
FIGURE 3 Head-versus-flow rate characteristics for non-viscous, zero-slip impeller flow
(7)
Neglecting leakage flow, the meridional velocity c
m
must be proportional to the capac-
ity Q. With the additional assumption of constant impeller speed, Eq. 8 becomes
(8)
in which k
1
and k
2
are constants, with the value of k
2
dependent on the value of the vane
angle b
2.
Figure 3 shows the H
e
vsQ characteristics for the three possible conditions on
the vane angle at exit b
2.
The second right-hand term in Eq. 5 may be treated in like man-
ner to the foregoing and included in Eqs. 8 and 9.The effect on Figure 3 would be to change
H
e
k
1
k
2
Q
H
e
u
2
2
g
u
2
c
m2
g tan b
2
2.3.1 CENTRIFUGAL PUMPS: GENERAL PERFORMANCE CHARACTERISTICS 2.331
FLOW RATE
FIGURE 4 Typical pump characteristics, backward-curved blades (ft 0.3048 = m; hp 745.7 = W; gpm
0.06309 = l/s)
the value of at Q 0 and the slopes of the lines, but all head-flow rate charac-
teristics would remain straight lines.
Viscous Flow with Slip The real flow situation involves friction losses in an impeller
with a finite number of relatively widely spaced blades. Thus, slip occurs, reducing the
exit flow angle b
f,2
below that of the blade b
2
, (or, more precisely, b
b,2
,) which in turn reduces
c
u2
(cf. Figure 15 of Section 2.1). Therefore, the ideal head H
i
drops below H
e
. Moreover,
losses and recirculation occur to cause additional deviation of pump head H from H
e
. While
CFD flow analysis can be employed to predict H with fair accuracy
2
, lesser means, such
as one-dimensional analysis, require experienced correlation and calibration skills to
make such predictions. Therefore, many engineers commonly depend on testing and
empirical modification of test results on the exact or similar geometry to make the final
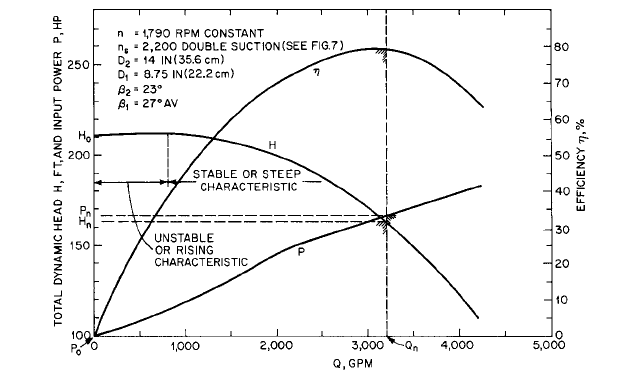
determination of the performance characteristics of a pump.This effort involves constant-
speed plots of data as shown in the example of Figure 4.
Pumps are designed to operate at the point of best efficiency. The head, power, and flow
rate at best efficiency, often called the normal values, are indicated in this subsection by
H
n
,P
n
, and Q
n
respectively. Sometimes a pump may be operated continuously at a flow rate
slightly above or below Q
n
. In such case, the actual operating point is called the rated or
guarantee point if the manufacturer specified this capacity in the guarantee. It is unusual
to operate a pump continuously at a flow rate at which the efficiency is much below the
maximum value. Apart from the unfavorable economics, the pump may be severely dam-
aged by continued off-design operation, as described later.
Backward-Curved Blades, B
2
6 90° Figure 4 shows the characteristics of a double-suc-
tion pump with backward-curved blades, b
2
23°. The impeller discharged into a single
volute casing, and the specific speed was n
s
2200 (
s
0.8) at best efficiency. At shut-
off (Q 0), Eq. 8 predicts H
e
to be 374 ft (114 m), whereas the pump actually developed
about 210 ft (64 m), and this head remained nearly constant for the range 0 6 Q 6 1000
gpm (63 l/s). For Q 7 1000 gpm (63 l/s), the head decreased with increasing capacity but
not in the linear fashion predicted by Eq. 9. At best efficiency, where Q
n
3200 gpm (202
l/s), Eq. 8 predicts H
e
281 ft (86 m), whereas the pump actually developed H
n
164 ft
(50 m).
H
e
u
2
2
>g
2.332 CHAPTER TWO
FLOW RATE
FIGURE 5 Pump characteristics, radial blades (ft 0.3048 = m; hp 745.7 = W; gpm 0.06309 = l/s)
(Reference 3)
Radial Blades, B
2
90° Large numbers of radial-blade pumps are used in many appli-
cations, from cellar drainers, cooling-water pumps for internal combustion engines, and
other applications where low first cost is more important than high efficiency to highly
engineered pumps designed for very high heads. The impellers are rarely more than 6 in
(15 cm) in diameter, but the speed range may be from a few hundred to 30,000 rpm or more.
The casings usually are concentric with the impellers and have one or more discharge noz-
zles that act as diffusers. The impellers usually are open, with three or more flat blades.
The clearance between blades and casing is relatively large for easy assembly. Such pumps
exhibit a flat head-capacity curve from shutoff to approximately 75% of best efficiency flow
rate, and beyond this flow the head-flow curve is steep. The pumps develop a higher head,
up to 8000 ft (2400 m) per stage, than pumps with backward-curved blades, but the effi-
ciency of the former usually is lower. (See also Subsection 2.2.1.)
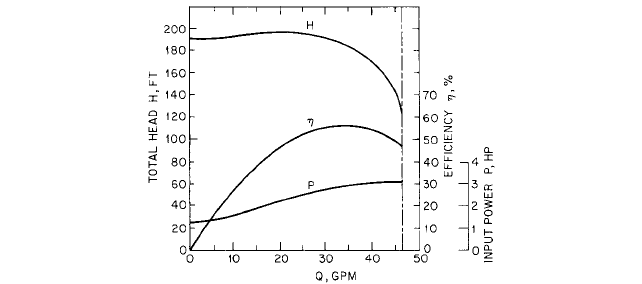
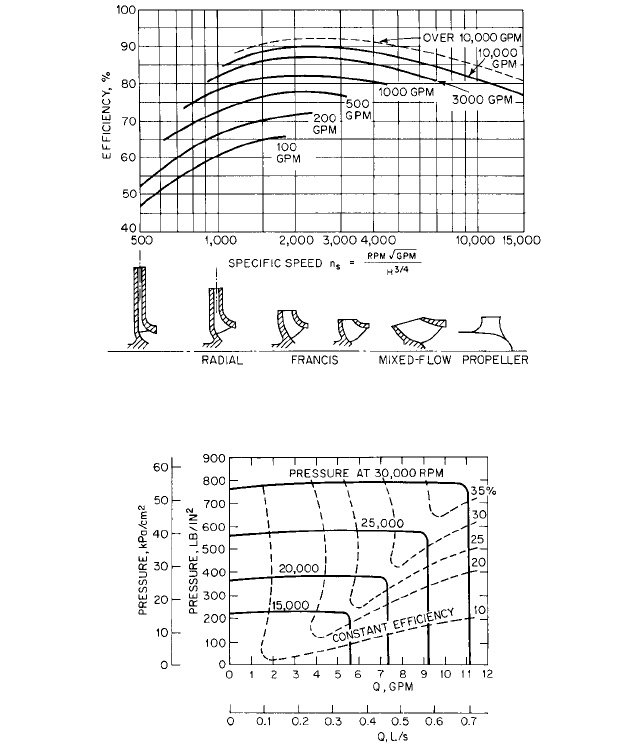
Figure 5 shows the characteristics of a pump as reported by Rupp.
3
The impeller was
fully shrouded, D 5.25 in (13.3 cm), and fitted with 30 blades of varying length.The best
efficiency, h 55%, was unusually high for the specific speed n
s
475 (0.174), as may be
seen from Figure 6. The head-flow curve showed a rising (unstable) characteristic for 0 6
Q 6 25 gpm (1.6 l/s) and a steep characteristic for Q 7 25 gpm (1.6 l/s).
Figure 7 shows the characteristics of a pump as reported by Barske.
4
The impeller was
open, D 3 in (7.6 cm), and fitted with six radial tapered blades.The effective b
2
may have
been slightly greater than 90° due to the taper. At 30,000 rpm, the best efficiency was more
than 35% at n
s
355 (0.130), which is much higher than for a conventional pump of this
specific speed and capacity (Figure 6). The head-flow curve showed a nearly flat charac-
teristic over most of the usable range, as predicted by Eq. 8, but the head was always lower
than H
e
. The smooth concentric casing was fitted with a single diffusing discharge nozzle.
When two or more nozzles were used, the head-flow curves showed irregularities at low
flow rates and became steep at high flow rates.
Manson
5
has reported performance characteristics for jet engine fuel pumps having
straight radial blades in enclosed impellers. The head curves showed unstable charac-
teristics at low flow rates and steep characteristics at higher flow rates. The best effi-
ciency reported was 54.7% for an impeller diameter of 3.300 in (8.382 cm) and speed n
28,650 rpm.
Forward-Curved Blades, B
2
7 90° Pumps with forward-curved blades have been pro-
posed,
6
but the research necessary to achieve an efficient design appears never to have
been carried out. Tests have been made of conventional, backward-curved-blade, double-
suction pumps with the impellers mounted in the reversed position but with rotation cor-
rect for the volute casing. As tested, these pumps therefore had forward-curved blades.
2.3.1 CENTRIFUGAL PUMPS: GENERAL PERFORMANCE CHARACTERISTICS 2.333
FLOW RATE
FLOW RATE
FIGURE 7 Pump characteristics, radial blades (lb/in
2
6.894 = kPa; gpm 0.06309 = l/s) (Reference 4)
Table 1 shows the pertinent results for six different pumps. Both flow rate and effi-
ciency were drastically reduced, and there was only a modest increase in head for five of
the six pumps.The sixth pump showed a 38% increase in head over that obtained with the
impeller correctly mounted. Published estimates
7,8
of the head-flow curves to be expected
from reversed impellers predict an unstable characteristic at the low end of the flow rate
range and a steep characteristic at the high end of the range.
PERFORMANCE EFFECTS_____________________________________________
Classification of Curve Shapes
A useful method for comparing characteristics of
pumps of different specific speeds is to normalize on a selected operating condition, usu-
ally best efficiency. Thus,
FIGURE 6 Pump efficiency versus specific speed and size (gpm 0.06309 = l/s) (Flowserve Corporation)
(
s
= n
s
/2733)

2.334 CHAPTER TWO
TABLE 1 Effects of reversed mounting of impeller
Number Specific speed Percent of
Percent of normal values at best efficiency
of per stage normal
stages n
s
(
s
) shutoff head Head Flow Rate Power Efficiency
2 828 (0.303) 86 111 65 104 71
2 1024 (0.375) 82 112 88 145 68
1 1240 (0.454) 75 105 38.5 68.5 59
1 1430 (0.523) 82 106 69.7 138 53.5
1 2570 (0.940) 74.5 117 62 138 52.5
1 2740 (1.003) 77.5 138 61.5 180 47
Source: Flowserve Corporation
(10)
where the subscript n designates values for the best efficiency point. Figures 8, 9, and 10
show approximate performance curves normalized on the conditions of best efficiency and
for a wide range of specific speeds as defined in Table 2. These curves are applicable to
pumps of any size because absolute magnitudes have been eliminated. In Figure 8, curves
1 and 2 exhibit a rising head or unstable characteristic where the head increases with
increasing flow rate over the lower part of the flow rate range. This may cause instability
at heads greater than the shutoff value, particularly if two or more pumps are operated in
parallel. Curve 3 exhibits an almost constant head at low flow rates and is often called a
flat characteristic. Curves 4 to 7 are typical of a steep or stable head characteristic, in
which the head always decreases with increasing flow rate. Although the shape of the
head-flow curve is primarily a function of the specific speed, the designer has some control
through selection of the vane angle b
2
number of impeller vanes n
b
, and capacity coeffi-
cient f c
m2
/u
2
, as described in Section 2.1 (see also Figure 2). For pumps having a single-
suction specific speed approximately 5000 (1.83) and higher, the power is at its maximum
at shutoff and decreases with increasing flow rate. This may require an increase in the
power rating of the driving motor over that required for operation at normal capacity.
Efficiency The efficiency h is the product of three component efficiencies (defined in Sec-
tion 2.1):
(11)
The mechanical efficiency h
m
accounts for the bearing, stuffing box, and all disk-friction
losses including those in the wearing rings and balancing disks or drums if present. The
volumetric efficiency h
v
accounts for leakage through the wearing rings, internal
labyrinths, balancing devices, and glands. The hydraulic efficiency h
h
accounts for liquid
friction losses in all through-flow passages, including the suction elbow or nozzle, impeller,
diffusion vanes, volute casing, and the crossover passages of multistage pumps. Figure 11
shows an estimate of the losses from various sources in double-suction single-stage pumps
having at least 12-in (30-cm) discharge pipe diameter. Minimum losses and hence maxi-
mum efficiencies are seen to be in the vicinity of n
s
2500 (0.91), which agrees with Fig-
ure 6.
Effects of Pump Speed Increasing the impeller speed increases the efficiency of cen-
trifugal pumps. Figure 7 shows a gain of about 15% for an increase in speed from 15,000
to 30,000 rpm. The increases are less dramatic at lower speeds. For example, Ippen
9
reported about 1% increase in the efficiency of a small pump, D 8 in (20.3 cm) and h
s
1992 (0.73), at best efficiency, for an increase in speed from 1240 to 1880 rpm. Within
limits, the cost of the pump and driver usually decreases with increasing speed. Abrasion
h h
m
h
v
h
h
q
Q
Q
n
h
H
H
n
p
P
P
n