Prinz H. Numerical Methods for the Life Scientist
Подождите немного. Документ загружается.

The differences between analytical and numerical solutions can, of course, be
neglected for all practical reasons. They are more than a million-fold lower than
the calculated values for bound ligand. If the accuracy of numerical solutions is
an issue, it can be optimized in MATLAB with the optimset command.
Figure 5.2 is shown here as a caveat. There may be a situation where numerical
solutions give unexpected results. We all have a tendency to believe in
computers, bu t numerical artifacts must not be ignored. If they are suspected,
they can be detected by switching between Octave and MATLAB or with
modifying the optimization parameters or even running the same program on a
different computer platform.
5.3 Equilibrium Binding to Two Sites (EQ2.m)
Reaction scheme (2.19) shows ligand binding to a receptor where two binding sites
are accessible. The corresponding set of equations is given in (2.24) and (2.25).
Obviously, they differ from the set of equations calculated in EQ1.m so that the
function EQ1F has to be modified. A modified program should have a new name,
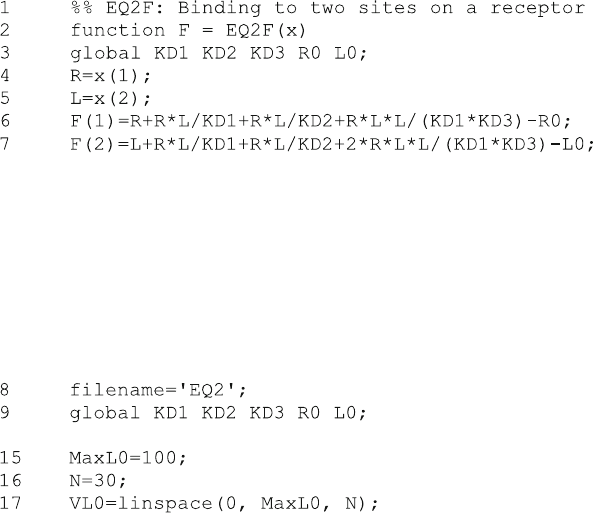
and EQ2F is appropriate. Equations (2.24) and (2.25) translate to:
Please note a programming technique, which is unnecessary for the computer,
but makes life much easier for the programmer. When the equations become more
complex, it is a good idea to replace x(1) by R and x(2) by L in lines 6 and 7.Of
course, R and L have to be assigned, and this is done in lines 4 and 5 before they are
used for the equations.
The main program is stored as EQ2.m. Again the concentrations of complexes
are calculated inside a loop for each ligand concentration in lines 23–29, and the
plot command in line 32 can use the vectors generated within the loop.
50 5 Equilibrium Binding
The plot command is used to plot the concentrations of all complexes. This is
done in line 32. The legend in line 38 (not shown here) is changed accordingly.
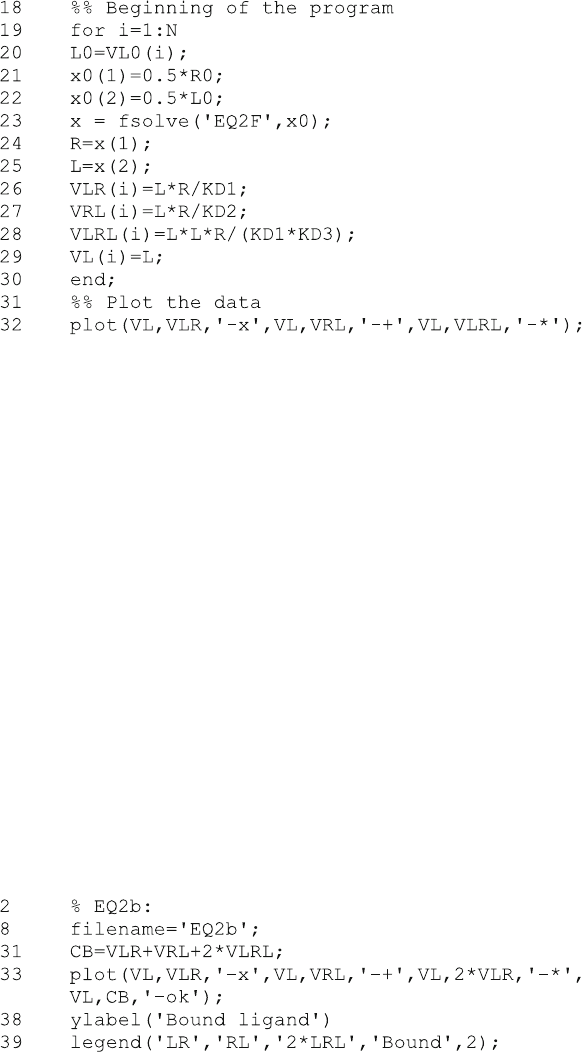
Figure 5.3 shows the concentrations of LR, RL and LRL as a function of the free
ligand conce ntration. Note that the concentrations of the monoliganded complexes
LR and RL only differ by the same factor at all ligand concentrations. This is a
general property of all equilibrium-binding curves, where complexes with the same
number of ligands only differ by a given factor at all ligand concentrations. The
complex LRL initially shows a sigmoid increase. This has nothing to do with
cooperativity. It simply results from concentration dependence of the plot, where
monoliganded complexes LR and RL are favored at lower ligand concentrations
than the saturated complex LRL.
How to modify the sample program. The para meters in the progr am EQ2.m are
specified in lines 9–12, and can easily be modified. For extremely low receptor
concentrations, one may consider (5.6) and replace x0(2) ¼ 0.5*L0; in line 29
with x0(2) ¼ L0-0.5*R0;
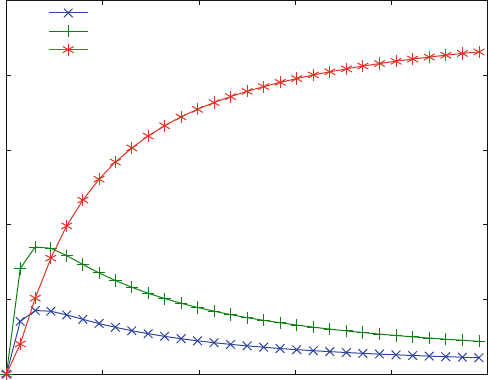
One practical modification is shown in EQ2b.m: Most binding studies do not
measure the concentration of comp lexes, as in Fig. 5.3, but the concentration of
bound ligand. The concentration C
B
of bound ligand is
C
B
¼ RL þ LR þ 2 LRL (5.7)
To plot this, the following lines are modified:
5.3 Equilibrium Binding to Two Sites (EQ2.m) 51
Lines 2 and 8 are required when the name of the program is changed. It is
advisable to rename a program every time it is modified. Line 31 is a translation of
(5.7) into Octave code. Line 33 is the modified plot command. Note that it is
possible to do simple operations like 2*VLR within the plot command, and also
note that it is possible to define colors in the plot style (defined with quotes). The
three symbols of '-ok' at the end of line 40 translate into –: solid line o: point
style as circle and k: color black. The colors are specified in Octave as 'k' black,
'r' red, 'g' green, 'b' blue, 'm' mag enta, 'c' cyan and 'w' white. Figure 5.4
is a diagram of bound ligand rather than a diagram of the different complex
concentrations. Of course, the bound ligand of the complex LRL is 2·LRL.
5.4 Equilibrium Binding to Two Sites in the Presence
of Inhibitor (EQ3.m)
When a second ligand can also bind to the receptor, the reaction scheme looks
complicated, although the underlying mechanism is not. In most cases, the second
ligand is an inhibitor so that the second ligand is denoted as I in scheme (5.8). Just
0
0.2
0.4
0.6
0.8
1
0 20 40 60 80 100
Concentration of Complexes
Concentration of [L] (free li
g
and)
Equilibrium Binding - Two accessible sites (EQ2.m)
LR
RL
LRL
Fig. 5.3 Equilibrium binding to two independent sites. For reaction scheme (2.19), the
concentrations of complexes LR (x) RL (+) and LRL (*) are plotted versus the free ligand
concentration. The calculated affinities are KD1 ¼ KD3 ¼ 5 mM for the first and KD2 ¼ KD4
¼ 10 mM for the second site
52 5 Equilibrium Binding
0
0.5
1
1.5
2
0 20 40 60 80 100
Bound Ligand
Concentration of [L] (free li
g
and)
Equilibrium Binding - Two accessible sites (EQ2b.m)
LR
RL
2*LRL
Bound
Fig. 5.4 Ligand binding to a receptor with two sites. For reaction scheme (2.19), the concentration
of bound ligand (0) is plotted versus the free ligand concentration. The contribution of the
complexes LR (x) RL (+) and LRL (*) to the total binding curve is shown. The affinities in
(1.19) are K
D
1 ¼ 50 mM, K
D
2 ¼ 20 mM, K
D
3 ¼ mM and K
D
4 ¼ 12.5 mM
0
0.5
1
1.5
2
0 20 40 60 80 100
Concentration of bound ligand
Concentration of [L] (free li
g
and)
Equilibrium Binding - Two sites with Inhibitor (EQ3.m)
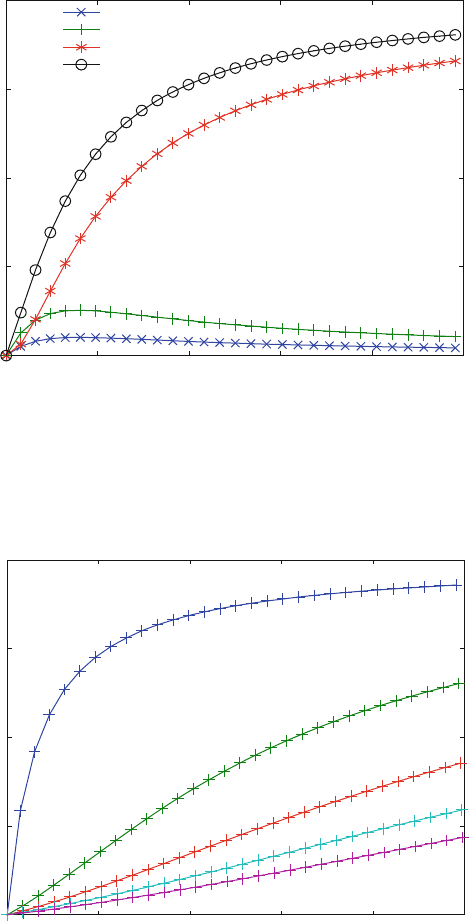
Fig. 5.5 Equilibrium binding – two sites with inhibitor. The concentration of bound ligand was
calculated from reaction scheme (5.8) with KD1 ¼ 10 mM, KD2 ¼ 5 mM, KD3 ¼ 5 mM, KI1
¼ 3 mM, KI2 ¼ 5 mM, KI3 ¼ 3 mM, KI5 ¼ 10 mM and KI6 ¼ 10 mM. The total inhibitor
concentrations are (from top to bottom) 0, 25, 50, 75 and 100 mM. The total receptor concentration
is 1 mM
5.4 Equilibrium Binding to Two Sites in the Presence of Inhibitor (EQ3.m) 53
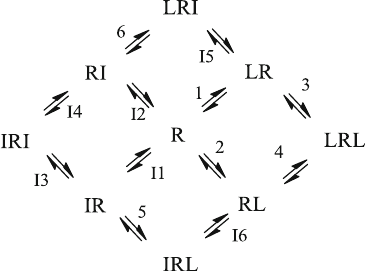
like L in scheme (2.19), the inhibitor I may bind to two sites. In reaction scheme
(5.8), the assignment of the sites to the resp ective affinities is consistent with
scheme (2.19) so that the equilibrium dissociation constant K
I
1 for the inhibitor
concerns the “left” site, just like the equilibrium dissociation constant K
D
1 for the
ligand. There are two mixed complexes, LRI and IRL. LRI can either be formed by
the addition of L to RI (equilibrium dissociation constant K
D
6) or by the addition of
I to LR, with the equilibrium dissociation constant K
I
5.
ð5:8Þ
To simplify the reaction scheme, free ligands are not shown explicitly in (5.8).
Moreover, the reactions are not assigned with their rate constants, but simply with
numbers. The letter I in front of the reaction number indicates that inhibitor is added
at this reaction step.
There are four coupled equilibria, i.e. four closed circles in (5.8). Similar to
(2.22) the affinities of the three additional ternary complexes must be independent
of the reaction pathway so that in addition to (2.23), (5.9)–(5.11) must hold. This
reduces the number of independent variables from 12 to 8 independent equilibrium
dissociation constants.
K
D
1 K
D
3 ¼ K
D
2 K
D
4 (2.23)
K
I
1 K
I
3 ¼ K
I
2 K
I
4 (5.9)
K
D
2 K
I
6 ¼ K
I
1 K
D
5 (5.10)
K
D
1 K
I
5 ¼ K
I
2 K
D
6 (5.11)
The dependent equilib rium dissociation constants are calculated in lines 18–21
of the main program EQ3.m.
54 5 Equilibrium Binding
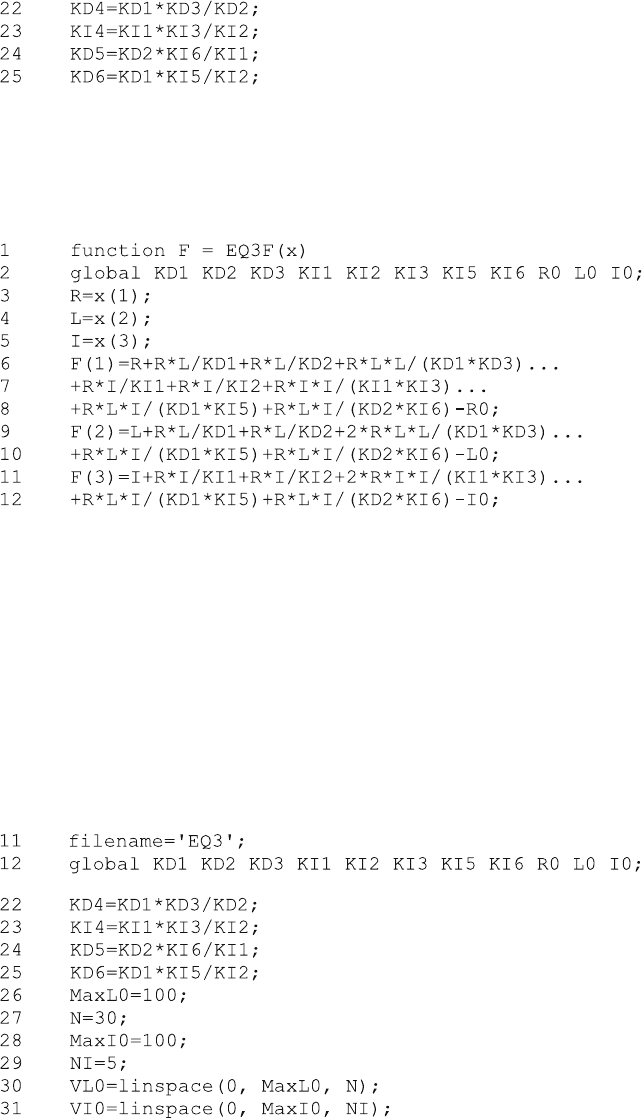
These four equilibrium dissoci ation constants are not required in EQ3F.m and
therefore need not be included in the global declaration in line 2 of EQ3F.m and
line 12 of EQ3.m. The main difference to EQ2.m is the additional ligand I which
translates to the addi tional independent variable x(3) in line 5 and to the addi-
tional equation F(3) in lines 11–12 of EQ3F.m:
The three equations with the three unknowns R, L and I in lines 6–12 follow the
pattern described in (2.31). For each of these equations, all (free, bound and total)
concentrations involving the respective unknown (R, L or I) of scheme (5.8) have to
be included. Each of the com plexes required for the bound concentration is calcu-
lated by the law of mass action from free receptor R, free ligand L and free inhibitor
I concentration. Note that bound ligand calculated from LRL in line 9 involves the
factor 2, since two ligand molecules are bound in that comp lex. The same is true for
IRI in line 11 .
The binding curves are calculated with arrays of 30 ligand and 5 inhibitor
concentrations as defined in lines 26–31. These concentrations are varied in a
nested loop with the index i varying between 1 and 30 and the index k varying
between 1 and 5. The loops run between lines 33 and 54.
5.4 Equilibrium Binding to Two Sites in the Presence of Inhibitor (EQ3.m) 55
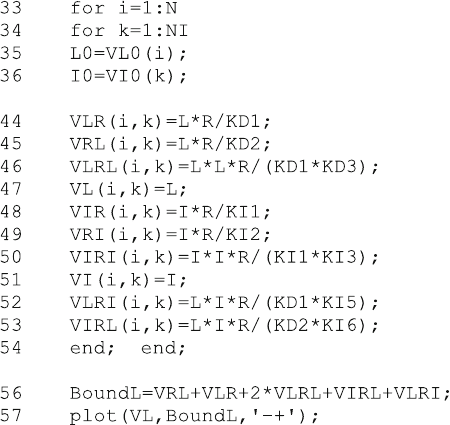
The concentrations of all eight complexes as well as the free ligand and inhibitor
concentrations are calculated in lines 44–53 within the loop. The bound ligand
BoundL can then be calculated outside the loop. Note that the concentrations
generated inside the loop are not just vectors (arrays) of concentrations at different
total ligand concentration, but now are matrixes (spreadsheets) of conce ntrations at
different total ligand and total inhibitor concentration. The elements of these
matrices are identified with the indices i and k. For spreadsheets, rows are typically
addressed with numbers and columns with letters. A matrix element VRL(3,2)
therefore would correspond to the cell B3 in a spreadsheet. For readers familiar with
spreadsheets, this relation may help to identify the matrix elements.
It has been mentioned in Chap. 4 that every variable in Octave is treated by default
as a matrix. The statement in line 56 therefore is matrix addition, so each element of
the spreadsheet VRL is added to each corresponding element of VLR and so forth.
This leads to rather elegant programming code. Likewise, the plot command in line
56 looks elegant and simple, but it plots five columns of bound ligand calculated for
five different inhibitor concentrations versus the corresponding columns of substrate
concentration. The results are shown in Fig. 5.5.
Increasing the number of ligands and/or the number of sites and/or the number of
conformational states can be done in two steps. First, one has to make a list of all the
expected complexes and calculate them as products of their free concentrations
divided by the respective equilibrium dissociation const ants, just like those in lines
6–8 of EQ3F.m. With an increasing number of complexes it may be more
complicated to draw a reaction scheme than to write down these equations. The
second step consists of writing one equation of the type (2.31) for each ligand. The
resulting set of equations F(x) has to be solved by fsolve in the main program.
56 5 Equilibrium Binding
This procedure can get as complex as one likes, but always follows the same
pattern.
The main advantage of numerical methods and a high-level programming
language consists in its flexibility. One can calculate the concentration dependence
of any complex or any set of complexes. For example, fluorescence resonance
energy transfer (FRET) is specific for the interaction of ligand and inhibitor and can
be employed to study its mechanism [2]. Part of the signal often is proportional to
the concentrations of ternary complexes, where both types of ligands are bound to
the receptor simultaneously. Modifying the program EQ3.m and plotting the
ternary complexes versus the substrate concentration is performed with the program
EQ3b.m and the statements below:
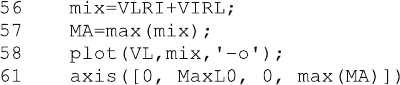
In line 56 the mixed ternary complexes IRL and LRI are added, because they
show the same dependence on inhibitor and ligand concentr ation. The function max
() in lines 57 and 61 is worth mentioning. For a matrix, it returns the maximal
values for each column in a matrix. Therefore, the result of line 56 is a row vector
MA with the maximal values of mix calculated at the five different inhibitor
concentrations. For a vector argument, the function max in line 61 simply returns
the maximal value so that max(MA) is the maximal value of all ternary complexes
at all inhibitor concentrations. The resulting plot is shown in Fig. 5.6.
The concentrations of the ternary complexes IRL and LRI alike depend on both
the ligand and the inhibitor concentrations. At high ligand concentration, the ligand
competes with the inhibitor and forms LRL, and at high inhibitor concentrations,
the inhibitor mainly binds as IRI. Therefore, the concentration dependence of the
ternary complexes is not easy to predict and has to be calculated. Note the circles on
the x-axis. They should correspond to the concentration of ternary complexes in the
absence of inhibitor and should all be zero. With the numerical solution returned
from the Octave algorithm, some were slightly negative and thus could not be
plotted within the axes defined in line 61. This problem had been addressed in
Fig. 5.2 and disc ussed in Sect. 2.6.
5.5 Allosteric Interactions of Subunits (EQ4.m)
The term “allosteric” is used differently in the literature [3]. For most cases today, it
states that a ligand may bind to a protein and elicit a conformational change . This
change may then change the properties of the protein at another (“allosteric”) site.
In contrast, the concerted model for oxygen binding to hemoglobin of Monod,
Wyman and Changeux [4] (“MWC” model) concerns the allosteric interactions of
5.5 Allosteric Interactions of Subunits (EQ4.m) 57
protein subunits. It assumes that the four hemoglobin subunits may exist in two
conformational states (R and T) even in the absence of ligand as shown in reaction
scheme (5.12).
ð5:12Þ
These conformational states traditionally are named R (for relaxed) and T (for
tense). In the absence of ligand, the subunits are predominantly in the R conforma-
tion ([R] > [T] translates to K
D
2 > 1 in scheme (5.12)). If the ligand L has a higher
affinity for T (K
D
3 < K
D
1) then the equilibrium of these conformational states is
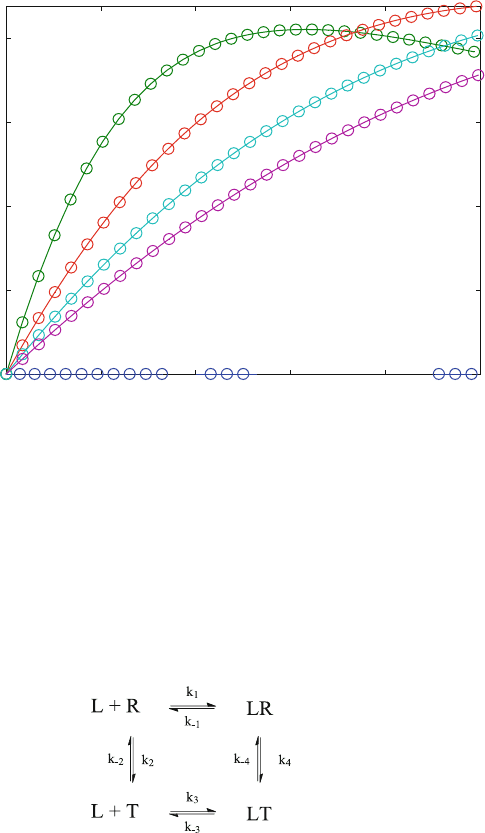
shifted upon binding. The binding equilibrium of reaction scheme (5.12) is calcu-
lated from the set of equations given in EQ4a.m:
0
0.05
0.1
0.15
0.2
0 20 40 60 80 100
Concentration of bound ligand
Concentration of [L] (free li
g
and)
Equilibrium Binding - Two sites with Inhibitor (EQ3b.m)
Fig. 5.6 Concentration of ternary complexes IRL + LRI calculated from reaction scheme (5.8)
with KD1 ¼ 10 mM, KD2 ¼ 5 mM, KD3 ¼ 5 mM, KI1 ¼ 3 mM, KI2 ¼ 5 mM, KI3 ¼ 3 mM,
KI5 ¼ 10 mM and KI6 ¼ 10 mM. The total inhibitor concentrations are (from top to bottom) 25,
50, 75 and 100 mM. The total receptor concentration is 1 mM
58 5 Equilibrium Binding
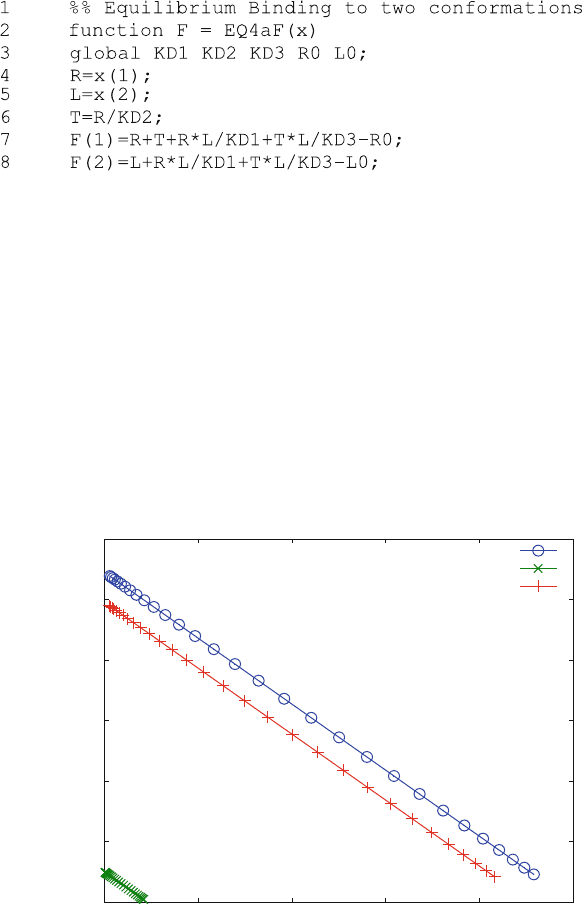
Line 6 calculates the equi librium concentration of T so that this conformational
state can then be used in lines 7 and 8. These equations again calculate the sums of
all (free, bound and total) receptor and all (free, bound and total) ligand
concentrations. The program EQ4a.m solves equations 7 and 8 and calculates a
binding curve as a Scatchard plot (Fig. 5.7)
Figure 5.7 illustrates a general principle of equilibrium binding; no matter how
many conformations are there, they will always be in equilibrium at any given ligand
concentrations. The concentrations of conformational states differ by the same factor
at all ligand concentrations in equilibrium studies. Consequently, since only one
binding site is involved, the Scatchard plots are linear for the bound ligand ([LT] +
[LR]), as well as for the complexes [LR] and [LT]. Reaction scheme (5.12)shows
coupled equilibria with two conformational states, but only one site. The cooperative
0
0.002
0.004
0.006
0.008
0.01
0.012
0 0.02 0.04 0.06 0.08 0.1
Concentration bound / free ligand
Concentration of bound li
g
and
Scatchard Plot - Two conformations R and T (EQ4a.m)
Bound
LR
LT
Fig. 5.7 Scatchard Plot: Equilibrium binding to a receptor in two conformational states, R and T.
Reaction scheme (5.12) was calculated with KD1 ¼ 100 mM, KD2 ¼ 100 mM, KD3 ¼ 100 nM
and a receptor concentration of R0 ¼ 100 nM. The ligand L0 concentration was varied from 0.1 to
100 nM. Total bound ligand (o) as well as the two single bound complexes LR (x) and LT(+) are
shown in the Scatchard diagram
5.5 Allosteric Interactions of Subunits (EQ4.m) 59