Orton C., Tyers P., Vince A. Pottery in archaeology
Подождите немного. Документ загружается.

Distribution of artefact types
199
container for agricultural products. The amphora trade in the Graeco-
Roman world is not an exercise in transporting amphoras
per se
but it is the
items they contain that are important - wine, olive oil or
fish
sauces.
Such distributions reflect areas of production versus areas of consumption
and in the latter the appearance of these new materials may have
effects
on
other aspects of behaviour such as cooking or drinking habits. These may in
turn generate a need for other items, such as specialised drinking or serving
vessels, which may themselves be ceramic or made in other materials. Thus
we may often be seeking a set of items, a service, as part of the underlying
explanation for the appearance of the individual components.
Turning to the interpretation of distributional
evidence we
can examine the
data from two viewpoints. The traditional approach is to plot the find spots
of types and proceed from there. As evidence accumulates about the history
and source of pottery types we can start to build up a picture of the sources of
pottery recovered on a site and construct maps of pottery supply. The use of
both types of map (discussed below) allows a full understanding of the
pottery supply and distribution systems in a region to be investigated.
Distribution of artefact types
Distribution maps hold an important place in archaeology and the practice of
compiling distributions of pottery types and interpreting them has a long
history (Abercromby 1904). We can distinguish three types of artefact
mapping, which should be viewed as a hierarchy of increasing information
content. The simplest forms of distribution maps are those confined to the
plotting of individual find-spots, perhaps on a base map showing outline
topography, road-systems, towns and so on. When their limitations are
recognised such maps provide a valuable summary of the overall extent of the
distribution of a type and often provide the first stage in its study. Find-spot
maps are particularly suitable for compilation
from
published sources. They
record the presence of an item on a site and serve in part as an index or
pointer to further information. However they provide no indication as to the
relative abundance of a type and each point on the map carried equal weight.
The density of points in a given area may however provide valuable infor-
mation - if we were dealing with a map of a single
fabric,
for which
we
would
expect a single source, we might expect a higher density of sites close to the
source, and a lower density further away. A simple 'contour map' may be
produced from site density data of this type using a technique such as grid
generalisation (Orton 1980, 124-30; Hodder and Orton 1976), although the
procedure must be applied with care.
The second form of distribution map is that where some quantitative
element is attached to the points in the form of simple counts. The count may
be printed on the map next to the point, or the counts are split into ranges
(1-9, 10-19,20-9 and so on), each with a
different
symbol, or the symbol may
200 Production and distribution
Argonne
.-kilns 4
O Plain sherds present
•
1-5
sherds with roller stamped decoration
# 6-10 sherds with roller stamped decoration
%
11-20
sherds with roller stamped decoration
£ Over 20 sherds with roller stamped decoration
100 miles
200 kms
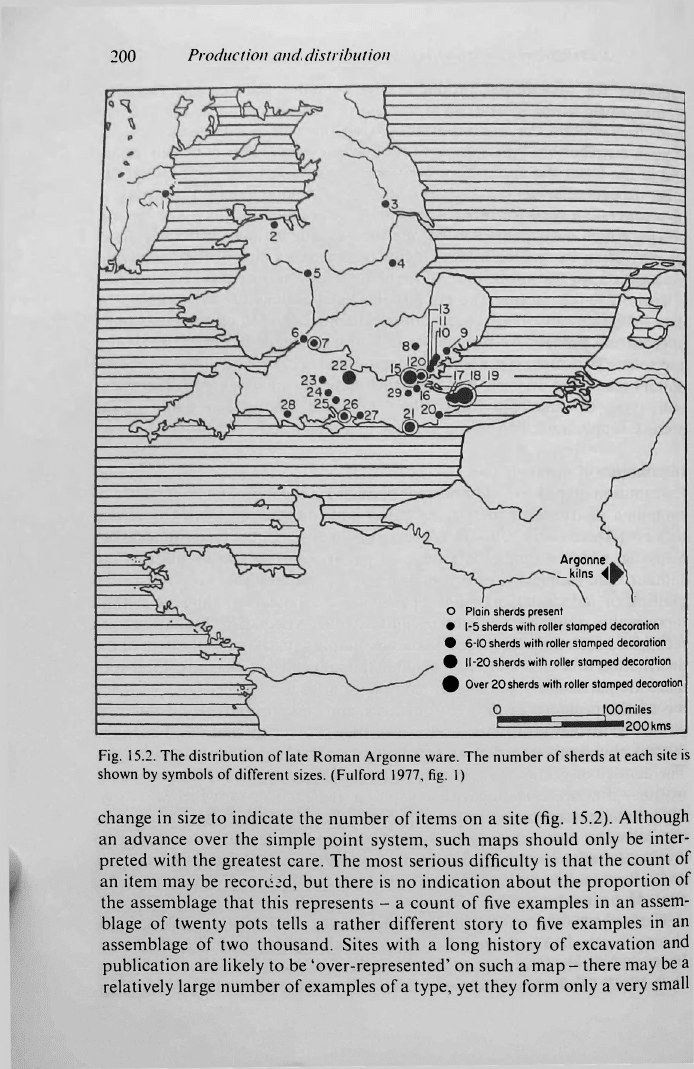
Fig. 15.2. The distribution of late Roman Argonne ware. The number of sherds at each site is
shown by symbols of different sizes. (Fulford 1977, fig. 1)
change in size to indicate the number of items on a site (fig. 15.2). Although
an advance over the simple point system, such maps should only be inter-
preted with the greatest care. The most serious difficulty is that the count of
an item may be recorded, but there is no indication about the proportion of
the assemblage that this represents - a count of five examples in an assem-
blage of twenty pots tells a rather different story to five examples in an
assemblage of two thousand. Sites with a long history of excavation and
publication are likely to be 'over-represented' on such a map - there may be a
relatively large number of examples of a type, yet they form only a very small
Distribution of artefact types
201
proportion of the assemblage. It is invariably necessary to interpret such
maps in the light of archaeological knowledge. An additional advance over
the find-spot map is to record appropriate sites where the type is absent,
which is usually by using a symbol for the special count 'zero' - 'appropriate'
in this context being sites considered to be contemporary with the type in
question. Again the question of numbers is important - absence from a small
assemblage being less significant than absence from a large assemblage. Such
'mapped counts' are often surprisingly difficult to compile from published
sources - it is rare for complete catalogues to be available from all but a few
sites and the introduction of counts into the picture opens up all sorts of
complexities, which become even more acute in the case of the next type of
map.
The most advanced of the three map types considered here is the quantita-
tive distribution map, in which the 'symbol' represents the proportion of the
assemblage formed by the type being mapped. Again symbols of different
sizes
may represent
different
ranges (< 5%, < 10%, < 20%, < 50% and so on),
or the symbol itself may be in the form of a pie-chart (fig. 2.1). A standard
method of quantification is clearly essential (see above p. 168).
The quantitative distribution map may be adapted to answer a range of
questions. If the pie-chart symbol is used it may be possible to plot more than
one type on the same map using different shades or colours for the different
groups. The values plotted on the map need not be expressed as proportions
of the type in question in the whole assemblage. It may be appropriate to
consider one table ware fabric as a proportion of all table wares, a cooking
pot fabric as a proportion of all cooking wares or all amphoras as one group,
or plot different varieties of one class of wares. It may even be suitable to
confine the plot to the relative proportions of two types - perhaps the
products of two different kilns - if one is only concerned with the relationship
between them.
Fully quantitative distribution maps are more or less impossible to compile
from published sources as the number of site reports including the appro-
priate data is very small. Even if a crude measure such as 'vessels represented'
was felt to be sufficient, the number of reports where the values are recorded
as a matter of routine is minimal - recourse may have to be made to making
rough estimations by counting up the illustrations and deciphering comments
in the text.
However, once available, a full measure is amenable to all manner of
manipulation. Perhaps the most useful is the fall-off curve for which the type
source must also be known. The classic application of regression analysis is to
the distribution of Romano-British Oxfordshire ware (Fulford and Hodder
1974). The initial regression line calculated for the proportion of Oxfordshire
products on thirty sites was not a good fit to the data - a better fit was
obtained by separating the sites into two groups, those most easily reached by
202 Production and distribution
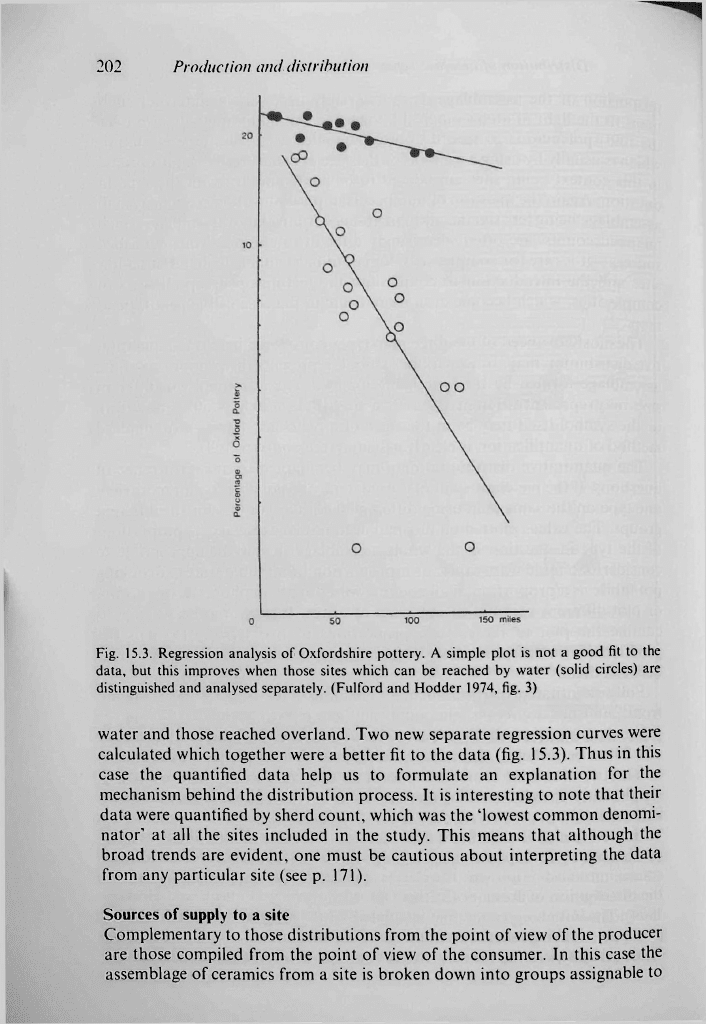
Fig. 15.3. Regression analysis of Oxfordshire pottery. A simple plot is not a good fit to the
data, but this improves when those sites which can be reached by water (solid circles) are
distinguished and analysed separately. (Fulford and Hodder 1974, fig, 3)
water and those reached overland. Two new separate regression curves were
calculated which together were a better fit to the data (fig. 15.3). Thus in this
case the quantified data help us to formulate an explanation for the
mechanism behind the distribution process. It is interesting to note that their
data were quantified by sherd count, which was the 'lowest common denomi-
nator' at all the sites included in the study. This means that although the
broad trends are evident, one must be cautious about interpreting the data
from any particular site (see p. 171).
Sources of supply to a site
Complementary to those distributions from the point of view of the producer
are those compiled from the point of view of the consumer. In this case the
assemblage of ceramics from a site is broken down into groups assignable to
The identification of source from distribution
203
different
sources, which are plotted on a map. In the simplest form the source
sites may be marked by a simple symbol, perhaps indicating the type of
pottery produced. As a summary of the site supply such maps may be
adequate for many purposes but the temptation to indicate the trade routes
supplying pottery to the destination site with a 'join-the-dots' exercise should
in
most cases be resisted. The identification of the mechanisms responsible for
the distribution process will only be possible by considering data on a larger
scale than that presented by a single site.
A more sophisticated approach to site supply maps requires the use of
quantitative data. One common approach is for the size of the source symbol
to reflect the proportion of the assemblage supplied to a destination site. If
appropriate it may be possible to split the destination assemblage into periods
and illustrate the site supply at each period. A set of such maps have been
compiled by Going, illustrating the supply of pottery to Chelmsford during
the Roman period (Going 1987, figs. 52-9; fig. 15.4). The shifting patterns of
supply are clearly demonstrated by examining a sequence of such maps. For
this purpose, and many others, it is essential that the entire assemblage is
quantified to give the complete picture of ceramic supply.
When enough analysis of this type has been carried out, it will be possible
to start looking at the differences in supply pattern between contemporary
sites in the same area. We might expect that different types of site may draw
their ceramic supplies from different sources, depending on such factors as
social status, occupation, wealth and so on of the inhabitants. Certain types
of site may show preferential access to some products, but it is only against
the background of a wider analysis that such patterns will emerge - it is not
adequate to extrapolate from only one or two observations.
The identification of source from distribution
One particular aspect of the analysis of distribution evidence which deserves
special consideration is the identification of likely source areas for pottery
types based on the distribution evidence alone, and in the absence of pro-
duction sites or other indications of the source.
In the basic model of distribution from a central point we may expect the
highest concentrations nearest to the source and a simple fall-off curve in all
directions. The 'concentrations' should be of three types:
(i) an increased proportion of sites with the product;
(ii) an increased proportion of the product on those sites;
(hi) an increased range of types on those sites.
This ideal picture is rarely realised and many factors alter the final picture.
As we have seen above, topography will intervene. Transport by river or sea
rather than by land will distort the pattern, almost invariably to the advan-
tage of the former over the latter.
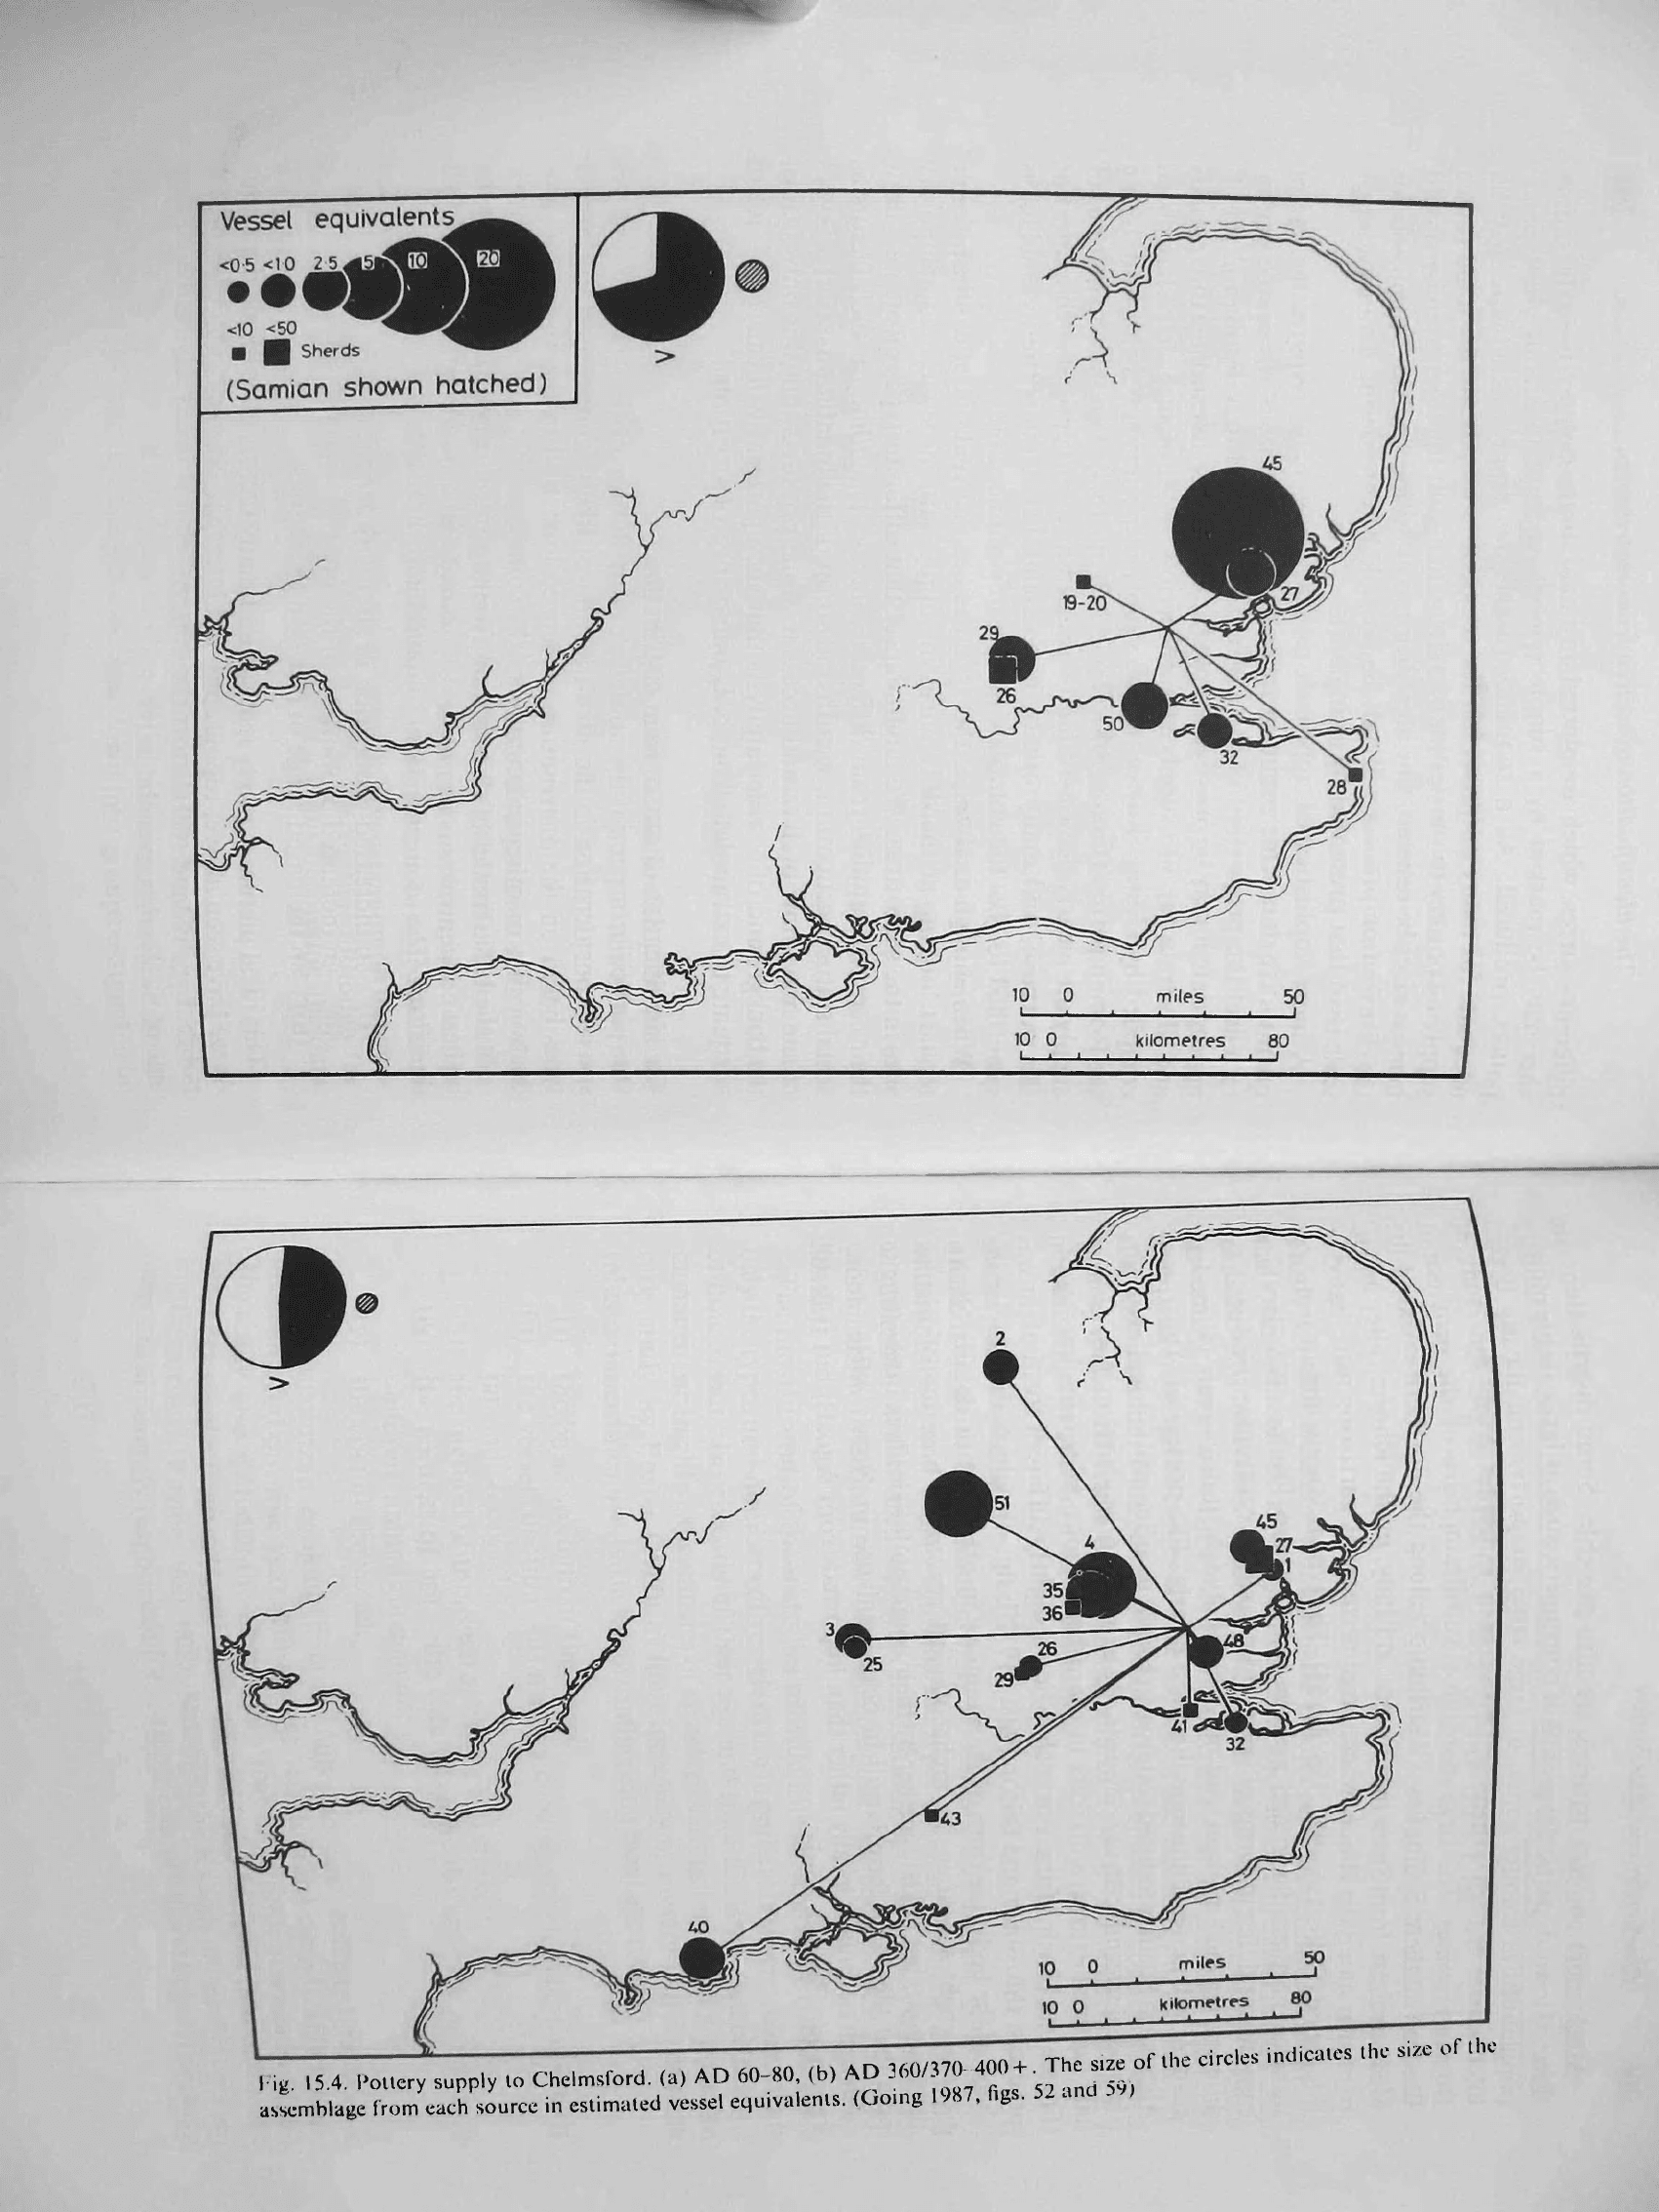
Fig. I
assemblage
5.4. Pottery supply to Chelmsford, (a) AD 60-80, (b) AD {MM«*»!
blase from each source in estimated vessel equivalents. (Going 1987, figs. 52 and mi
of the circles indicates the size of the
206 Production and distribution
Much more complex patterns are also possible. Some distributions are
directed towards particular groups of consumers, such as large stable military
populations in frontier zones, or large cities or ports, and mostly bypass
intermediate regions. There are many such examples from the study of
Roman ceramics. The large globular olive oil amphora of the province of
Baetica (southern Spain) has a distribution along the northern coast of the
Mediterranean from Spain into France and Italy, up the Rhône valley and in
particular along the Rhine, where large permanent garrisons were based at
this period (Colls et al. 1977, 136, fig. 53). The type is largely absent from, for
instance, northern Spain and western and northern France. We also have
cases where different forms of vessel from a single centre are produced for
different regional markets, and only distributed in those areas. A modern
example will perhaps illustrate this most clearly. The potters at Agost, near
Alicante in Spain, produced water jars
('botijo)
in a fine white local clay from
the mid-nineteenth century onwards. By expanding production they eventu-
ally captured extensive markets in the other regions of Spain, but also in
France and North Africa. For each region a slightly different form of jar was
produced (Mossman and Selsor 1988, 219-20, fig. 4), which differed in the
shape of the body, the form of the spouts or in other minor details. Such a
pattern might appear in the archaeological record as a series of distinct
distributions, but linked together by their common fabric. It is interesting to
note that the botijo form is still in occasional use in North Africa today
(although now made locally rather than imported from Agost), but it is still
known as a 'Spanish bottle'.
17
ASSEMBLAGES AND SITES
Firstly we will examine some general theoretical considerations concerning
the formation of archaeological deposits and the ceramic assemblages they
contain. We will then consider one of the more important of the factors
governing the relationship between the ceramics in use and that recovered
from archaeological contexts - the use-life or life expectancy of the material.
The value of sherd-link data is next discussed, followed by considerations of
pottery collected from field walking and the role of quantification in the
examination of site-formation problems.
Pottery life-expectancy
There is a small but valuable body of 'ceramic census data' collected by
ethnographers and others detailing the types of pottery in use in individual
households, which archaeologists have drawn upon in several ways as an
aid in their interpretation of archaeological assemblages (Kramer 1985,
89-92).
The most useful of these studies provide lists or inventories detailing not
only the types and numbers of vessels in use in particular villages, compounds
or houses but also records of their age and from the latter may be derived
estimates for the life expectancies of vessels of various forms or
functions.
An
early study by Foster (1960) of life expectancy of pottery in Tzintzuntzan
(Mexico) identifies five basic factors influencing breakage rates:
(i) the basic strength of the vessel;
(ii) the vessel function - its use as a cooking vessel, water jar, storage
jar and so on;
(in) the method of use, such as the type of stove;
(iv) the context of use - the care taken by the user, the activities of
children, animals and so on;
(v) the cost of the vessel.
At Tzintzuntzan cooking pots in daily use were estimated to have a
life-span of about one year, but storage vessels lasted considerably longer.
The study also includes the observation that 'a surprising amount of [the]
breakage results from cats, chickens, dogs and pigs bumping pots or knock-
ing them over' (Foster 1960, 608). Amongst the Kalinga in the Philippines
dogs are apparently responsible for c.
10
per cent of all breakages (Longacre
207
208 Assemblages and sites
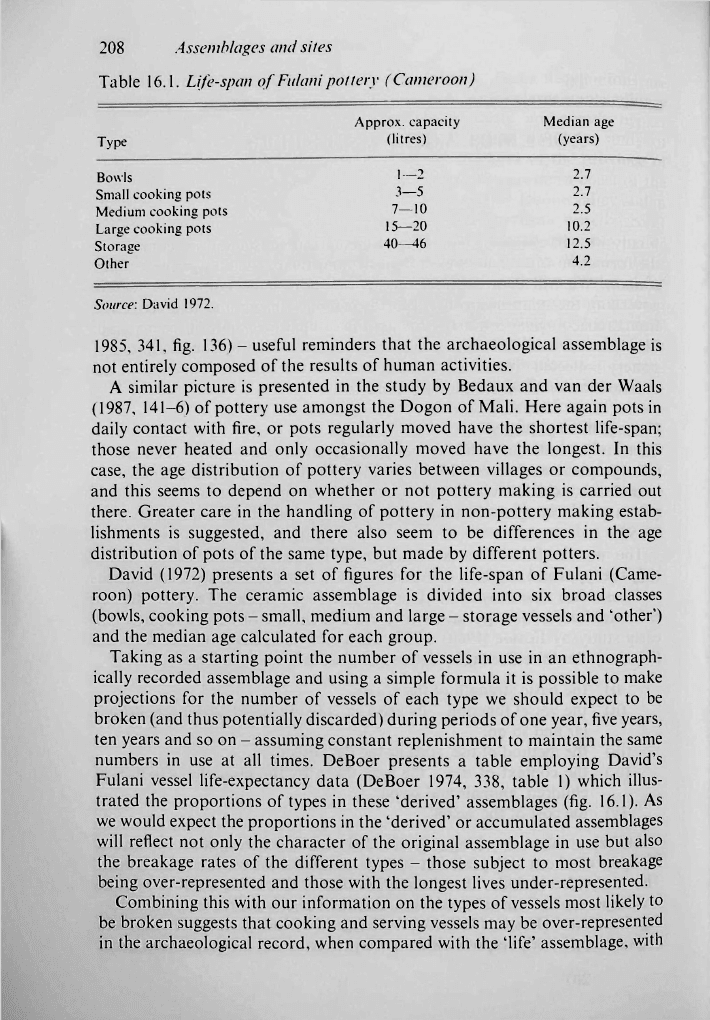
Table 16.1. Life-span of Fulani pottery (Cameroon)
Approx. capacity
Median age
Type
(litres) (years)
Bowls
1—2
2.7
Small cooking pots
3—5 2.7
Medium cooking pots
7—10 2.5
Large cooking pots
15—20
10,2
Storage
40—46
12.5
Other
4.2
Source: David 1972.
1985, 341, fig. 136) - useful reminders that the archaeological assemblage is
not entirely composed of the results of human activities.
A similar picture is presented in the study by Bedaux and van der Waals
(1987, 141-6) of pottery use amongst the Dogon of Mali. Here again pots in
daily contact with fire, or pots regularly moved have the shortest life-span;
those never heated and only occasionally moved have the longest. In this
case, the age distribution of pottery varies between villages or compounds,
and this seems to depend on whether or not pottery making is carried out
there. Greater care in the handling of pottery in non-pottery making estab-
lishments is suggested, and there also seem to be differences in the age
distribution of pots of the same type, but made by different potters.
David (1972) presents a set of figures for the life-span of Fulani (Came-
roon) pottery. The ceramic assemblage is divided into six broad classes
(bowls, cooking pots - small, medium and large - storage vessels and 'other')
and the median age calculated for each group.
Taking as a starting point the number of vessels in use in an ethnograph-
ically recorded assemblage and using a simple formula it is possible to make
projections for the number of vessels of each type we should expect to be
broken (and thus potentially discarded) during periods of one year, five years,
ten years and so on - assuming constant replenishment to maintain the same
numbers in use at all times. DeBoer presents a table employing David's
Fulani vessel life-expectancy data (DeBoer 1974, 338, table 1) which illus-
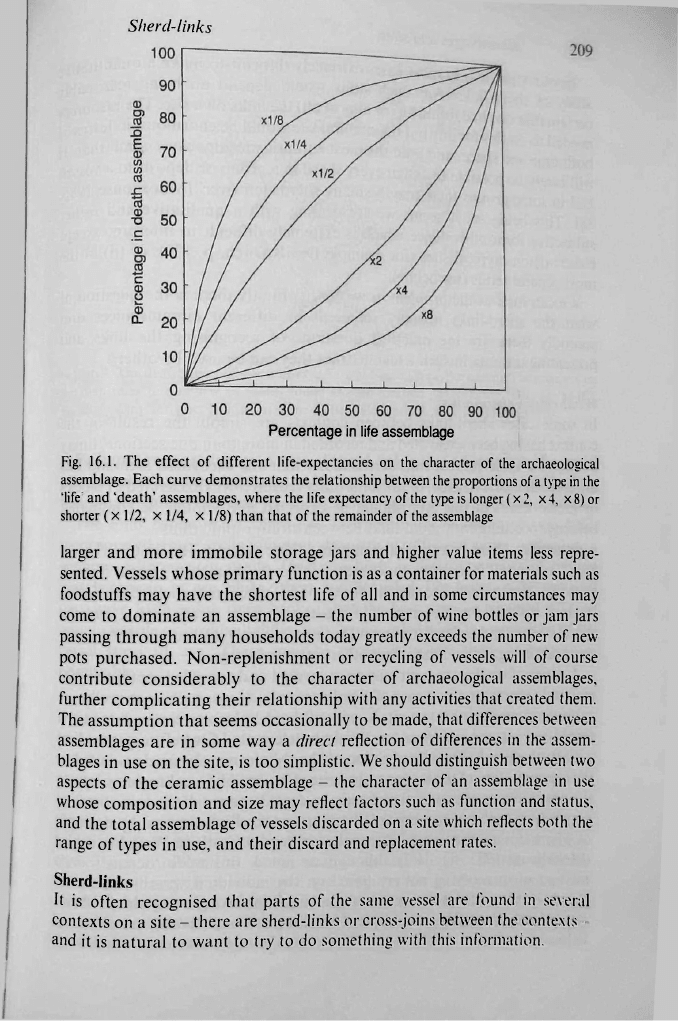
trated the proportions of types in these 'derived' assemblages (fig. 16.1). As
we would expect the proportions in the 'derived' or accumulated assemblages
will reflect not only the character of the original assemblage in use but also
the breakage rates of the different types - those subject to most breakage
being over-represented and those with the longest lives under-represented.
Combining this with our information on the types of vessels most likely to
be broken suggests that cooking and serving vessels may be over-represented
in the archaeological record, when compared with the 'life' assemblage, with
Sherd-links
Percentage
in
life assemblage
Fig. 16.1. The effect of different life-expectancies on the character of the archaeological
assemblage. Each curve demonstrates the relationship between the proportions of a type in the
'life and 'death' assemblages, where the life expectancy of
the
type is longer (x
2,
x
4,
x
8)
or
shorter (x 1/2, x 1/4, x 1/8) than that of the remainder of the assemblage
larger and more immobile storage jars and higher value items less repre-
sented. Vessels whose primary function is as a container for materials such as
foodstuffs may have the shortest life of all and in some circumstances may
come to dominate an assemblage - the number of wine bottles or jam jars
passing through many households today greatly exceeds the number of new
pots purchased. Non-replenishment or recycling of vessels will of course
contribute considerably to the character of archaeological assemblages,
further complicating their relationship with any activities that created them.
The assumption that seems occasionally to be made, that differences between
assemblages are in some way a direct reflection of
differences
in the assem-
blages in use on the site, is too simplistic. We should distinguish between two
aspects of the ceramic assemblage - the character of an assemblage in use
whose composition and size may reflect factors such as function and status,
and the total assemblage of vessels discarded on a site which reflects both the
range of types in use, and their discard and replacement rates.
Sherd-links
It is often recognised that parts of the same vessel are found in several
contexts on a site - there are sherd-links or cross-joins between the contexts -
and it is natural to want to try to do something with this information.
