Ojima I. (ed.) Fluorine in Medicinal Chemistry and Chemical Biology
Подождите немного. Документ загружается.

Structure Analysis of Membrane Active Peptides 471
tensor is well known and it is uniaxial, making calculations easier. The dipolar coupling
can be accurately determined from the splitting in the NMR spectrum, without need for
referencing. In our recent peptide studies we have therefore used various CF
3
- labeled
amino acids, which will be described below in Section 18.3.2 .
The CF
3
- group of these amino acids is rigidly attached to the peptide backbone and
refl ects the overall peptide orientation. Due to fast rotation of the CF
3
- group, the three
pairwise dipolar interactions among the three fl uorine nuclei are all averaged in the same
way and give rise to an average dipolar tensor, which is oriented along the C
α
– C
β
- bond
vector. From the measured dipolar coupling, the orientation of the tensor can be deter-
mined, which fi xes the orientation of the bond in the magnetic fi eld [49] . Normally, only
the absolute value of the dipolar coupling can be determined from the spectrum; however,
for a CF
3
- group the chemical shift change with orientation is of a magnitude similar to
that of the change in dipolar coupling. The sign of the splitting can thus be determined
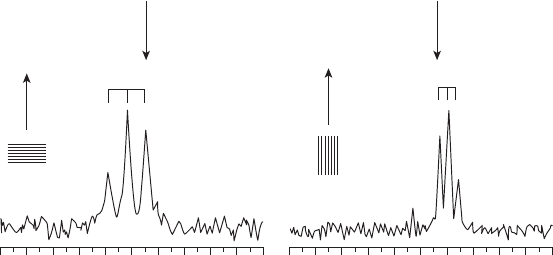
directly from the position of the chemical shift [49] , as described in Figure 18.4 .
18.2.3 Structure and Orientation Calculations
Using a number of orientational constraints from NMR measurements, the orientation of
the peptide in the membrane can be determined, assuming that the structure of the peptide
is known. The peptides we have studied mostly have well defi ned structures, such as α -
helices or rigid cyclic conformations. The validity of the proposed peptide structure as it
interacts with the membrane can also be tested using the fi t of the data [45, 49] . For
example, the data can be fi tted to different helical models, such as α - and 3
10
- helix: a good
50 10
0° Tilt
90° Tilt
+6.7 kHz
–3.3 kHz
–30 –70
ppm
B
0
B
0
ppm
–110 –150 50 10 –30 –70 –110 –150
Figure 18.4
19
F NMR spectra of MSI - 103, where Ile - 13 is replaced with CF
3
- Phg in DMPC
at P/L = 1 : 400. The left spectrum was measured with the bilayer normal parallel to the
magnetic fi eld and the right spectrum was measured with the bilayer normal perpendicular
to the magnetic fi eld. Because of fast rotation of the peptide around the bilayer normal, the
splittings at are scaled by a factor of − 1/2. The sign of the dipolar coupling can be deduced
from the position of the triplet relative to the isotropic chemical shift (close to − 60 ppm,
marked by an arrow). When the triplet is downfi eld of the isotropic chemical shift, the
coupling is positive, and if it is shifted upfi eld, the coupling is negative.

472 Fluorine in Medicinal Chemistry and Chemical Biology
fi t can only occur for one structure and will thus give an indication that this is the actual
structure inside the membrane.
In principle, the peptide orientation is fully defi ned by the tilt and azimuthal angles
described in Figure 18.3 . However, peptides interacting with a membrane are mobile, and
to account for this motion a simplifi ed order parameter, S
mol
, is introduced, which has the
effect of scaling all the calculated splittings by a factor between 0 and 1 [4, 23, 44 – 47,
49 – 51] . S
mol
= 0 would correspond to complete isotropic averaging, where all the orienta-
tional information would be lost, and S
mol
= 1 corresponds to a completely immobile
peptide. The peptides in our studies usually have S
mol
values between 0.6 and 0.8. This
gives information about the mobility of the peptides and can also be used to estimate the
size of aggregates. More elaborate motional models have recently been investigated (E.
Strandberg et al. , submitted), but have shown that the calculated values of tilt and azi-
muthal angles for the systems investigated were virtually identical to those obtained using
the more simple approach described here. For our peptides, we thus determine the tilt
angle, the azimuthal angle, and S
mol
. In principle, three constraints are needed to determine
these three parameters, each constraint being obtained from a
19
F NMR measurement on
a singly
19
F - labeled peptide. In practice, at least four
19
F - labeled peptides are used in order
to get a more reliable result, to make sure all the data are consistent, and to rule out any
possible structural perturbations due to introduction of
19
F - labeled amino acids.
After measuring several local dipolar splittings, these data are used to calculate the global
orientation of the full peptide. From the known structure of the peptide, theoretical curves show
which dipolar couplings are expected for different labeled positions, depending on tilt angle τ ,
azimuthal angle ρ , and S
mol
. The calculated values of splittings are then compared with the
experimentally obtained values, and the root mean square deviation (RMSD) is calculated.
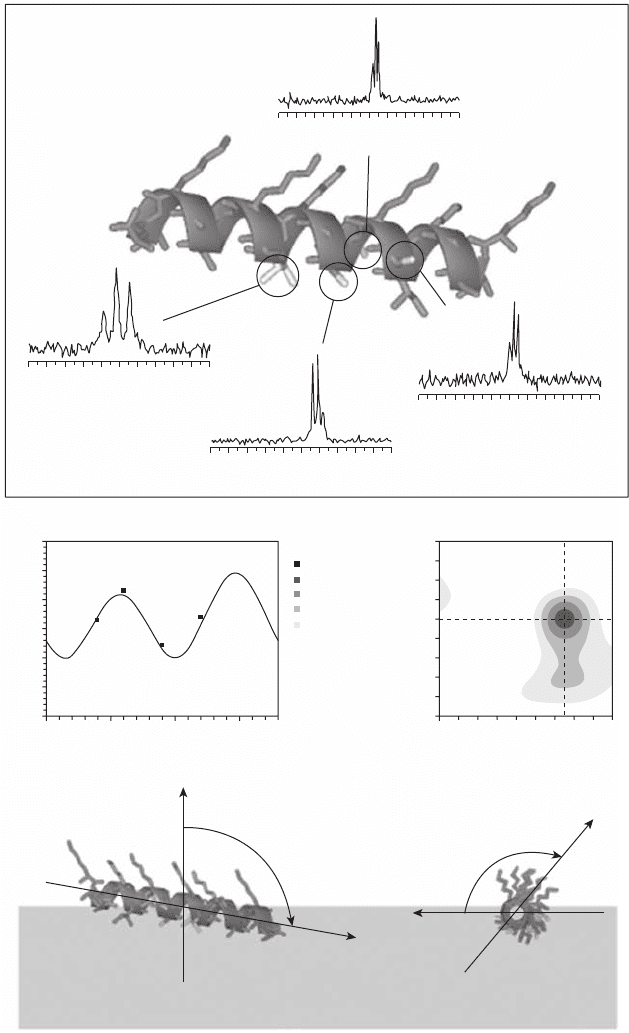
An example of how the procedure works is shown in Figure 18.5 . The peptide in this
example is MSI - 103, which has been labeled with
19
F at the four positions indicated in
Figure 18.5 a. Four different peptides were synthesized where a single amino acid (Ala - 7,
Ile - 9, Ala - 10, or Ile - 13) was replaced with CF
3
- Phg. For each label a
19
F NMR spectrum
is recorded (see Figure 18.5 a); in this example, spectra are from MSI - 103 in DMPC (1,2 -
dimyristoyl - sn - glycero - 3 - phosphocholine) at a peptide - to - lipid molar ratio (P/L) = 1 : 400,
Figure 18.5 (a) The peptide MSI - 103 was labeled with CF
3
- Phg at four positions, marked in
lighter gray. For each label a
19
F NMR spectrum was recorded in DMPC at P/L = 1 : 400. From
these spectra the dipolar couplings were measured, giving the values shown next to each
spectrum. (b) The measured dipolar couplings are compared with theoretical curves for
different orientations of the peptide. The best - fi t curve is here shown together with experimental
data for the different labeled positions (fi lled squares). (c) The RMSD plot shows the root
mean square deviation between experimental and calculated splittings, for all possible
combinations of tilt and azimuthal angles. In this case, the best - fi t tilt angle ( τ ) is 101 ° and
the azimuthal angle ( ρ ) is 130 ° . (d) Side view of the peptide in the membrane, which is
represented by a gray box. The tilt angle defi nes the angle between the peptide long axis and
the membrane normal. (e) View of the peptide along the helical axis. The azimuthal angle
defi nes how much the peptide is rotated around its axis, with the starting point defi ned as
the vector from the helical axis to C
α
of residue Lys - 12 being parallel with the bilayer
surface.
Structure Analysis of Membrane Active Peptides 473
(a)
+1.5 kHz
+6.7 kHz
–2.7 kHz
+2.2 kHz
Ile-9
Ile-13
Ile-13
15
(b)
(d) (e)
(c)
10
5
0
160
120
80
40
0
–5
–10
–15
Ile-9
Ala-7
Ala-7
Ala-10
Ala-10
RMSD / kHz
0.0 – 1.0
1.0 – 2.0
2.0 – 3.0
3.0 – 4.0
4.0 – 5.0
5.0
50 10 –30 –70
ppm
–110 –150
50 10 –30 –70
ppm
–110 –150
50 10 –30 –70
0 100 200
Position around helix / degrees
Tilt angle / degrees
Dipolar coupling / kHz
300 0 40
τ = 101°
ρ = 130°
80
Rotation angle / degrees
160120
ppm
–110 –150
50 10 –30 –70
ppm
–110 –150
474 Fluorine in Medicinal Chemistry and Chemical Biology
and dipolar couplings are measured. Each coupling gives information about the orientation
of the respective C
α
– C
β
- bond vector of the labeled residue with respect to the magnetic
fi eld. The measured couplings are then used to determine the best - fi t orientation of the
whole peptide. The experimentally observed splittings (fi lled squares in Figure 18.5 b) are
then compared with theoretical splittings, calculated for different peptides orientations.
The x - axis in Figure 18.5 b shows the angle of the label as in a helical wheel projection,
with the fi rst amino acid at 0 ° , the second amino acid at 100 ° and so on; angles larger
than 360 ° are projected back into the 0 – 360 ° region. A change in azimuthal angle will
shift the dipolar curve along the x - axis of the plots, keeping the same shape, while a change
in tilt angle will change the amplitude and shape of the curve. Figure 18.5 b shows the
best - fi t curve of calculated splittings, which corresponds to the darkest area in the RMSD
plot in Figure 18.5 c. In this plot, for each possible combination of τ and ρ , the RMSD
between experimental and calculated splittings is shown in a gray - scale code. In this case,
the best - fi t tilt angle ( τ ) is 101 ° , the azimuthal angle ( ρ ) is 130 ° , and the corresponding
orientation of the peptide in the membrane is illustrated in Figures 18.5 d and 18.5 e.
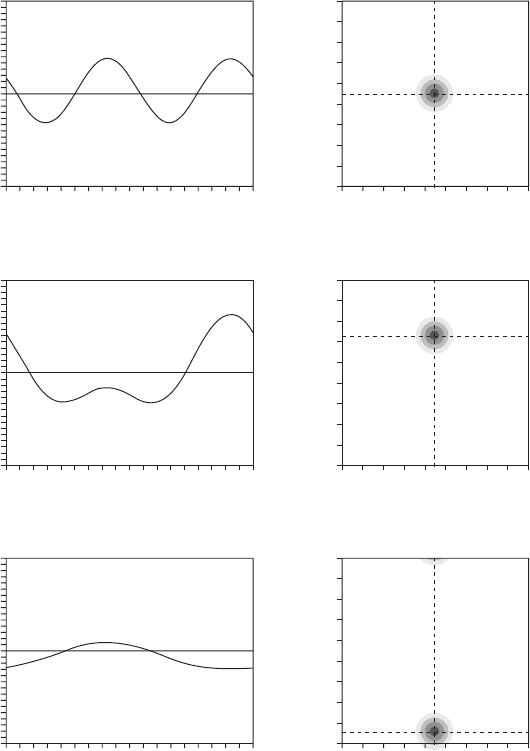
For a given secondary structure of the peptide, the shape of the dipolar curve is
characteristic of the peptide tilt. Figure 18.6 shows the theoretical dipolar curves for a
surface - bound S - state ( τ ≈ 90 ° ), an inserted I - state ( τ ≈ 0 ° ), and a tilted T - state
(0 ° ≤ τ ≤ 90 ° ) orientation of a helical peptide. The positions in the τ / ρ - plot corresponding
to the different states are indicated. (For exact values of τ and ρ used in the calculations,
see the fi gure legend.) It can be noted that the curve in Figure 18.6 a is very similar to the
curve of Figure 18.5 b, both of which correspond to an S - state orientation of the peptide.
Additional dynamic information can be obtained from oriented samples. The lipid
membranes can be oriented with the bilayer normal either parallel to the magnetic fi eld
(0 ° tilt) or perpendicular to the magnetic fi eld (90 ° tilt). If the peptides rotate quickly
around the bilayer normal, then, according to simple theory of motional averaging, the
measured splittings at 90 ° tilt should be − 1/2 times the splitting at 0 ° tilt. Figure 18.4
shows such
19
F NMR - spectra of a peptide with fast rotation. On the other hand, if the
peptide does not rotate, then the splitting at 0 ° tilt will be the same, but at 90 ° tilt a
superposition of different orientations around the membrane normal will lead to a more
complex broad lineshape looking like a powder pattern.
If the peptide is not oriented in the membrane but forms large immobilized aggre-
gates, this is easily seen in the NMR spectrum. In this case, all different orientations of
the peptide are present in the sample and a very broad lineshape is seen, as for a peptide
powder. When this is the case, no orientation of the peptide can be determined. Looking
at the NMR spectral lineshape is a useful method for investigating the aggregation behav-
ior of peptides interacting with membranes, which may be intimately related to the func-
tion or malfunction of the peptide.
18.2.4
19
F NMR Experimental Considerations
To obtain orientational constraints, peptide/lipid samples for
19
F NMR studies are usually
prepared with lipid bilayers that are macroscopically oriented on glass plates [52 – 54] .
Lipids and peptides in appropriate amounts are co - dissolved in organic solvent and spread
onto thin glass plates. After removal of the solvent, the plates are stacked and placed in a
Structure Analysis of Membrane Active Peptides 475
15
(a)
10
5
–5
–10
–15
0 100 200
Position around helix / degrees
Dipolar coupling / kHz
300
0
180
140
160
120
100
40
20
0
Tilt angle / degrees
80
60
(b)
08040 120
Rotation angle / degrees
160
15
(c)
10
5
–5
–10
–15
0 100 200
Position around helix / degrees
Dipolar coupling / kHz
300
0
180
140
160
120
100
40
20
0
Tilt angle / degrees
80
60
(d)
08040 120
Rotation angle / degrees
160
15
(e)
10
5
–5
–10
–15
0 100 200
Position around helix / degrees
Dipolar coupling / kHz
300
0
180
140
160
120
100
40
20
0
Tilt angle / degrees
80
60
(f)
08040 120
Rotation angle / degrees
160
Figure 18.6 Dipolar wave curves calculated for different orientational states of α - helical
peptides (a, c, e), showing the theoretical dipolar splittings for different positions around the
helical axis. (b, d, f) The orientation of the peptide is determined from a plot of the tilt angle
τ versus the azimuthal angle ρ , where each point in the τ / ρ - plot corresponds to a specifi c
orientation. (a) Helical curve corresponding to an S - state orientation with τ = 90 ° , ρ = 90 ° ;
(b) the position of this S - state orientation in the τ / ρ - plot is marked by the center of the
concentric circles. (c) Helical curve for a tilted T - state orientation with τ = 125 ° , ρ = 90 ° ; (d)
the position of this T - state orientation in the τ / ρ - plot. (e) Helical curve for an I - state orientation
with τ = 10 ° , ρ = 90 ° ; (f) the position of this I - state orientation in the τ / ρ - plot.
476 Fluorine in Medicinal Chemistry and Chemical Biology
hydration chamber to take up water and equilibrate. The hydrated plates are then stacked,
wrapped and stored at − 20 ° C until use. The quality of the peptide/lipid sample is checked
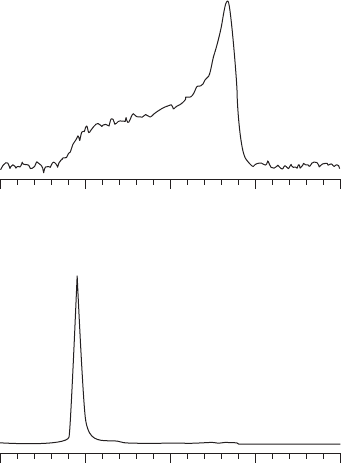
with
31
P NMR, which gives a signal from the phospholipid head groups from which the
degree of orientation can be estimated, as illustrated in Figure 18.7 .
31
P NMR also gives
information about the lipid phase behavior and can be used to confi rm that the sample is
in a membrane - like lamellar phase.
19
F NMR measurements are then conducted with a
1
H - decoupled single - pulse
19
F NMR experiment in an NMR probe in which the orientation
of the glass plates can be varied. Usually samples are measured with the bilayer normal
oriented parallel to the magnetic fi eld, as shown in Figure 18.4 for the peptide MSI - 103
labeled with CF
3
- Phg. A second spectrum can then be acquired with a perpendicular
sample alignment in order to detect the occurrence of long - axis rotation around the mem-
brane normal. Samples can also be prepared as unoriented, multilamellar vesicles (MLV)
by co - dissolving peptides and lipids, and hydrating them after removing the solvent.
If peptides are averaged by long - axial rotation about the bilayer normal, the same
orientational information can be obtained from MLV samples as from oriented samples
[46, 55] .
50
(a)
(b)
25 0
ppm
ppm
–25 –50
50 25 0 –25 –50
Figure 18.7
31
P NMR spectra of MSI - 103 in DMPC. (a) P/L = 1 : 200, nonoriented
multilamellar vesicles sample. The broad signal shows the typical powder spectrum of a liquid
crystalline lamellar lipid phase. (b) P/L = 1 : 20, macroscopically oriented sample. The peak
around 28 ppm shows that the sample is well oriented with the lipid bilayer normal oriented
parallel to the magnetic fi eld.
Structure Analysis of Membrane Active Peptides 477
18.3
19
F Labeling of Peptides
19
F - labeled peptides can be used to study ligand binding, unfolding, mobility, aggregation
and orientation by
19
F NMR in solution or in their native membrane - bound environment,
and they could also be used to study the effect of fl uorination on thermal stability, solubil-
ity, selectivity, and activity of such biological systems. Highly fl uorinated amino acids
have been employed by various research groups to stabilize proteins for different applica-
tions (see reference 56 and references therein). Since this chapter focuses on investigating
membrane - active
19
F - labeled peptides by SSNMR, we will restrict ourselves to specifi cally
19
F - labeled amino acids (see Figure 18.8 ), and their incorporation into peptides at a desired
position. We will then discuss the suitability of various labels for measuring peptide ori-
entation and conformation, mobility, and assembly, and intra - and intermolecular distances
between two fl uorine labels in lipid bilayers.
18.3.1 Labeling Strategies
Incorporation of fl uorine into peptides and proteins is usually achieved through biosyn-
thetic routes, chemical synthesis, or a combination of these two methods. Each method
has its own advantages and shortcomings, but each requires a
19
F - labeled amino acid. The
most commonly used ones are commercially available analogues of aromatic amino acids,
such as tryptophan, phenylalanine, tyrosine, and phenylglycine. Aliphatic
19
F - labeled
amino acids are not commonly available and usually have to be synthesized. The synthesis
of most fl uorinated amino acids is described in detail in the literature [1, 9, 10] . For struc-
ture analysis of peptides and proteins, it is important that (i) the fl uorine label is rigidly
attached to the peptide backbone, (ii) the label does not alter the structure or function of
the peptide, (iii) the extent of fl uorination is restricted to avoid multiple signals, and (iv)
OH
F
O
H
2
N
OH
O
H
2
N
N
F
OH
O
H
2
N
F
OH
O
H
2
N
CF
3
OH
O
H
2
N
CF
3
F
OH
O
H
2
N
D
F
OH
O
H
2
N
CF
3
OH
O
H
2
N
OH
O
H
2
N
F
3
C
OH
O
H
2
N
CF
3
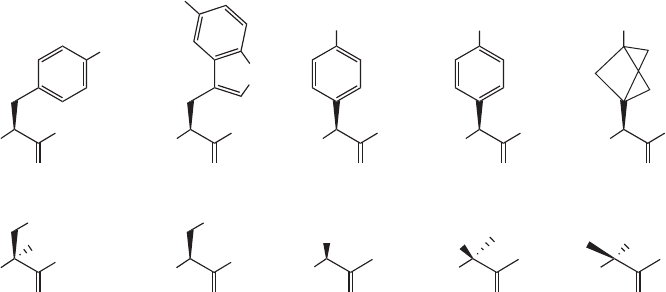
Figure 18.8
19
F - labeled amino acids. Top row: 4F - Phe, 5F - Trp, 4F - Phg, CF
3
- Phg, CF
3
- Bpg.
Bottom row: 2D - 3F - Ala, 3F - Ala, F
3
- Ala, CF
3
- Ala (R - form), CF
3
- Ala (S - form).
478 Fluorine in Medicinal Chemistry and Chemical Biology
the label is stable and not prone to chemical side - reactions such as HF - elimination. Figure
18.8 shows various commonly used
19
F - labeled amino acids.
18.3.1.1 Biosynthetic Labeling
Biosynthetic incorporation of fl uorinated amino acids is a convenient way to obtain
19
F -
labeled peptides or proteins. With the advancement in biotechnological protocols using
various bacterial and yeast machineries, it has been possible to produce proteins of differ-
ent origin quickly and economically. This process requires an auxotrophic strain of bacteria
for the desired
19
F - amino acid, which is added to the growth medium. Alternatively,
glyphosate can be used to inhibit the metabolic synthesis of all aromatic amino acids in
bacterial culture so that the desired
19
F - labeled amino acid along with the other aromatic
ones have to be externally supplemented. Using such approaches, it has been possible to
produce desired sequences with fl uorotryptophan [17, 18] , fl uorotyrosines [57] , fl uorophe-
nylalanine [58, 59] , trifl uoroisoleucine [60] , and trifl uoroleucine [15] .
Biosynthetic incorporation has several limitations: (i) only fl uorinated analogues
of natural amino acids may be used, provided they are nontoxic to the culture; (ii) site -
selective labeling is not possible; (iii) relatively low uptake of
19
F - labeled amino acids
results in lower yield of the expressed peptide or protein; and (iv) some proteins might
still contain the natural amino acid that is devoid of fl uorine. All these limitations can be
avoided by using chemical peptide synthesis, as described below.
18.3.1.2 Solid - Phase Peptide Synthesis
Using SPPS protocols,
19
F - labeled amino acids can be readily incorporated into membrane -
active peptides at any desired site. Standard Fmoc SPPS protocols are detailed in the lit-
erature [61] . Chemical synthesis has an intrinsic limitation in peptide chain length,
depending on the sequence; this limits the synthesis of the fl uorine - containing peptides to
a maximum of 60 amino acids. Most membrane - active peptides have typically 10 – 40
amino acids and are well suited for chemical synthesis. Using synthetic
19
F - labeled pep-
tides, we have investigated many different systems in model membranes by
19
F NMR;
these are listed in Table 18.2 , in Section 18.4 . In practice, special care has to be taken at
different stages of the synthetic protocol to avoid problems of fl uorine contamination,
elimination, or racemization, all of which are discussed in the following paragraphs.
Fluorine contamination . Trifl uoroacetic acid (TFA), which is used to cleave the full -
length peptide from the solid support and remove the side - chain protections in the fi nal
step of peptide synthesis, is often found to be tightly bound to the peptide. Usually up to
a 5 - fold molar excess of TFA is found to be associated with the peptide, and cannot be
removed by repeated lyophilization [62] . Using an ion - exchange column, it is easy to
replace the trifl ate ion with another suitable counteranion, but such purifi cation steps are
accompanied by extensive peptide loss. TFA is also universally used as an ion - pairing
agent in HPLC purifi cation of peptides. For hydrophobic peptides, many researchers use
fl uorinated alcohols, such as trifl uoroethanol and hexafl uoroisopropanol, to dissolve the
crude peptide or even as a constituent of the mobile phase during HPLC purifi cation. These
fl uorinated solvents often contaminate the “ purifi ed ” peptide with substantial amounts of
undesired fl uorine, which interferes in the
19
F NMR spectra. For example, TFA is seen as
an intense signal around − 75 ppm, and this signal overlaps with signals of aromatic fl uorine

Structure Analysis of Membrane Active Peptides 479
and CF
3
- groups. It is thus essential to exclude any traces of fl uorinated solvents and ion -
pairing agents from the NMR sample. We have shown that TFA from the cleavage step of
peptide synthesis can be effi ciently removed by employing HCl as an ion - pairing agent in
HLPC purifi cation protocols [62] ; therefore, in a single step, it is possible to obtain
19
F -
labeled peptide that is free of any undesired fl uorine background.
Fluorine elimination. The high electronegativity of fl uorine makes it prone to certain
side reactions that result in HF - elimination. These side reactions are very uncommon for
a fl uorine atom attached to an aromatic ring; however, the presence of labile hydrogen in
the vicinity of an aliphatic fl uorine substituent often leads to spontaneous HF - elimination,
which results either in an olefi nic bond or a cyclized structure. Furthermore, elimination
reactions are accelerated in the presence of base which is typically used in amino acid
coupling procedures. 3 - Fluoroalanine (3F - Ala), or 3,3,3 - trifl uoroalanine (F
3
- Ala) in par-
ticular eliminate HF almost invariably when incorporated via the usual coupling protocols
employing basic conditions. It has been possible to minimize the loss of fl uorine by using
2 - deutero - 3 - fl uoroalanine (2D - 3F - Ala) and by coupling at low temperatures using base -
free coupling strategies [63] .
Racemization. The high electronegativity of fl uorine also makes many
19
F - labeled
amino acids susceptible to base - induced racemization. In the case of aromatic side - chains,
this effect is even more pronounced, due to the electron - withdrawing effect of the ring.
Under base - catalyzed coupling procedures, fl uorophenylglycine undergoes complete race-
mization, leading to epimeric peptides (see Figure 18.9 ). It has nevertheless been possible
to couple this enantiomerically pure amino acid using base - free protocols employing
diisopropylcarbodiimide/hydroxybenzotriazol to avoid racemization [110] . Most
19
F -
labeled amino acids are in any case commercially available only as racemic mixtures;
hence the use of standard synthetic protocols involving basic conditions is acceptable and
pragmatic. In this case, the resulting epimeric peptides have to be separated on an HPLC
column and isolated in high purity. In our investigations, we often study both epimeric
Table 18.2 Peptide sequences labeled with
19
F - labeled amino acids
Peptide
Sequence
a
Label Reference
Antimicrobial peptides
Gramicidin S Cyclo - (PVOLf)
2
4F - Phg 62, 66,
80
CF
3
- Phg 79
PGLa GMASKAGAIAGKIAKVALKAL - NH
2
4F - Phg 44, 62
CF
3
- Phg 44, 49,
84, 85
CF
3
- Bpg 68
MSI - 103 (KIAGKIA)
3
- NH
2
3F - Ala 71
CF
3
- Phg 45, 89
Cell - penetrating peptide
MAP [110] KLALKLALKALKAALKLA - NH
2
CF
3
- Phg Submitted
Fusogenic peptides
B18 LGLLLRHLRHHSNLLANI 4F - Phg 50, 62
FP23 AVGIGALFLGFLGAAGSTMGARS - NH
2
CF
3
- Phg Submitted
a
One - letter code. O = ornithine; f = D - isomer of Phe.
480 Fluorine in Medicinal Chemistry and Chemical Biology
peptides separately after identifying the chirality of the
19
F - labeled amino acid, in order
to obtain additional structural information [44] . To identify which epimer contains the d -
and l - forms of the
19
F - labeled amino acid, an aliquot of these separated peptides should
be hydrolyzed to their constituent amino acids and derivatized using Marfey ’ s reagent to
identify the d - and l - forms [62] . Alternatively, the racemic mixture may be acetylated to
obtain the N - acetyl amino acids, which can be subsequently enzymatically deacetylated.
Porcine kidney acylase 1 selectively deacetylates the l - amino acid, leaving the d - enantio-
mer unchanged [64, 65] .
Several different
19
F - labels with a rigid connection to the peptide backbone, which
qualify for
19
F NMR according to the criteria described above, were used in our investiga-
tions and will now be described in more detail. These amino acids were incorporated into
various membrane - active peptides as NMR labels, thereby providing structural informa-
tion that will be described in Section 18.4 .
18.3.2
19
F - labeled Amino Acids
Various
19
F - labeled amino acids have been used for SSNMR structural studies of
membrane - active peptides. Their chemical structures are shown in Figure 18.8 , including
the aromatic 4 - fl uorophenylalanine, 5 - fl uorotryptophan, 4 - fl uorophenylglycine, and 4 -
trifl uoromethylphenylglycine. Apart from the cyclic side chain of 3 - trifl uoromethylbicy-
250
(a)
(b)
200
150
100
10 11 12 13
Time (min)
Intensity (220 nm)
14 15
50
0
500
400
300
200
10 11 12 13
Time (min)
Intensity (220 nm)
14 15
100
0
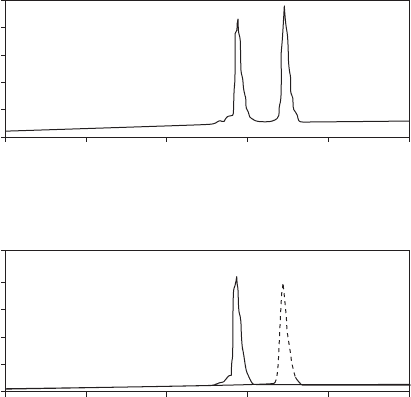
Figure 18.9 (a) HPLC chromatogram showing the presence of two epimeric peptides,
resulting from incorporation of a racemic mixture of CF
3
- Phg, and (b) analytical HPLC
chromatograms (solid and dashed lines) after preparative separation of the epimers.
