Nigel S., Chambers S., Johnson R. Operations Management
Подождите немного. Документ загружается.


Project monitoring
Project managers have first to decide what they should be looking for as the project pro-
gresses. Usually a variety of measures are monitored. To some extent, the measures used will
depend on the nature of the project. However, common measures include current expendi-
ture to date, supplier price changes, amount of overtime authorized, technical changes to
project, inspection failures, number and length of delays, activities not started on time,
missed milestones, etc. Some of these monitored measures affect mainly cost, some mainly
time. However, when something affects the quality of the project, there are also time and cost
implications. This is because quality problems in project planning and control usually have
to be solved in a limited amount of time.
Assessing project performance
The monitored measures of project performance at any point in time need to be assessed so
that project management can make a judgement concerning overall performance. A typical
planned cost profile of a project through its life is shown in Figure 16.12. At the beginning of
a project some activities can be started, but most activities will be dependent on finishing.
Eventually, only a few activities will remain to be completed. This pattern of a slow start
followed by a faster pace with an eventual tail-off of activity holds true for almost all pro-
jects, which is why the rate of total expenditure follows an S-shaped pattern as shown in
Figure 16.13, even when the cost curves for the individual activities are linear. It is against
this curve that actual costs can be compared in order to check whether the project’s costs are
being incurred to plan. Figure 16.14 shows the planned and actual cost figures compared in
this way. It shows that the project is incurring costs, on a cumulative basis, ahead of what
was planned.
Intervening to change the project
If the project is obviously out of control in the sense that its costs, quality levels or times are
significantly different from those planned, then some kind of intervention is almost certainly
likely to be required. The exact nature of the intervention will depend on the technical
characteristics of the project, but it is likely to need the advice of all the people who would be
affected. Given the interconnected nature of projects – a change to one part of the project will
have knock-on effects elsewhere – this means that interventions often require wide consulta-
tion. Sometimes intervention is needed even if the project looks to be proceeding according
Part Three Planning and control
474
Figure 16.12 Comparing planned and actual expenditure
M16_SLAC0460_06_SE_C16.QXD 10/20/09 15:22 Page 474
Chapter 16 Project planning and control
475
to plan. For example, the schedule and cost for a project may seem to be ‘to plan’, but when
the project managers project activities and cost into the future, they see that problems are
very likely to arise. In this case it is the trend of performance which is being used to trigger
intervention.
Network planning
The process of project planning and
control is greatly aided by the use of
techniques which help project man-
agers to handle its complexity and
time-based nature. The simplest of
these techniques is the Gantt chart
(or bar chart) which we introduced
in Chapter 10. Gantt charts are the
simplest way to exhibit an overall pro-
ject plan, because they have excellent
visual impact and are easy to under-
stand. They are also useful for com-
municating project plans and status
to senior managers as well as for day-
to-day project control. Later tech-
niques, most of which go under the
collective name of network analysis
are now used, almost universally, to
help plan and control all significant projects, but can also prove helpful in smaller ventures.
The two network analysis methods we will examine are the critical path method (CPM) or
analysis (CPA) and programme evaluation and review technique (PERT).
Critical path method (CPM)
As project complexity increases, so it becomes necessary to identify the relationships between
activities. It becomes increasingly important to show the logical sequence in which activ-
ities must take place. The critical path method (CPM) models the project by clarifying the
relationships between activities diagrammatically. The first way we can illustrate this is by
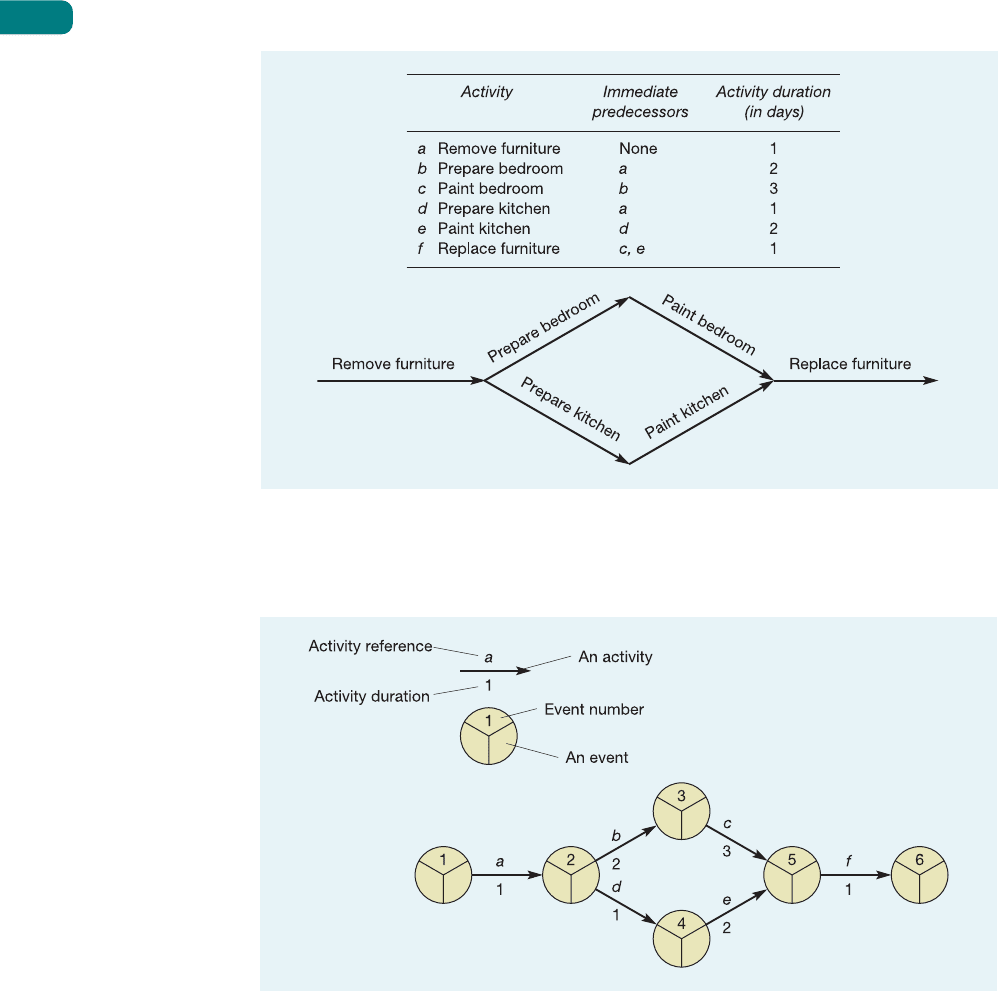
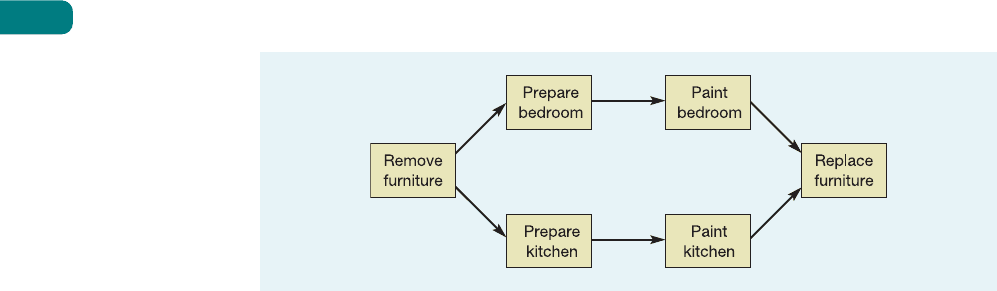
using arrows to represent each activity in a project. For example, examine the simple project
in Figure 16.13 which involves the decoration of an apartment. Six activities are identified
together with their relationships. The first, activity a, ‘remove furniture’, does not require
any of the other activities to be completed before it can be started. However, activity b,
‘prepare bedroom’, cannot be started until activity a has been completed. The same applies
to activity d, ‘prepare the kitchen’. Similarly activity c, ‘paint bedroom’, cannot be started
until activity b has been completed. Nor can activity e, ‘paint the kitchen’, be started until the
kitchen has been prepared. Only when both the bedroom and the kitchen have been painted
can the apartment be furnished again. The logic of these relationships is shown as an arrow
diagram, where each activity is represented by an arrow (the length of the arrows is not pro-
portional to the duration of the activities).
This arrow diagram can be developed into a network diagram as shown in Figure 16.14.
At the tail (start) and head (finish) of each activity (represented by an arrow) is a circle
which represents an event. Events are moments in time which occur at the start or finish of
an activity. They have no duration and are of a definite recognizable nature. Networks of this
type are composed only of activities and events.
Source: Image courtesy of Silicon Graphics, Inc. © 2003 Silicon
Graphics, Inc. Used by permission. All rights reserved. Reality Center
#6: Image courtesy of Trimension Systems and Cadcentre.
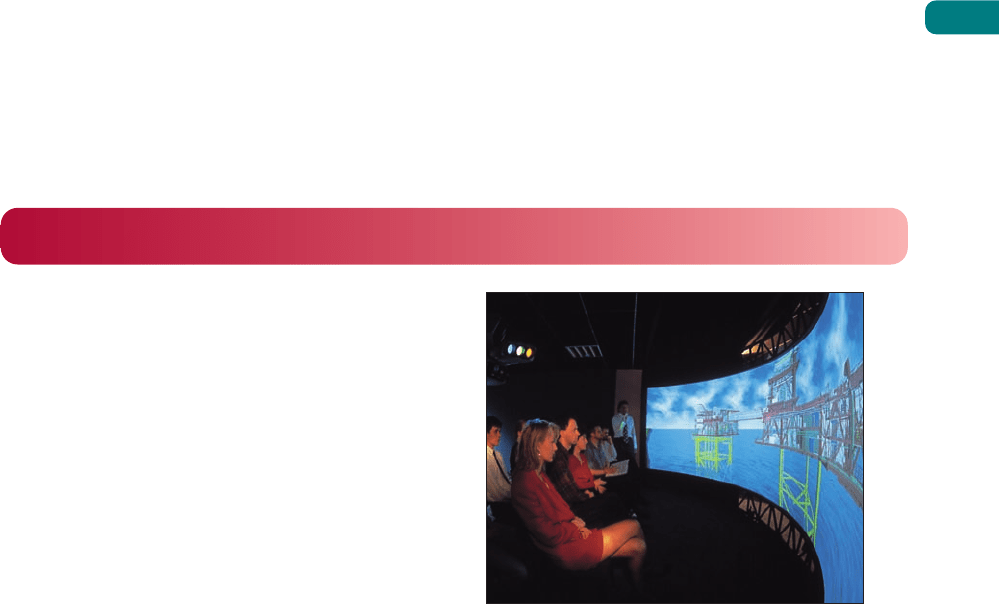
CADCENTRE’s visuality group Reality Center
visualization system enables project teams to check
out and validate proposals using interactive computer
models
Network analysis
Critical path method
Programme evaluation
and review technique
Activity
Event
M16_SLAC0460_06_SE_C16.QXD 10/20/09 15:22 Page 475
The rules for drawing this type of network diagram are fairly straightforward:
Rule 1 An event cannot be reached until all activities leading to it are complete. Event 5 in
Figure 16.14 is not reached until activities c and e are complete.
Rule 2 No activity can start until its tail event is reached. In Figure 16.14 activity f cannot
start until event 5 is reached.
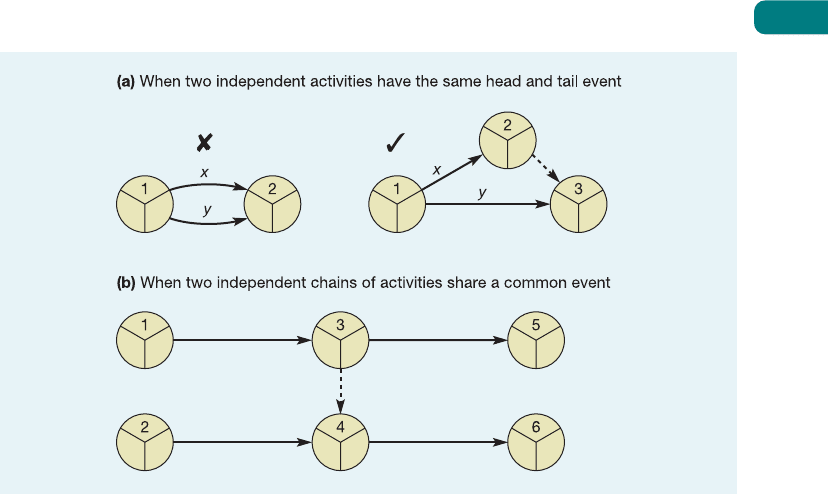
Rule 3 No two activities can have the same head and tail events. In Figure 16.15 activities x
and y cannot be drawn as first shown; they must be drawn using a dummy activity.
These have no duration and are usually shown as a dotted-line arrow. They are used
either for clarity of drawing or to keep the logic of the diagram consistent with that
of the project.
Dummy activity
Part Three Planning and control
476
Figure 16.13 The activities, relationships, durations and arrow diagram for the project
‘decorate apartment’
Figure 16.14 A network diagram for the project ‘decorate apartment’
M16_SLAC0460_06_SE_C16.QXD 10/20/09 15:22 Page 476
The critical path
In all network diagrams where the activities have some parallel relationships, there will be
more than one sequence of activities which will lead from the start to the end of the project.
These sequences of activities are called paths through the network. Each path will have a total
duration which is the sum of all its activities. The path which has the longest sequence of
activities is called the critical path of the network (note that it is possible to have more than
one critical path if they share the same joint longest time). It is called the critical path because
any delay in any of the activities on this path will delay the whole project. In Figure 16.14,
therefore, the critical path through the network is a, b, c, f, which is seven days long. This is
the minimum duration of the whole project. By drawing the network diagram we can:
● identify which are the particularly important activities;
● calculate the duration of the whole project.
Calculating float
Earlier in the chapter we described the flexibility to change the timings of activities, which is
inherent in various parts of a project, as float. We can use the network diagram to calculate
this for each activity. The procedure is relatively simple:
1 Calculate the earliest and latest event times for each event. The earliest event time (EET)
is the very earliest the event could possibly occur if all preceding activities are completed
as early as possible. The latest event time (LET) is the latest time that the event could
possibly take place without delaying the whole project.
2 Calculate the ‘time window’ within which an activity must take place. This is the time
between the EET of its tail event and the LET of its head event.
3 Compare the actual duration of the activity with the time window within which it must
take place. The difference between them is the float of the activity.
Consider again the simple network example. The critical path is the sequence of activities a,
b, c, f. We can calculate the EET and LET for each event as shown in Figure 16.16. If activity
a starts at time 0, the earliest it can finish is 1 because it is a one-day activity. If activity b is
started immediately, it will finish at day 3 (EET of tail event + duration, 1 + 2). Activity c can
then start at day 3 and because it is of three days’ duration it will finish at day 6. Activity e
Chapter 16 Project planning and control
477
Figure 16.15 When dummy activities are necessary
Critical path
Float
Earliest event time
Latest event time
M16_SLAC0460_06_SE_C16.QXD 10/20/09 15:22 Page 477
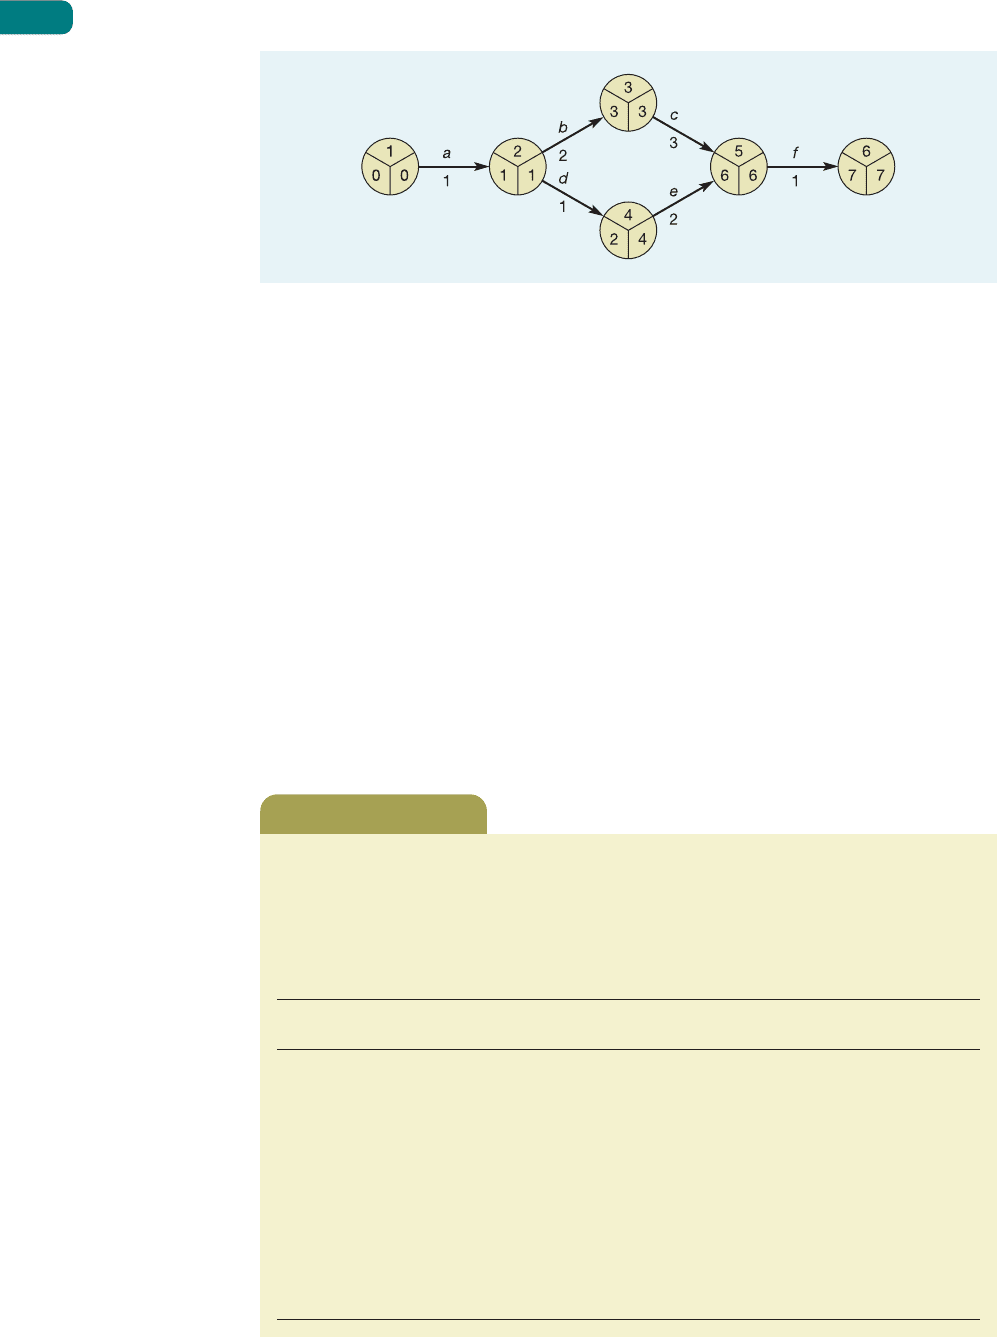
also has event number 5 as its head event so we must also calculate the EET of activity e’s tail
event. This is determined by activity d. If activity d starts at day 1 (the earliest it can) it will
finish at day 2. So the EET of event number 4 is day 2. If activity e is started immediately,
it will then finish at day 4. Event number 5 cannot occur, however, until both e and c have
finished, which will not be until day 6 (see rule 1 above). Activity f can then start and will
finish at day 7.
The LETs can be calculated by using the reverse logic. If event number 6 must occur no
later than day 7, the LET for event number 5 is day 6. Any later than this and the whole pro-
ject will be delayed. Working back, if activity c must finish by day 6 it cannot start later than
day 3, and if activity b must finish by day 3 it must start by day 1. Similarly, if activity e is to
finish by day 6 it must start no later than day 4, and if activity d is to finish by day 4 it must
start no later than day 3. Now we have two activities with event number 2 as their tail event,
one of which needs to start by day 1 at the latest, the other by day 3 at the latest. The LET for
event number 2, therefore, must be the smaller of the two. If it were delayed past this point,
activity b, and therefore the whole project, would be delayed.
Part Three Planning and control
478
Figure 16.16 A network diagram for the project ‘decorate apartment’ with earliest and latest
event times
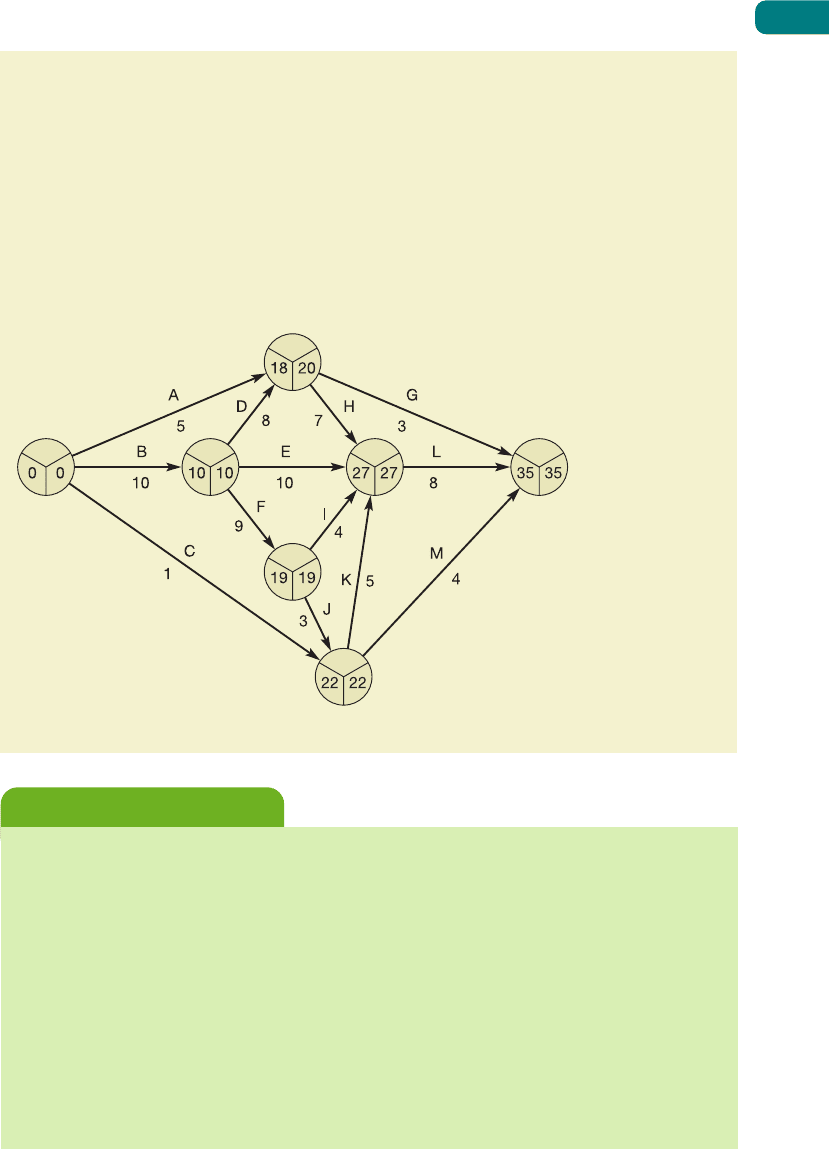
The chief surveyor of a firm that moves earth in preparation for the construction of
roads has identified the activities and their durations for each stage of an operation to
prepare a difficult stretch of motorway (see Table 16.3). The surveyor needs to know how
long the project will take and which are the critical activities.
Worked example
Table 16.3 Road construction activities
Activity Duration Preceding
(days) activities
A5–
B10–
C1–
D8B
E10B
F9B
G 3 A, D
H 7 A, D
I4F
J3F
K 5 C, J
L 8 H, E, I, K
M 4 C, J
M16_SLAC0460_06_SE_C16.QXD 10/20/09 15:22 Page 478
Activity on node networks
The network we have described so far uses arrows to represent activities and circles at the
junctions or nodes of the arrows to represent events. This method is called the activity on
arrow (AoA) method. An alternative method of drawing networks is the activity on node
(AoN) method. In the AoN representation, activities are drawn as boxes, and arrows are used
to define the relationships between them. There are three advantages to the AoN method:
Activity on arrow
Activity on node
Chapter 16 Project planning and control
479
Figure 16.17 shows the network diagram for the project. Drawing these diagrams
from the type of information in Table 16.3 is a matter of sketching the logic of the rela-
tionships between the activities on a piece of paper until it conforms to the relationships
as stated, and then drawing the diagram again in a neater fashion. So, for example, A, B
and C have no predecessors and therefore are the activities that can be commenced at
the beginning of the project. Activities D, E and F all can start after the completion of
activity B, and so on. The diagram also shows the latest and earliest event times for the
activities. It shows that the critical path for the project is the sequence of activities B, F,
J, K, L. The total length of the project is 35 days, this being the length of the critical path
sequence of activities.
Figure 16.17 Network diagram for the motorway project
The idea that all project activities can be identified as entities with a clear beginning and
a clear end point and that these entities can be described in terms of their relationship with
each other is an obvious simplification. Some activities are more or less continuous and
evolve over time. For example, take a simple project such as digging a trench and laying a
communications cable in it. The activity ‘dig trench’ does not have to be completed before
the activity ‘lay cable’ is started. Only two or three metres of the trench needs to be dug
before cable laying can commence. A simple relationship, but one that is difficult to illus-
trate on a network diagram. Also, if the trench is being dug in difficult terrain, the time taken
to complete the activity, or even the activity itself may change, to include rock drilling
activities for example. However, if the trench cannot be dug because of rock formations,
it may be possible to dig more of the trench elsewhere, a contingency not allowed for in
the original plan. So, even for this simple project, the original network diagram may reflect
neither what will happen nor what could happen.
Critical commentary
M16_SLAC0460_06_SE_C16.QXD 10/20/09 15:22 Page 479
● It is often easier to move from the basic logic of a project’s relationships to a network
diagram using AoN rather than using the AoA method.
● AoN diagrams do not need dummy activities to maintain the logic of relationships.
● Most of the computer packages which are used in project planning and control use an
AoN format.
An AoN network of the ‘apartment decorating’ project is shown in Figure 16.18.
Example
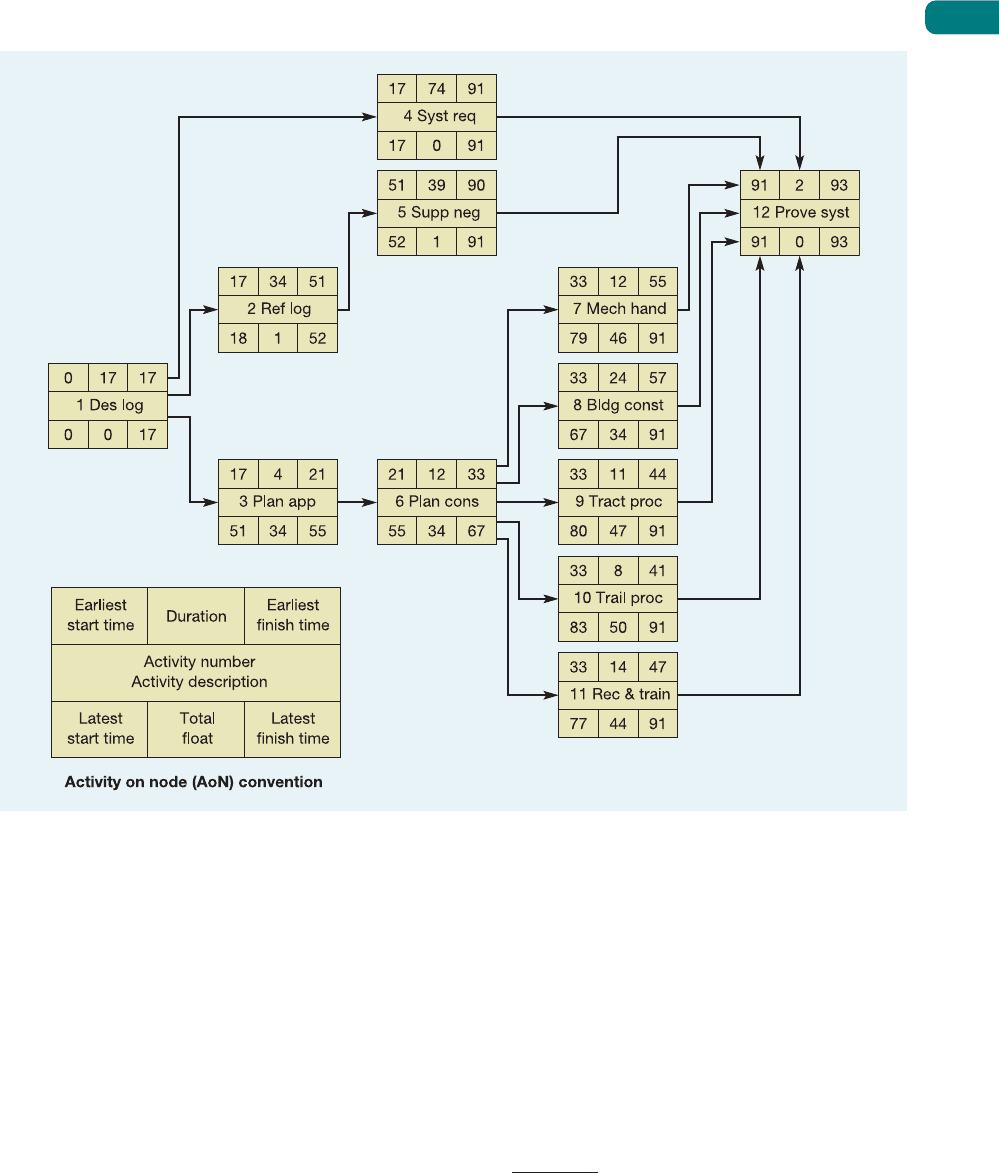
The implementation of a new logistics operation involves the purchase of a fleet of trucks,
the design of new routes and the building of a new distribution centre and associated
handling equipment. Figure 16.19 provides an AoN network for the project. The earliest start
times for each activity are found by working from left to right across the network. Each start
event can begin at t = 0. At a ‘merge’ event (where two or more activities come together, as
at event 12), use the latest completion date of the various activities which lead into it. Earliest
finish times of a ‘burst’ activity (such as activity 6, where five succeeding activities literally
‘burst’ out) are carried forward to form the earliest start dates of the succeeding activities
(7 through 11). The latest start times for each activity are found by working back from right
to left across the network. The earliest start time for the final event on the network is often
used as the latest start time for that event as well. At a ‘merge’ event (such as event 6), use the
earliest completion date of the various activities.
First, we carry out a forward pass of the network (i.e. proceed from left to right). Activity 1
is given a start date of week 0. The earliest finish is then week 17, because the duration is
17 weeks. The earliest start date for activity 2 must then also be week 17. Activity 5 starts
at 17 + 34, the duration for activity 2. Activity 4 is in parallel with activity 2, and can start at
the same time. The rest of the forward pass is straight-forward until we reach activity 12.
Here, seven activities merge, so we must use the highest earliest finish of the activities which
lead into it as the earliest start time for activity 12. This is 91 (the earliest finish time for
activity 4). Since the duration of activity 12 is two weeks, the earliest finish time for the whole
network is 93 weeks.
Now we can carry out a backward pass by assuming that the latest finish time is also
93 weeks (the bottom right-hand box on activity 12). This means that there is no ‘float’,
i.e. the difference between the earliest and latest start dates for this activity is zero. Hence, the
latest start time is also week 91. This gets down-dated into activities 7 through 11, which have
week 91 as the latest finish time. The difference between week 91 and the various earliest
finish times for these activities means that there is float on each one. That is, that they can
start much later than indicated by the earliest start dates. On the backward pass, activity 6
forms a merge event for activities 7 through 11. Take the lowest latest start time from these
activities, i.e. week 67, as the latest finish time for activity 6. If all goes well, and the analysis
is correct, there should also be zero float for activity 1. The critical path for the network is
then the line which joins the activities with minimum float, i.e. activities 1, 4 and 12.
Part Three Planning and control
480
Figure 16.18 Activity on node network diagram for project ‘decorate apartment’
M16_SLAC0460_06_SE_C16.QXD 10/20/09 15:22 Page 480
Programme evaluation and review technique (PERT)
The programme evaluation and review technique, or PERT as it is universally known, had
its origins in planning and controlling major defence projects in the US Navy. PERT had its
most spectacular gains in the highly uncertain environment of space and defence projects.
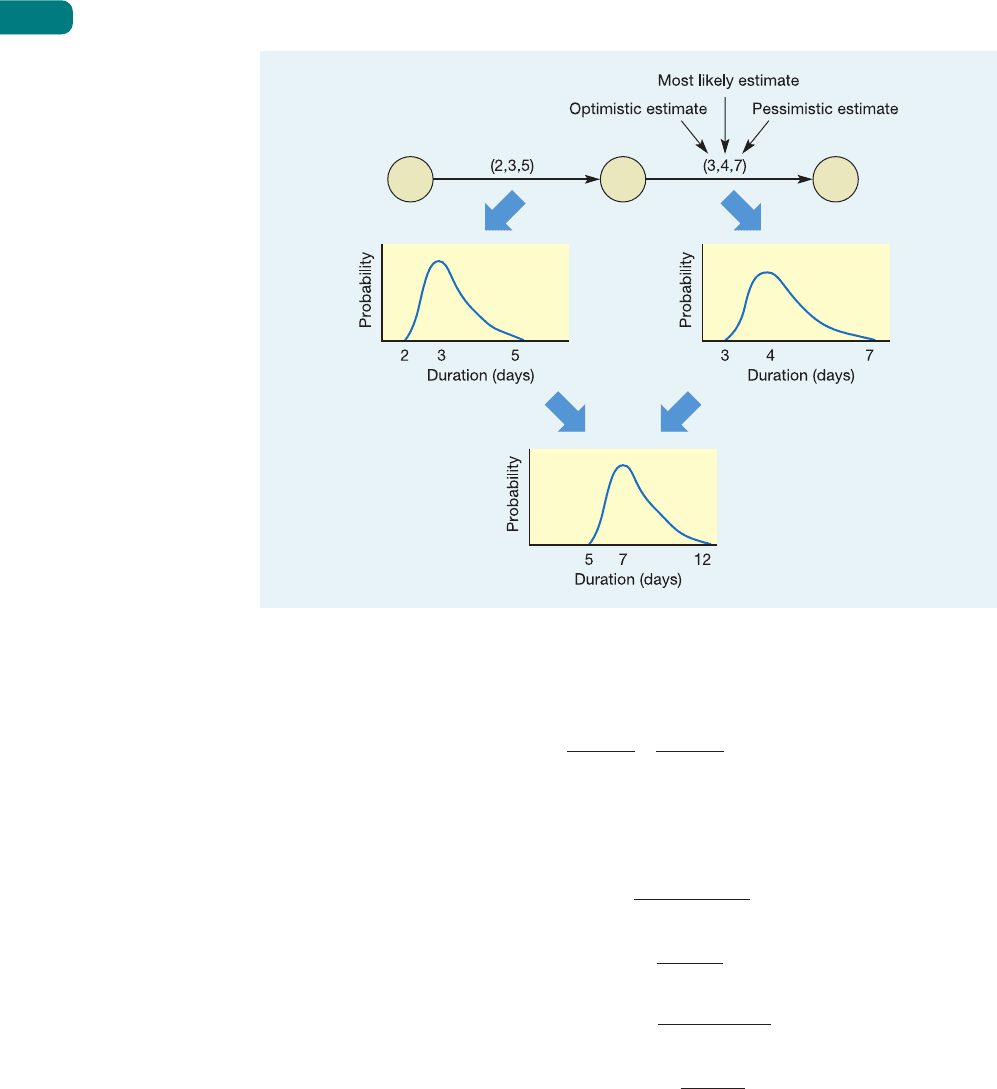
The technique recognizes that activity durations and costs in project management are not
deterministic (fixed), and that probability theory can be applied to estimates, as was men-
tioned earlier. In this type of network each activity duration is estimated on an optimistic, a
most likely and a pessimistic basis, as shown in Figure 16.20. If it is assumed that these time
estimates are consistent with a beta probability distribution, the mean and variance of the
distribution can be estimated as follows:
t
e
=
where
t
e
= the expected time for the activity
t
o
= the optimistic time for the activity
t
l
= the most likely time for the activity
t
p
= the pessimistic time for the activity.
t
o
+ 4t
l
+ t
p
6
Chapter 16 Project planning and control
481
Figure 16.19 New logistics operation: precedence network
M16_SLAC0460_06_SE_C16.QXD 10/20/09 15:22 Page 481
The variance of the distribution (V) can be calculated as follows:
V ==
The time distribution of any path through a network will have a mean which is the sum of
the means of the activities that make up the path, and a variance which is a sum of their vari-
ances. In Figure 16.21:
The mean of the first activity ==3.17
The variance of the first activity ==0.25
The mean of the second activity ==4.33
The variance of the second activity ==0.44
The mean of the network distribution = 3.17 + 4.33 = 7.5
The variance of the network distribution = 0.25 + 0.44 = 0.69
It is generally assumed that the whole path will be normally distributed.
The advantage of this extra information is that we can examine the ‘riskiness’ of each path
through a network as well as its duration. For example, Figure 16.21 shows a simple two-path
network. The top path is the critical one; the distribution of its duration is 10.5 with a vari-
ance of 0.06 (therefore a standard deviation of 0.245). The distribution of the non-critical
path has a mean of 9.67 and a variance of 0.66 (therefore a standard deviation of 0.812). The
(7 − 3)
2
36
3 + (4 × 4) +7
6
(5 − 2)
2
36
2 + (4 × 3) +5
6
(t
p
− t
o
)
2
36
(t
p
− t
o
)
2
6
2
Part Three Planning and control
482
Figure 16.20 Probabilistic time estimates can be summed to give a probabilistic estimate for
the whole project
M16_SLAC0460_06_SE_C16.QXD 10/20/09 15:22 Page 482
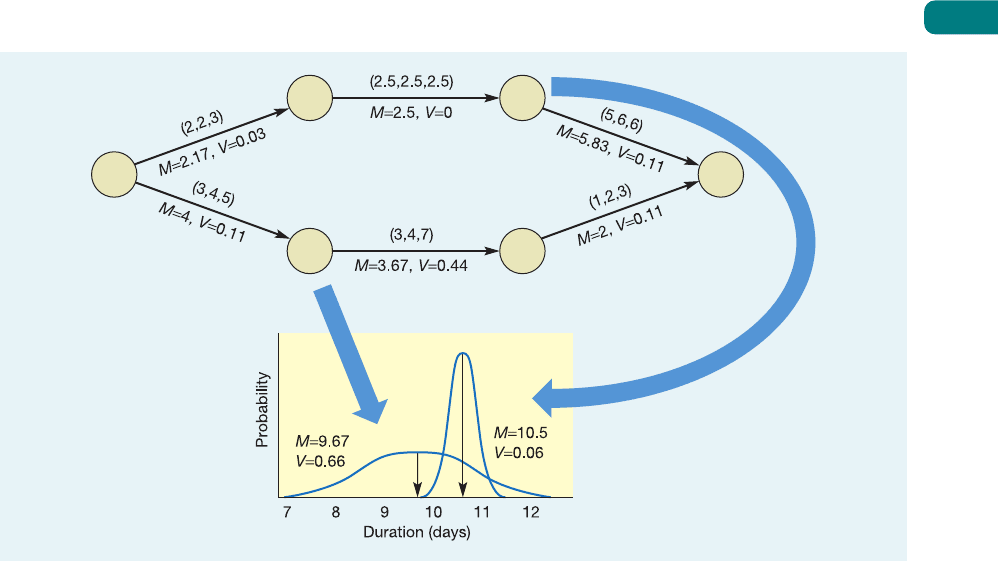
implication of this is that there is a chance that the non-critical path could in reality be crit-
ical. Although we will not discuss the probability calculations here, it is possible to determine
the probability of any sub-critical path turning out to be critical when the project actually
takes place. However, on a practical level, even if the probability calculations are judged not
to be worth the effort involved, it is useful to be able to make an approximate assessment of
the riskiness of each part of a network.
Introducing resource constraints
The logic which governs network relationships is primarily derived from the technical details
of the project as we have described. However, the availability of resources may impose its
own constraints, which can materially affect the relationships between activities. Figure 16.22
shows a simple two-path network with details of both the duration of each activity and the
number of staff required to perform each activity. The total resource schedule is also shown.
The three activities on the critical path, a, c and e, have been programmed into the resource
schedule first. The remaining activities all have some float and therefore have flexibility as to
when they are performed.
The resource schedule in Figure 16.22 has the non-critical activities starting as soon as
is possible. This results in a resource profile which varies from seven staff down to three.
Even if seven staff are available, the project manager might want to even out the loading for
organizational convenience. If the total number of staff available is less than seven, however,
the project will need rescheduling. Suppose only five staff are available. It is still possible to
complete the project in the same time, as shown in Figure 16.23. Activity b has been delayed
until after activity a has finished. This results in a resource profile which varies only between
four and five staff and is within the resourcing limit of five staff.
However, in order to achieve this it is necessary to require activity b to start only when
activity a is completed. This is a logic constraint which, if it were included in the network,
would change it as shown in Figure 16.23. In this network all activities are critical, as indeed
one can see from the resource schedule.
Chapter 16 Project planning and control
483
Figure 16.21 One path in the network can have the longest expected duration while another path has the
greater variance
M16_SLAC0460_06_SE_C16.QXD 10/20/09 15:22 Page 483