Nigel S., Chambers S., Johnson R. Operations Management
Подождите немного. Документ загружается.

processes include petrochemical refineries,
electricity utilities, steel making and some
paper making. There are often few elements of
discretion in this type of process and although
products may be stored during the process,
the predominant characteristic of most con-
tinuous processes is of smooth flow from one
part of the process to another. Inspections are
likely to form part of the process, although
the control applied as a consequence of those
inspections is often automatic rather than
requiring human discretion.
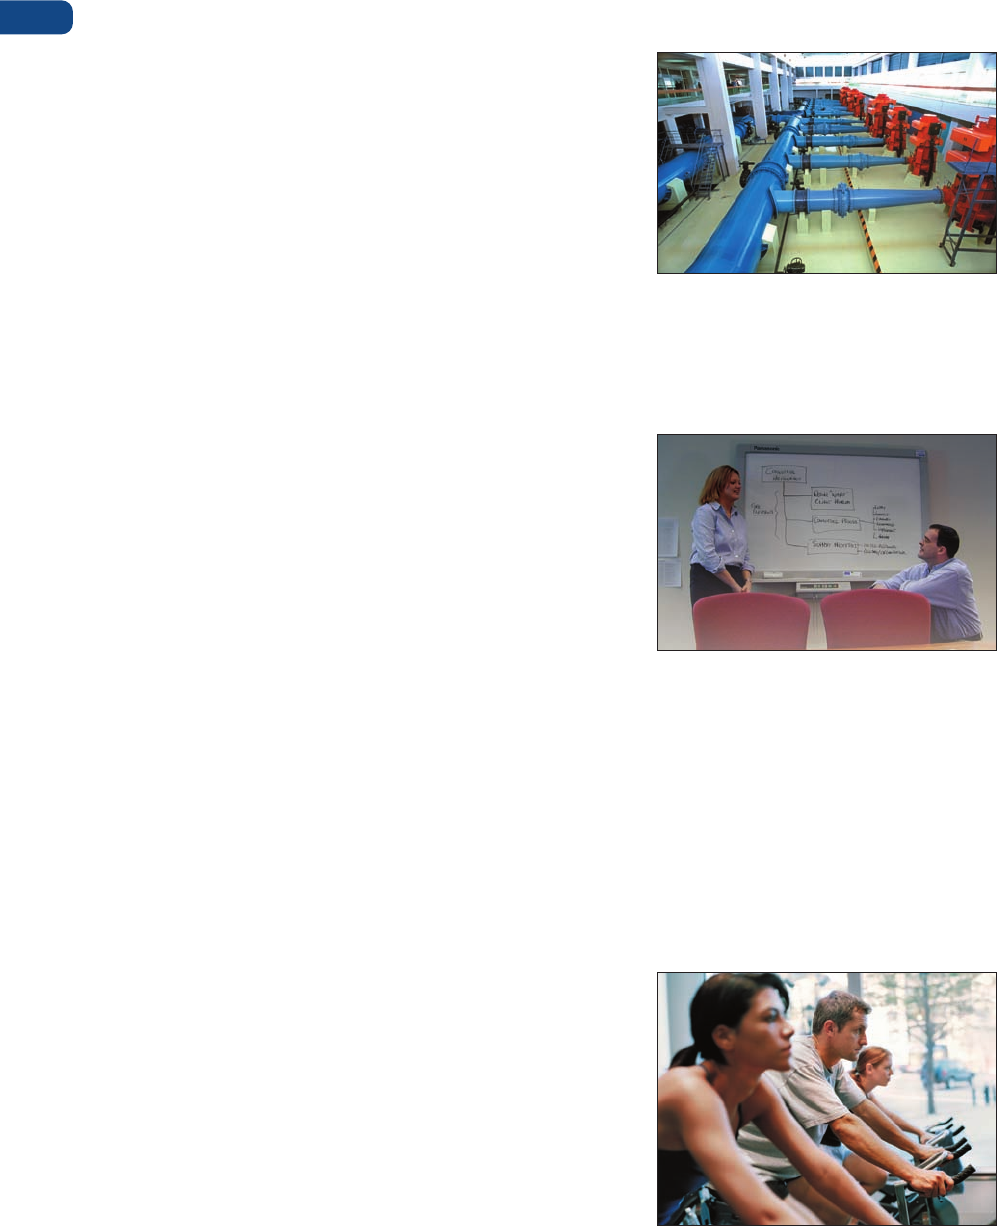
Professional services
Professional services are defined as high-
contact organizations where customers spend
a considerable time in the service process. Such
services provide high levels of customization,
the service process being highly adaptable in
order to meet individual customer needs. A
great deal of staff time is spent in the front
office and contact staff are given considerable
discretion in servicing customers. Professional
services tend to be people-based rather than
equipment-based, with emphasis placed on
the process (how the service is delivered)
rather than the ‘product’ (what is delivered).
Professional services include management
consultants, lawyers’ practices, architects,
doctors’ surgeries, auditors, health and safety
inspectors and some computer field service
operations. A typical example would be OEE,
a consultancy that sells the problem-solving
expertise of its skilled staff to tackle clients’
problems. Typically, the problem will first be
discussed with clients and the boundaries of the project defined. Each ‘product’ is different,
and a high proportion of work takes place at the client’s premises, with frequent contact
between consultants and the client.
Service shops
Service shops are characterized by levels of
customer contact, customization, volumes of
customers and staff discretion, which position
them between the extremes of professional and
mass services (see next paragraph). Service is
provided via mixes of front- and back-office
activities. Service shops include banks, high-
street shops, holiday tour operators, car rental
companies, schools, most restaurants, hotels
and travel agents. For example, an equipment
hire and sales organization may have a range of
products displayed in front-office outlets, while
back-office operations look after purchasing
and administration. The front-office staff have
Part Two Design
94
Here consultants are preparing to start a
consultancy assignment. They are discussing
how they might approach the various stages
of the assignment, from understanding the
real nature of the problem through to the
implementation of their recommended
solutions. This is a process map, although
a very high level one. It guides the nature
and sequence of the consultants’ activities.
The health club shown in the picture has
front-office staff who can give advice on
exercise programmes and other treatments.
To maintain a dependable service the staff
need to follow defined processes every day.
This continuous water treatment process
almost never stops (it only stops for
maintenance) and performs a narrow range
of tasks (filters impurities). Often we only
notice the process if it goes wrong!
Professional services
Service shops
Source: Alamy ImagesSource: Getty Images
M04_SLAC0460_06_SE_C04.QXD 10/20/09 9:25 Page 94

some technical training and can advise customers during the process of selling the product.
Essentially the customer is buying a fairly standardized product but will be influenced by the
process of the sale which is customized to the customer’s individual needs.
Mass services
Mass services have many customer transac-
tions, involving limited contact time and little
customization. Such services may be equipment-
based and ‘product’-oriented, with most value
added in the back office and relatively little judge-
ment applied by front-office staff. Staff are likely
to have a closely defined division of labour and
to follow set procedures. Mass services include
supermarkets, a national rail network, an airport,
telecommunications services, libraries, televi-
sion stations, the police service and the enquiry
desk at a utility. For example, rail services such
as Virgin Trains in the UK or SNCF in France
all move a large number of passengers with a variety of rolling stock on an immense
infrastructure of railways. Passengers pick a journey from the range offered. One of the most
common types of mass service is the call centres used by almost all companies that deal
directly with consumers. Coping with a very high volume of enquiries requires some kind of
structuring of the process of communicating with customers. This is often achieved by using
a carefully designed enquiry process (sometimes known as a ‘script’).
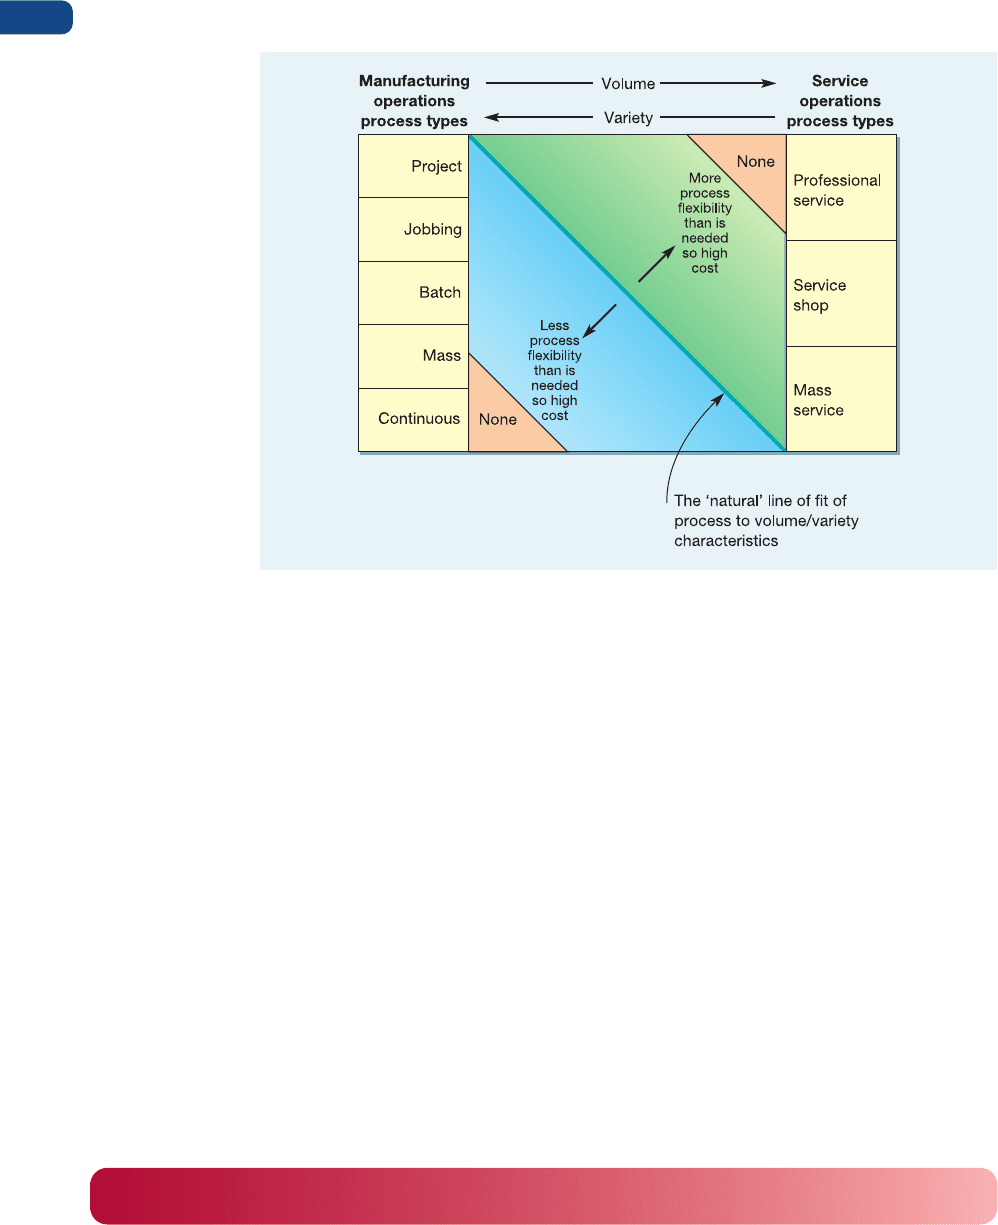
The product–process matrix
Making comparisons between different processes along a spectrum which goes, for example,
from shipbuilding at one extreme to electricity generation at the other has limited value.
No one grumbles that yachts are so much more expensive than electricity. The real point is
that because the different process types overlap, organizations often have a choice of what
type of process to employ. This choice will have consequences to the operation, especially
in terms of its cost and flexibility. The classic representation of how cost and flexibility vary
with process choice is the product–process matrix that comes from Professors Hayes and
Wheelwright of Harvard University.
3
They represent process choices on a matrix with the
Chapter 4 Process design
95
This is an account management centre for a
large retail bank. It deals with thousands of
customer requests every day. Although each
customer request is different, they are all of the
same type – involving customers’ accounts.
Although the idea of process types is useful insomuch as it reinforces the, sometimes
important, distinctions between different types of process, it is in many ways simplistic.
In reality there is no clear boundary between process types. For example, many pro-
cessed foods are manufactured using mass-production processes but in batches. So,
a ‘batch’ of one type of cake (say) can be followed by a ‘batch’ of a marginally different
cake (perhaps with different packaging), followed by yet another, etc. Essentially this is
still a mass process, but not quite as pure a version of mass processing as a manu-
facturing process that only makes one type of cake. Similarly, the categories of service
processes are likewise blurred. For example, a specialist camera retailer would normally
be categorized as a service shop, yet it also will give, sometimes very specialized, tech-
nical advice to customers. It is not a professional service like a consultancy of course, but
it does have elements of a professional service process within its design. This is why the
volume and variety characteristics of a process are sometimes seen as being a more
realistic way of describing processes. The product–process matrix described next adopts
this approach.
Critical commentary
Mass services
Product–process matrix
Source: © Royal Bank of Scotland Group plc
M04_SLAC0460_06_SE_C04.QXD 10/20/09 9:25 Page 95
Part Two Design
96
Figure 4.4 Deviating from the ‘natural’ diagonal on the product–process matrix has
consequences for cost and flexibility
Source: Based on Hayes and Wheelwright
4
volume–variety as one dimension, and process types as the other. Figure 4.4 shows their
matrix adapted to fit with the terminology used here. Most operations stick to the ‘natural’
diagonal of the matrix, and few, if any, are found in the extreme corners of the matrix.
However, because there is some overlap between the various process types, operations might
be positioned slightly off the diagonal.
The diagonal of the matrix shown in Figure 4.4 represents a ‘natural’ lowest cost position
for an operation. Operations which are on the right of the ‘natural’ diagonal have processes
which would normally be associated with lower volumes and higher variety. This means that
their processes are likely to be more flexible than seems to be warranted by their actual
volume–variety position. Put another way, they are not taking advantage of their ability to
standardize their processes. Because of this, their costs are likely to be higher than they would
be with a process that was closer to the diagonal. Conversely, operations that are on the left
of the diagonal have adopted processes which would normally be used in a higher-volume
and lower-variety situation. Their processes will therefore be ‘over-standardized’ and prob-
ably too inflexible for their volume–variety position. This lack of flexibility can also lead to
high costs because the process will not be able to change from one activity to another as
efficiently as a more flexible process.
Detailed process design
After the overall design of a process has been determined, its individual activities must
be configured. At its simplest this detailed design of a process involves identifying all the
individual activities that are needed to fulfil the objectives of the process and deciding on
the sequence in which these activities are to be performed and who is going to do them.
The ‘natural’ diagonal
M04_SLAC0460_06_SE_C04.QXD 10/20/09 9:25 Page 96
There will, of course, be some constraints on this. Some activities must be carried out before
others and some activities can only be done by certain people or machines. Nevertheless,
for a process of any reasonable size, the number of alternative process designs is usually
large. Because of this, process design is often done using some simple visual approach such
as process mapping.
Process mapping
Process mapping simply involves describing processes in terms of how the activities within
the process relate to each other. There are many techniques which can be used for process
mapping (or process blueprinting, or process analysis, as it is sometimes called). However,
all the techniques identify the different types of activity that take place during the process and
show the flow of materials or people or information through the process.
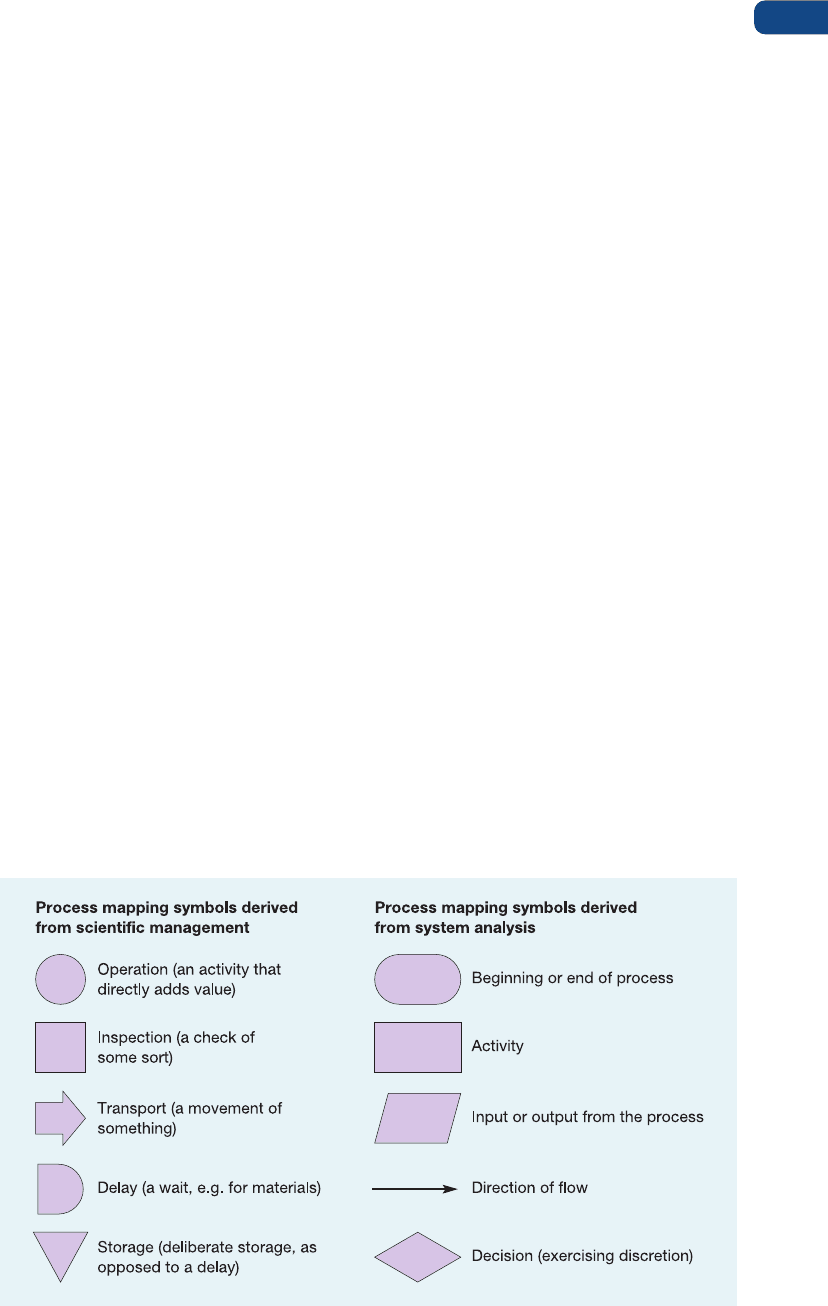
Process mapping symbols
Process mapping symbols are used to classify different types of activity. And although there
is no universal set of symbols used all over the world for any type of process, there are some
that are commonly used. Most of these derive either from the early days of ‘scientific’ manage-
ment around a century ago (see Chapter 9) or, more recently, from information system
flowcharting. Figure 4.5 shows the symbols we shall use here.
These symbols can be arranged in order, and in series or in parallel, to describe any
process. For example, the retail catering operation of a large campus university has a num-
ber of outlets around the campus selling sandwiches. Most of these outlets sell ‘standard’
sandwiches that are made in the university’s central kitchens and transported to each outlet
every day. However, one of these outlets is different; it is a kiosk that makes more expensive
‘customized’ sandwiches to order. Customers can specify the type of bread they want and
a very wide combination of different fillings. Because queues for this customized service are
becoming excessive, the catering manager is considering redesigning the process to speed
it up. This new process design is based on the findings from a recent student study of the
current process which proved that 95 per cent of all customers ordered only two types of
bread (soft roll and Italian bread) and three types of protein filling (cheese, ham and chicken).
Therefore the six ‘sandwich bases’ (2 types of bread × 3 protein fillings) could be prepared
Chapter 4 Process design
97
Figure 4.5 Some common process mapping symbols
Process mapping
Process blueprinting
Process analysis
Process mapping
symbols
M04_SLAC0460_06_SE_C04.QXD 10/20/09 9:25 Page 97
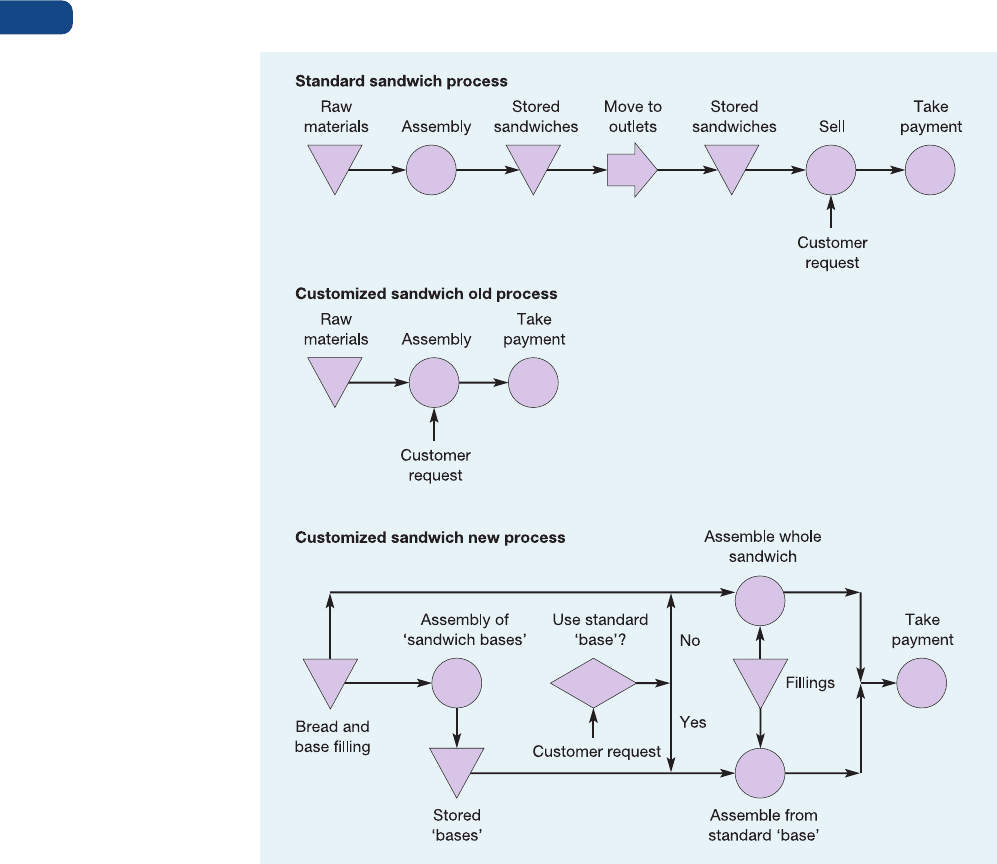
in advance and customized with salad, mayonnaise, etc. as customers ordered them. The
process maps for making and selling the standard sandwiches, the current customized
sandwiches and the new customized process are shown in Figure 4.6.
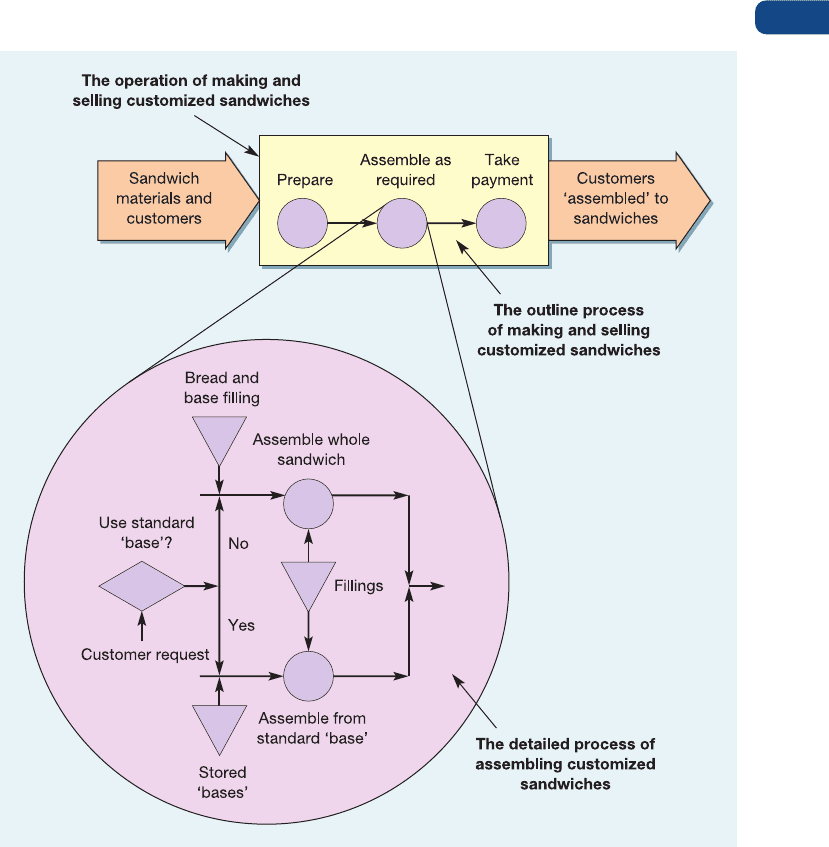
Note how the introduction of some degree of discretion in the new process makes it
more complex to map at this detailed level. This is one reason why processes are often
mapped at a more aggregated level, called high-level process mapping, before more detailed
maps are drawn. Figure 4.7 illustrates this for the new customized sandwich operation. At
the highest level the process can be drawn simply as an input–transformation–output pro-
cess with sandwich materials and customers as its input resources and satisfied customers
‘assembled’ to their sandwich as outputs. No details of how inputs are transformed into
outputs are included. At a slightly lower, or more detailed level, what is sometimes called an
outline process map (or chart) identifies the sequence of activities but only in a general
way. So the activity of finding out what type of sandwich a customer wants, deciding if it can
be assembled from a sandwich ‘base’ and then assembling it to meet the customer’s request,
is all contained in the general activity ‘assemble as required’. At the more detailed level, all
the activities are shown (we have shown the activities within ‘assemble as required’).
Part Two Design
98
Figure 4.6 Process maps for three sandwich making and selling processes
High-level process
mapping
Outline process map
M04_SLAC0460_06_SE_C04.QXD 10/20/09 9:25 Page 98
Using process maps to improve processes
One significant advantage of mapping processes is that each activity can be systematically
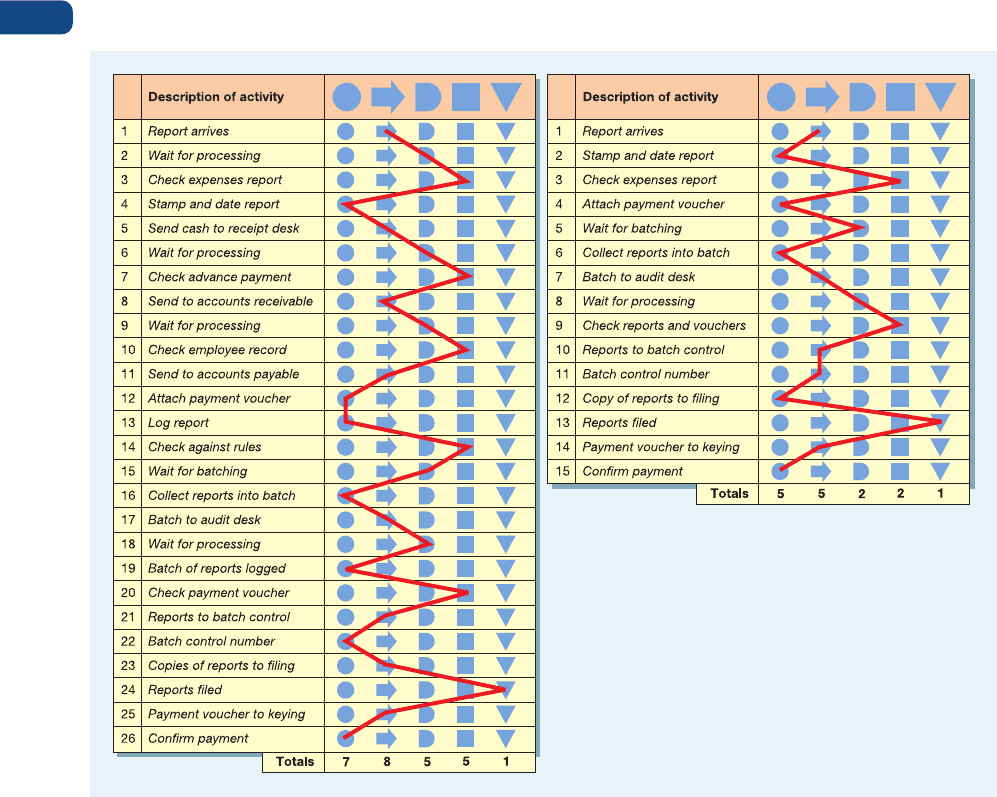
challenged in an attempt to improve the process. For example, Figure 4.8 shows the flow
process chart which Intel Corporation, the computer chip company, drew to describe its
method of processing expense reports (claims forms). It also shows the process chart for the
same process after critically examining and improving the process. The new process cut the
number of activities from 26 down to 15. The accounts payable’s activities were combined
with the cash-receipt’s activities of checking employees’ past expense accounts (activities 8,
10 and 11) which also eliminated activities 5 and 7. After consideration, it was decided to
eliminate the activity of checking items against company rules, because it seemed ‘more
trouble than it was worth’. Also, logging the batches was deemed unnecessary. All this com-
bination and elimination of activities had the effect of removing several ‘delays’ from the
process. The end-result was a much-simplified process which reduced the staff time needed
to do the job by 28 per cent and considerably speeded up the whole process.
In the case of the customized sandwich process, the new design was attempting to offer
as wide a range of sandwiches as were previously offered, without the slow service of the old
Chapter 4 Process design
99
Figure 4.7 The new customized sandwich process mapped at three levels
M04_SLAC0460_06_SE_C04.QXD 10/20/09 9:25 Page 99
process. In other words, it was maintaining similar levels of flexibility (to offer the same
variety) while improving the speed of service. The new process would probably also increase
the efficiency of the process because the sandwich ‘bases’ could be assembled during periods
of low demand. This would balance the load on staff and so cost performance would improve.
The quality of the sandwiches would presumably not suffer, although pre-assembling the
sandwich bases may detract from the fresh appearance and taste. The dependability of the
new process is less easy to assess. With the old process the time between requesting a sand-
wich and its delivery was long but reasonably predictable. The new process, however, will
deliver fairly quickly 95 per cent of the time but take longer if the sandwich is non-standard.
Table 4.2 summarizes the performance of the new design.
Throughput, cycle time and work-in-process
The new customized sandwich process has one indisputable advantage over the old process:
it is faster in the sense that customers spend less time in the process. The additional benefit
this brings is a reduction in cost per customer served (because more customers can be served
without increasing resources). Note, however, that the total amount of work needed to make
and sell a sandwich has not reduced. All the new process has done is to move some of the
work to a less busy time. So the work content (the total amount of work required to produce
a unit of output) has not changed but customer throughput time (the time for a unit to move
through the process) has improved.
Part Two Design
100
Figure 4.8 Flow process charts for processing expense reports at Intel before and after improving the process
Work content
Throughput time
M04_SLAC0460_06_SE_C04.QXD 10/20/09 9:25 Page 100

For example, suppose that the time to assemble and sell a sandwich (the work content)
using the old process was two minutes and that two people were staffing the process during
the busy period. Each person could serve a customer every two minutes, therefore every two
minutes two customers were being served, so on average a customer is emerging from the
process every minute. This is called the cycle time of the process, the average time between
units of output emerging from the process. When customers join the queue in the process
they become work-in-process (or work-in-progress) sometimes written as WIP. If the queue
is ten people long (including that customer) when the customer joins it, he or she will have
to wait ten minutes to emerge from the process. Or put more succinctly:
Throughput time
==
Work-in-process
××
Cycle time
In this case,
10 minutes wait = 10 people in the system × 1 minute per person
Little’s law
This mathematical relationship (throughput time = work-in-process × cycle time) is called
Little’s law. It is simple but very useful, and it works for any stable process. For example,
suppose it is decided that, when the new process is introduced, the average number of
customers in the process should be limited to around ten and the maximum time a customer
is in the process should be on average four minutes. If the time to assemble and sell a sand-
wich (from customer request to the customer leaving the process) in the new process has
reduced to 1.2 minutes, how many staff should be serving?
Putting this into Little’s law:
Throughput time = 4 minutes
and
Work-in-progress, WIP = 10
So, since
Throughput time = WIP × Cycle time
Cycle time =
Cycle time for the process ==0.4 minute
That is, a customer should emerge from the process every 0.4 minute, on average.
4
10
Throughput time
WIP
Chapter 4 Process design
101
Table 4.2 Assessing the performance of the new customized sandwich process
Performance objective Change with new process Comments
Quality No change? Check to make sure that sandwich bases
do not deteriorate in storage
Speed Faster for 95 per cent of
customers
Dependability Less predictable delivery Need to manage customer expectations
time regarding delivery time for non-standard
sandwiches
Flexibility No change
Cost Potentially lower cost Need to forecast the number of each
type of sandwich ‘base’ to pre-assemble
Cycle time
Work-in-process
Little’s law
M04_SLAC0460_06_SE_C04.QXD 10/20/09 9:25 Page 101

Given that an individual can be served in 1.2 minutes,
Number of servers required ==3
In other words, three servers would serve three customers in 1.2 minutes. Or one customer
in 0.4 minute.
1.2
0.4
Part Two Design
102
Mike was totally confident in his judgement, ‘You’ll never get them back in time’, he said.
‘They aren’t just wasting time, the process won’t allow them to all have their coffee and
get back for 11 o’clock.’ Looking outside the lecture theatre, Mike and his colleague Dick
were watching the 20 business people who were attending the seminar queuing to be
served coffee and biscuits. The time was 10.45 and Dick knew that unless they were all
back in the lecture theatre at 11 o’clock there was no hope of finishing his presentation
before lunch. ‘I’m not sure why you’re so pessimistic’, said Dick. ‘They seem to be interested
in what I have to say and I think they will want to get back to hear how operations manage-
ment will change their lives.’ Mike shook his head. ‘I’m not questioning their motivation’,
he said, ‘I’m questioning the ability of the process out there to get through them all in time.
I have been timing how long it takes to serve the coffee and biscuits. Each coffee is being
made fresh and the time between the server asking each customer what they want and
them walking away with their coffee and biscuits is taking 48 seconds. Remember that,
according to Little’s law, throughput equals work-in-process multiplied by cycle time. If
the work-in-process is the 20 managers in the queue and cycle time is 48 seconds, the total
throughput time is going to be 20 multiplied by 0.8 minute which equals 16 minutes. Add
to that sufficient time for the last person to drink their coffee and you must expect a total
throughput time of a bit over 20 minutes. You just haven’t allowed long enough for the
process.’ Dick was impressed. ‘Err...what did you say that law was called again?’ ‘Little’s
law’, said Mike.
Worked example
Every year it was the same. All the workstations in the building had to be renovated
(tested, new software installed, etc.) and there was only one week in which to do it. The
one week fell in the middle of the August vacation period when the renovation process
would cause minimum disruption to normal working. Last year the company’s 500 work-
stations had all been renovated within one working week (40 hours). Each renovation
last year took on average 2 hours and 25 technicians had completed the process within
the week. This year there would be 530 workstations to renovate but the company’s IT
support unit had devised a faster testing and renovation routine that would only take on
average 1
1
/2 hours instead of 2 hours. How many technicians will be needed this year to
complete the renovation processes within the week?
Last year:
Work-in-progress (WIP) = 500 workstations
Time available (T
t
) = 40 hours
Average time to renovate = 2 hours
Therefore throughput rate (T
r
) =
1
/2 hour per technician
= 0.5N
where N = Number of technicians
Worked example
M04_SLAC0460_06_SE_C04.QXD 10/20/09 9:25 Page 102

Throughput efficiency
This idea that the throughput time of a process is different from the work content of
whatever it is processing has important implications. What it means is that for significant
amounts of time no useful work is being done to the materials, information or customers
that are progressing through the process. In the case of the simple example of the sandwich
process described earlier, customer throughput time is restricted to 4 minutes, but the work
content of the task (serving the customer) is only 1.2 minutes. So, the item being processed
(the customer) is only being ‘worked on’ for 1.2/4 = 30 per cent of its time. This is called the
throughput efficiency of the process.
Percentage throughput efficiency
== ××
100
In this case the throughput efficiency is very high, relative to most processes, perhaps because
the ‘items’ being processed are customers who react badly to waiting. In most material and
information transforming processes, throughput efficiency is far lower, usually in single
percentage figures.
Work content
Throughput time
Chapter 4 Process design
103
Little’s law: WIP = T
t
× T
r
500 = 40 × 0.5N
N =
= 25 technicians
This year:
Work-in-progress (WIP) = 530 workstations
Time available = 40 hours
Average time to renovate = 1.5 hours
Throughput rate (T
r
) = 1/1.5 per technician
= 0.67N
where N = Number of technicians
Little’s law: WIP = T
t
× T
r
530 = 40 × 0.67N
N =
= 19.88 technicians
530
40 × 0.67
500
40 × 0.5
A vehicle licensing centre receives application documents, keys in details, checks the
information provided on the application, classifies the application according to the
type of licence required, confirms payment and then issues and mails the licence. It is
currently processing an average of 5,000 licences every 8-hour day. A recent spot check
found 15,000 applications that were ‘in progress’ or waiting to be processed. The sum
of all activities that are required to process an application is 25 minutes. What is the
throughput efficiency of the process?
Worked example
➔
Throughput efficiency
M04_SLAC0460_06_SE_C04.QXD 10/20/09 9:25 Page 103